Straight Line Graphs
折线图 英语作文

折线图英语作文Line Graph。
A line graph is a type of chart used to display data that changes over time. It is made up of a series of data points that are connected by straight lines, which represent the trends or patterns in the data. Line graphs are commonly used in scientific, economic, and social research to illustrate the relationships between variables.The x-axis of a line graph represents time, while they-axis represents the value of the variable being measured. The data points are plotted on the graph, and the lines are drawn between them to show how the variable changes over time. Line graphs can be used to show trends, patterns, or fluctuations in the data, and they can be used to compare multiple variables at once.For example, a line graph could be used to show the changes in temperature over the course of a year, or thechanges in stock prices over a decade. Line graphs can also be used to compare the performance of different companies, countries, or industries over time.When creating a line graph, it is important to choose the appropriate scale for the axes, so that the data is displayed clearly and accurately. It is also important to label the axes and provide a clear title for the graph, so that the reader can understand the data being presented.In conclusion, line graphs are a useful tool for visualizing data that changes over time. They can be used to show trends, patterns, and fluctuations in the data, and they can be used to compare multiple variables at once. When creating a line graph, it is important to choose the appropriate scale, label the axes, and provide a cleartitle for the graph.。
A-level数学词汇(P1-P4)
Pure mathematics1 1Algebraic expression代数表达式Index laws指数定律Indices(index的复数形式)指数Notation注释Simplify化简Power指数Base底Exponent指数Expression表达式Term项Numerator分子Expand展开Possible可能Fraction分数Bracket括号Product乘积Multiply乘Collecting like terms合并同类项Linear一次的Diagram图形Rectangle长方形Square正方形Length长度Width宽Side length边长Area面积Shade阴影Cuboid长方体Dimension维Show that证明Volume体积Given that已知Constant常数Value值Factorize因式分解Factor因子Opposite相反的Completely完全地Common factor公因式Quadratic二次的Form形式Real number实数Positive正的Negative负的Include包含Surd无理数Add加Sum和Take out提取Difference差Difference of two squares平方差Cancel取消,相互抵消Similarly同样的Rational有理的Rational number有理数Integer整数Square root平方根Evaluate求…的值Substitute代替Calculator计算器Square number平方数Irrational number无理数Decimal小数的Expansion展开式Never-ending无限的Never repeat不循环的Exact准确的Answer答案Manipulate操作Denominator分母Rationalizing denominator分母有理化Rearrange调整Prime质数Work out计算Hence然后Fully完全地State陈述Solve解决Equation方程2Quadratics二次方程式Quadratic equation二次方程Solution解Real solution实根Set设置Root根Distinct不同的Repeated root重根Case情况Straightforward简单直接的Symbol符号Plus加,正Minus减,负Factorization因式分解Shape形状Section部分Formula公式Reading off读取Coefficient系数Necessary必要的Significant figures有效数字Choose选择Suitable适当的Method方法Trapezium梯形Height高Discard丢弃Completing the square完全平方(配方)Frequently经常的Useful有用的Process过程Original最初的Determine决定Otherwise另外Function函数Mathematical数学上的Relationship关系Map映射Set集合Input输入Output输出Single单一的Notation符号Represent代表Domain定义域Range值域,范围Member成员Define定义Minimum最小的Occur发生Explain解释Consider考虑Graph图像Curve曲线Parabola抛物线Sketch画图Identify确定Key关键的Feature特征Overall整体的Cross交叉,横过Axis轴Coordinate坐标Turning point转折点(顶点)Maximum最大的Since因为Symmetrical对称的Symmetry对称性Line of symmetry对称轴Half-way位于中途的Explore探测Technology技术Plot绘制Scale刻度However但是,不管怎样Smooth平滑的Relevant相关的Intercept截距Label标记Axes(axis的复数)坐标轴Discriminant判别式Sign符号Check核实Inequality不等式Calculate计算Match匹配Prove证明Algebra代数学Diver跳水运动员Launch发射Springboard跳板Meter米Pool水池Second秒Model模型High高的Hit撞击Reach达到Non-zero非零3Equations and inequalities 方程和不等式Simultaneous联立的Linear simultaneous equations一次方程组Elimination消元法Substitution置换Quadratic simultaneous equations 二次方程组Up to直到,多达Make sure确保Correctly正确地Simplest最简的Graphically以图表形式As因为Satisfy满足Intersection相交Simultaneously同时地Intersect相交Once一次Twice两次Result结果,导致Produce产生Graph paper坐标纸Accurately准确地Verify验证Linear inequalities一次不等式Set notation集合符号Number line数轴Overlap重叠Separately单独地Illustrate图解,阐明Quadratic inequalities二次不等式Corresponding相应的Critical临界的Require要求Describe描述Interpret解释Region区域,范围Coordinate grid坐标网Dotted line虚线Solid line实线Vertex顶点Vertices(vertex的复数)顶点Within在内部,之内4Graphs and transformations 图像和转换Cubic三次的Cubic function三次函数Several几个Depend on取决于Touch接触Coordinate axes坐标轴Indicate表明,显示Reciprocal倒数的Reciprocal function反比例函数Such as例如Asymptote渐近线Approach接近Reach到达Quadrant象限Point of intersection交点Steeper更陡峭的Eventually最后,终于Reason理由,原因Appropriate恰当的Number数量Translate平移Transform改变Alter改动Subtract减Outside在外面Vertically竖直地Translation平移Vector矢量Horizontally水平地Direction方向In terms of用…来表示Slide滑动Stretch伸缩Scale factor比例系数Double两倍Halve减半,对分Inside在里面Triple三倍的Reflection反射(镜面对称) Alternatively二选一Parallel平行Lie on坐落在Pass through穿过Apply应用Unfamiliar陌生的,不熟悉的Specific特殊的Origin原点Position位置Image像Suggest提议Mark标记5Straight line graphs直线图像Gradient斜率Straight line直线Join连接Distance距离Formula公式Collinear共线的Intercept截距Define定义Either两者中的任一个Condition条件Triangle三角形General equation一般式Parallel平行Perpendicular垂直Whether是否Quadrilateral四边形Trapezium梯形Right angle直角Congruent全等的Neither两者都不Hypotenuse直角三角形斜边Line segment线段Scalene不等边的Respectively分别地Go through通过6Trigonometric ratios三角比Cosine rule余弦定理Miss缺失Version版本Exchange交换Standard标准Prove证明Opposite对边Adjacent邻边Pythagoras’theorem勾股定理Letter字母Round四舍五入Final最终的Coastguard海岸警卫队Station驻地Bearing方位Away from远离Appropriate适当的Mark标记Airport机场Due north正北Due east正东Due west正西Due south正南Sail航行Helicopter直升飞机Tee球座Flag旗Particular特定的Hole孔,洞Golf course高尔夫球场Yard码(1码=3英尺)Tee shot发球台Land着陆Largest最大的Farmer农场Field场地Fence栅栏Cargo货物Plane平面Kilometer千米Sine rule正弦定理Refer to涉及Data数据Remain剩余Located on坐落于Zookeeper动物管理员Enclosure围场Llama骆驼Diagonal对角线Surveyor检验员Measure测量Elevation高程,仰角Apart相距Assumption假设Mathematical数学的Model模型Obtuse钝角Acute锐角Isosceles等腰的Circle圆Radius半径Centre圆心Least最小的Instead代替Crane吊车Anchored固定Wreck破坏Suspend悬挂Cable缆绳Rotate旋转Level对准Proof证明Triangular plot三角图Involve涉及Trigonometry三角函数Encounter遇到Decide决定Mast桅杆In order that为了Interfere干扰Efficient有效的Hiker徒步旅行者Radar雷达Perimeter周长Tangent正切Periodic周期性的Repeat重复的Certain确定的Interval间距Period周期Undefined无意义的Knowledge知识Periodicity周期性Verify证明Variation变化Rock pool潮汐潭Midday中午During在…期间Non-exact非精准的Significant figure有效数字Windmill风车Sail帆Tower塔Deduce推导Dune沙丘Realistic现实的7Radians弧度Radian弧度So far到目前为止Probably大概,可能Degree度Revolution循环Around围绕Circle圆Subtend朝着Arc圆弧Circumference周长Convert转换Without没有Multiple倍数Arc length弧长Sector扇形Radius半径Contain包含Perimeter周长Border边界Pond池塘Consist由…组成Edge边缘Minor arc劣弧Major arc优弧Chord弦Diameter直径Template模板Brooch胸针Ferris wheel摩天轮Pod蚕茧,豆荚Estimate估计Speed速率Patio露台Lawn草坪Design设计Earring耳环Nearest最近点(精确到)Segment弓形Radii(radius的复数形式) A plot of…的一块Erect建造Along沿着Subtract减Tangent切线Ratio比例Bound关,围入Decimal place小数Midpoint中点Semicircular半圆Drawer抽屉Handle把手Difference差Badge徽章Equilateral等边的Railway铁路Track轨迹Prism三棱镜Attempt尝试Mistake错误8Differentiation微分Gradient斜率Constantly不断地Although然而Comment on对…评论Copy抄写,复制Complete完成Table表格Hypothesis假设Derivative导数Principle原理Detail细节Account解释Originate起源Formalize确定,形成Approach方式,方法Limit极限Tend to趋向Gradient function斜率函数Evaluate求…的值Fixed value定值Limiting value定值Definition定义One-at-a-time一次一个Turning point转折点(顶点)Slope斜率Disappear消失Polynomial多项式Normal切线First order derivative一阶导数Second order derivative二阶导数Rate of change变化率Respect to关于Displacement位移Acceleration加速度Local局部的9Integration积分Reverse相反的Differ不同Integrate求积分Integral积分Indefinite不确定的Indefinite integral不定积分Elongated拉长的,伸长的Arrow箭Fire射击Castle城堡Drop off下降Cliff悬崖Cyclist骑行者Pure mathematics2 1Algebraic methods代数方法Division除法Dividing polynomial多项式除法Finite有限的Whole number整数Long division长除法Quotient商Remainder余数Factor theorem因式定理Remainder theorem余数定理Logical逻辑的Structured有组织的Argument论据Statement命题Conjecture猜想Previously预先Establish建立Deduction推导Desired想要的Conclusion结论Odd number奇数Demonstration示范,演示Even number偶数Identical完全相等的Identity恒等式Parallelogram平行四边形Rhombus菱形Congruent全等的Exhaustion穷举法Consecutive连续的Square number平方数Break into拆分Is suited to适合于Disprove反驳Counter-example反例Sufficient充分的Prime number质数Divisible可整除的Either…or…二者择一的Cube number立方数Hold有效Claim宣称Opposite edge对边Hexagon六边形Regular hexagon正六边形Side length边长Reason原因2Coordinate geometry in the (x,y)plane解析几何Bisector二等分线Perpendicular bisector中垂线Averaging求平均值Endpoint端点Circumcentre外心Equidistant等距的Fixed point定点Vector向量Property性质Unique独一无二的Circumcircle外接圆3Exponentials and logarithms 指数和对数Exponential指数的Decrease减小Increase增加Smooth光滑的,平滑的Increasing function增函数Decreasing function减函数Justify证明Logarithms对数Specific特定的Button按钮Typically典型的Natural logarithms自然对数Instance实例Multiplication law乘法定律Division law除法定律Power law指数定律Recognize识别Attention注意Condition条件Complicated复杂的Whenever无论何时Convenient方便的Suppose假设Notice注意Particular特别的4The binomial expansion二项式展开Binomial二项式Pascal’s triangle杨辉三角(帕斯卡三角形)Immediately直接地Pattern图案Adjacent相邻的Investment投资Interest rate利率Annum年,岁Approximation近似值Ignore忽略Factorial notation阶乘Combination组合Superscript上标Subscript下标Probability可能性Toss投Likelihood可能性Ascending powers升幂Individual个别的Estimation估值Engineering工程学Science科学Percentage error百分误差Microchip微型集成电路片Faulty有缺点的Chip芯片Restrict限制Achieve达到School fair学校园游会Prize奖赏Digit数字Display显示5Sequences and series数列和级数Arithmetic sequence等差数列Arithmetic progression等差数列Common difference公差Arithmetic series等差级数(等差数列前n项求和)Exceed超过Inclusive包含的Stick棒子Pentagon五角形Geometric sequences等比数列Geometric progression等比数列Common ratio公比Converge收敛Alternating sequence交错数列Million百万Geometric series等比级数(等比数列前n项求和)Sum to infinity无限项求和Divergent发散的Convergent收敛的Recurring循环的Sigma notation求和符号Capital首都,大写字母Signify表示Recurrence relations递推关系Previous term前一项First term初项Generate生成,产生Periodic sequence周期数列Period周期Salary薪水Profit利润Predict预言Annual年度的Business商业Financial金融的Advisor顾问Fold折叠Thickness厚度Unrealistic不切实际的Investor投资人Account账户Thereafter以后Deposit存款,定金Wage工资Rise上升Gear齿轮Successive连续的Intermediate中间的Valuable有价值的Commission佣金Insurance保险Policy政策Prospector勘探者Drill钻孔Subsequent随后的Available可获得的Payment报酬Virus病毒Infect传染Diagnose诊断Overfish过度捕捞Chess象棋Chessboard棋盘Sponsored赞助的Polygon多边形Appointment约会,任命6Trigonometric identities and equations三角恒等式和方程Unit circle单位圆Anticlockwise逆时针Quadrant象限Equivalent相等的Equilateral triangle等边三角形Isosceles right-angled triangle等腰直角三角形Identity恒等式Reflex优角(大于180度,在第三、四象限)Principal value主值Inverse trigonometric function反三角函数Justification理由7Differentiation微分Strictly严格地Interval区间Stationary point驻点Local maximum局部最大Greatest value最大值Local minimum局部最小Least value最小值Point of inflection拐点,反曲点Immediate最接近的Vicinity邻近,附近Second derivative二次求导Rate of change改变的快慢Convex凸Concave凹Establish建立,证实Liter升Instant瞬间Tank水槽Cuboid长方体的Sheet薄片Metal金属Sphere球体Displacement位移Cylinder圆柱体Perimeter周长Semicircular半圆的Semicircle半圆Frame框架Split分离,分开Motion运动Damped阻尼Spring弹簧Bent弯的Biscuit饼干Tin罐头Close-fitting紧贴的Lid盖子Thin薄的,瘦的Wastage损耗Obtain获得Percentage百分比Store储存Capacity容量Container容器Calculus微积分学8Integration积分Definite integral定积分Indefinite integral不定积分Whereas反之,然而Upper limit上限Lower limit下限Square bracket中括号Magnitude大小Negligible可忽略的Straddle跨坐Unless除非Complicated复杂的Trapezium梯形Trapezium rule梯形法则Beneath在…下面Strip条,带Boundary边界Adjacent相邻的Improve改善Accuracy精确度Approximation近似值Underestimate低估Overestimate高估Compare比较Pure mathematics3 Common multiple公倍数Improper fraction假分数Partial fractions部分分数Degree次数Modulus function模函数Absolute value绝对值Argument辐角Set notation集合符号Piecewise-defined function分段函数Composite function复合函数Inverse function反函数Secant正割Cosecant余割Cotangent余切Interval区间Symmetry对称性Symmetrical对称的Chord弦Inverse trigonometric function反三角函数Addition formulae加法公式Compound-angle formulae复合角公式Double-angle formulae二倍角公式Round四舍五入Exponential function指数函数Natural logarithms自然对数Trend趋势Outlier极值Chain rule链式法则Product rule乘法法则Quotient rule除法法则Continuous连续的Fixed point iteration定点迭代Successive连续的Converge收敛Staircase diagram梯形图Cobweb diagram网状图Diverge发散Pure mathematics4 Contradiction反驳Assert主张Falsehood虚假Negation反论Prime number质数Split分解Separate独立的Parametric equation参数方程Variable变量Parameter参数Revolution循环Plot绘图Valid有效的As long as只要Condition条件Accurate精确的Ascending上升的Approximation近似值Implicit differentiation隐函数微分Explicitly明确的Implicit隐含的Rate of change变化率Hemisphere半球Cylindrical圆柱形的Conical圆锥形的Concave凹Convex凸Integrand被积函数Integration by substitution换元积分法Integration by part分部积分法Polynomial多项式Separating the variables分离变量General solution通解Boundary condition边界条件Directed line segment有向线段Parallelogram平行四边形Unit vector单位向量Column vector列向量Position vector位置矢量Scalene不等边的Clockwise顺时针Anticlockwise逆时针Coplanar共面的Parallelepiped平行六面体Trisect三等分Hexagon六边形Regular hexagon正六边形Direction vector方向向量Anchor固定Dot product点乘。
折线图英语作文范文
折线图英语作文范文A line graph, also known as a line chart, is a type of chart used to visualize data trends over time. It consists of a series of data points connected by straight line segments. Line graphs are commonly used in various fields such as economics, science, and social sciences to show how a particular variable changes over time or in response to different conditions. In this essay, we will discuss the characteristics of a line graph, its components, and how to interpret the information presented in a line graph.Characteristics of a Line Graph:1. X and Y Axes: A line graph has two axes the horizontal axis (X-axis) and the vertical axis (Y-axis). The X-axis typically represents time or a continuous variable, while the Y-axis represents the value of the variable being measured.2. Data Points: Data points on a line graph arerepresented by markers, such as dots or squares, atspecific time intervals or data points. These points are then connected by straight lines to show the trend over time.3. Line: The line connecting the data points represents the trend or pattern in the data. It helps to visualize how the variable changes over time or in response to different conditions.4. Title and Labels: A line graph should have a title that describes the data being represented. The X and Y axes should be labeled with the variable being measured and the units of measurement.5. Legend: If the line graph represents multiple data series, a legend is used to differentiate between the different lines or data sets.Components of a Line Graph:1. Title: The title of a line graph should clearlydescribe the data being represented.2. Axes: The X and Y axes should be labeled with the variable being measured and the units of measurement.3. Data Points: Data points should be clearly marked on the graph, and the lines connecting them should be straight.4. Legend (if applicable): If the graph represents multiple data series, a legend should be included to differentiate between them.5. Scale: The scale of the axes should be appropriateto the data being represented, allowing for easy interpretation of the graph.Interpreting a Line Graph:When interpreting a line graph, it is important to consider the following:1. Trends: Look for trends or patterns in the data. Isthe variable increasing, decreasing, or staying relatively constant over time?2. Relationships: Consider the relationship between different variables. Are there any correlations or causal relationships between them?3. Anomalies: Identify any anomalies or outliers in the data that may indicate unusual or unexpected behavior.4. Comparisons: If the graph represents multiple data series, compare the trends between them to identify any differences or similarities.In conclusion, a line graph is a useful tool for visualizing data trends over time. By understanding its characteristics, components, and how to interpret the information it presents, you can effectively use line graphs to analyze and communicate data in various fields.。
线状图 英语作文

线状图英语作文英文回答:A line graph is a type of graph that displays data points connected by straight lines. It is used to show how a variable changes over time or in relation to another variable. Line graphs are often used to compare data sets or to track trends.To create a line graph, you first need to collect your data. Once you have your data, you need to plot it on a coordinate plane. The x-axis of the coordinate plane represents the independent variable, and the y-axis represents the dependent variable. Once you have plotted your data, you can connect the data points with straight lines.Line graphs are a versatile tool that can be used to display a wide variety of data. They are easy to create and interpret, and they can be used to communicate complexinformation in a clear and concise way.Examples。
Here are some examples of how line graphs can be used:To track the stock market over time。
折线图英语作文雅思
折线图英语作文雅思英文回答:A line graph is a visual representation of data points connected by straight lines. It is typically used to track changes in data over time, or to compare different sets of data.Line graphs are often used in business, finance, and economics to track trends and patterns in data. They can also be used in scientific research to visualize the results of experiments.When creating a line graph, it is important to choose the appropriate scale for the xand y-axes. The x-axis typically represents time, while the y-axis represents the value of the data being tracked. It is also important to label the axes clearly and to use a legend to identify the different lines on the graph.Line graphs can be a powerful tool for visualizing data and identifying trends. However, it is important to remember that they are only a two-dimensional representation of the data, and they may not capture all of the complexity of the data.中文回答:折线图是一种用直线连接数据点的可视化表示形式。
lines (1)
(4, 3)
x
Examples 2.2: y = 0.5x2 − x − 4
y
x −3 −1 0 1
3
(−35, 3.5) (0, −4) ....................................................................................................................................................................................................................................................................................................................................................................................................
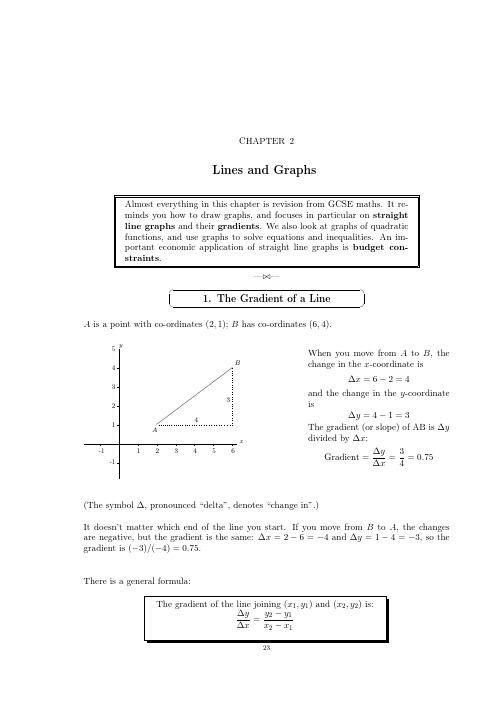
∆y 3 Gradient = = = 0.75
∆x 4
(The symbol ∆, pronounced “delta”, denotes “change in”.)
It doesn’t matter which end of the line you start. If you move from B to A, the changes are negative, but the gradient is the same: ∆x = 2 − 6 = −4 and ∆y = 1 − 4 = −3, so the gradient is (−3)/(−4) = 0.75.
straight_line_graphs_2_igcse_2

diagrdaimagraabmovaeb.ove.
[2] [2]
(b) (Wb)ritWe driotwe ndotwhenctoh-eocrdoi-noartdeisnaotfetshoefmthiedpmoidnpt oifntthoefltihne lsiengemsegnmt jeonintijnoginAin(1g,A8()1t,o8B) (t7o,B–(47),. –4).
Straight line1g1ra1p1hs 2
21 21 2)
yy 8 8A A
77
66
55
44
33
22
11
00
xx
–1 –1 1 1 2 2 3 3 4 4 5 5 6 6 7 7
–2 –2
–3 –3
–4 –4
BB
For For ExamiEnxearm's iner
Use Use
(a) (Ua)sinUgsainsgtraaisgthratiegdhgteedagned acnodmcpoamsspesasosneslyo, ncloyn,sctrouncsttrtuhcet pthereppeenrdpiecnudlaircubliasrecbtiosrecotforAoBf oAnBthoen the
Answer(c)
[3]
Permission to reproduce items where third-party owned material protected by copyright is included has been sought and cleared where possible. Ever reasonable effort has been made by the publisher (UCLES) to trace copyright holders, but if any items requiring clearance have unwittingly been included, th publisher will be pleased to make amends at the earliest possible opportunity.
straight形容词
straight形容词straight 英/streɪt/ 美/streɪt/adj.直的;连续的;异性恋的;纯的;准的;严肃的,正统的;坦诚的;整洁;简单明了的;平正的;直筒型(非紧身)的;正中目标的;规矩老实的adv.直;直接;正;径直;笔直地;立即;成直线;坦率地;连续不断地;平正地n.直道;异性恋者复数:straights比较级:straighter最高级:straightest派生词:straightness n.【不规则形式】 straighter, straightest不弯曲without curves1直的without a bend or curve; going in one direction onlya straight line直线a straight road笔直的公路long straight hair (= without curls)又长又直的头发a boat sailing in a straight line直线航行的船straight-backed chairs直背椅服装clothing2直筒型(非紧身)的not fitting close to the body and not curving away from the body a straight skirt直筒裙瞄准;打击aim/blow3准的;正中目标的going directly to the correct placea straight punch to the face不偏不倚打在脸上的一拳处于平正/ 合适的位置in level/correct position4平正的;正的;直的;与…平行的positioned in the correct way; level, vertical or parallel to sthIs my tie straight?我的领带正不正?整洁clean/neat5[not usually before noun] 整洁;整齐;井井有条clean and neat, with everything in the correct place It took hours to get the house straight.用了好半天才把房子收拾出来。
- 1、下载文档前请自行甄别文档内容的完整性,平台不提供额外的编辑、内容补充、找答案等附加服务。
- 2、"仅部分预览"的文档,不可在线预览部分如存在完整性等问题,可反馈申请退款(可完整预览的文档不适用该条件!)。
- 3、如文档侵犯您的权益,请联系客服反馈,我们会尽快为您处理(人工客服工作时间:9:00-18:30)。
y
10
Consider two points on this graph.
8
(4, 4) 6
4
(6, 4)
m y2 y1 x2 x1
2
– 10 – 8 – 6 – 4 – 2 –2 –4
2 4 6 8 10 x
44 64
0
–6
–8
The equation of the line is y 4
y=15x+40
Now think about the total cost for a range of different hire times:
If we put these values into a table,we can plot a graph.
A point lying on the line
– 10
All horizontal lines have an equation of the form y c
Consider two points on this graph.
y
10
8
(4,8)
6
m y2 y1 x2 x1
4 2
– 10 – 8 – 6 – 4 – 2 –2
2 4 6 8 10 x
Gradient is - 4 and the y axis intercept is 2 .
3
3
Calculate the gradient of each line.
Calculate the gradient of the line that passes through both points in each case.
86 44
(undefined)
–4
–6
(4, 6)
–8
The equation of the line is x 4
– 10
All vertical lines have an equation of the form x a
All straight lines have an equation of the form y mx c
m = gradient
y axis intercept
Undefined and zero gradient
Gradient is a measure of slope. If a line has zero gradient it has zero slope. A line with zero slope is horizontal.
A point not lying on the line
Points lying on the straight line
(x, y) : symbolic representation of a point
y-coordinate
x-coordinate
y=15x+40 (Equation of a straight line)
Back to Main Page
If we find the 2 points where the graph cuts the axes then we can plot the line.
These points are where x = 0 (anywhere along the y axis) and y = 0 (anywhere along the x axis).
8
2x + y = 4
7
6
5
4
3
2
1
–7 –6 –5 –4 –3 –2 –1 -1 -2 -3 -4 -5 -6
x 1 2 3 4 5 6 7 8
Back to Main Page
Exercise
Plot the following graphs using the x=0, y=0 method. 1) x + y = 5 2) x + 2y = 2 3) 2x + 3y = 6 4) x + 3y = 3
–7 –6 –5 –4 –3 –2 –1 -1 -2 -3 -4 -5 -6
x 1 2 3 4 5 6 7 8
Back to Main Page
Exercise
Using the x = 0, y = 0 method plot the following graphs:
1) x + y = 4 2) 2x + y = 2 3) x + 2y = 2 4) x + 3y = 6 5) 2x + 5y = 10
Click to reveal plotted lines
Back to Main Page
Answers
1. 3x + 2y = 6 2. x + 2y = 2 3. 2x + 3y = 6 4. x - 3y = 3
Click for further exercises
y
8 7 6 5 4 3 2 1
x 1 2 3 4 5 6 7 8
Back to Main Page
Example
By substituting these values into the equation we can find the other half of the co-ordinates.
Question: Draw the graph of 2x + y = 4
1) y = x + 2 2) y = x – 3 3) y = 2x + 4 4) y = 2x – 3 5) y = 3x + 1 6) y = 3x – 2
7) y = 1 – x 8) y = 1 – 2x
2
9) y = 2 – 3x 10) y = x + 1
2
Back tBiblioteka Main Page(a) A (1, 2) and B (3, 8) (b) A (2, -1) and B (4, 2)
(c) A (0, 6) and B(3, 9) (d) A(-1, -4) and B(-3, 2)
Exercise
y
8
7
3
Click for Answers 1) y = x - 2
6
2) y = -x + 3
Back to Main Page
The Table Method
Use the table method to plot the following lines:
1) y = x + 3 2) y = 2x – 3
x012
3) y = 2 – x
y
4) y = 3 – 2x
Click to reveal plotted lines
Back to Main Page
The Table Method
4 3 2 1
-4 -3 -2 -1 0 1 2 3 4 -1
-2
-3
3
1
Click for further
-4
exercises
4
2
Back to Main Page
Further Exercise
Using the table method, plot the following graphs.
For every position P the gradient of AP is
m yc yc
x0
x
x y c mx y mx c
Straight Lines: standard form
y = mx + c
To see what the constant, m, tells us, consider how y changes when x changes:
Solution x=0
y=0
2(0) + y = 4
2x + 0 = 4
y=4
2x = 4
x=2
1st Co-ordinates = (0,4)
2nd Co-ordinates = (2,0)
Back to Main Page
y So the graph will look like this.
y135
x = 2 y = 2(2) +1 y = 5
Now you just have to plot the points on to a graph!
Back to Main Page
The Table Method
x012
y 135
y = 2x + 1
4 3 2 1
-4 -3 -2 -1 0 1 2 3 4 -1 -2 -3 -4
The Table Method
We can use an equation of a line to plot a graph by substituting values of x into it.
Example
y = 2x + 1
x012
x = 0 y = 2(0) +1 y = 1 x = 1 y = 2(1) +1 y = 3
6) x – y = 3 7) 2x – y = 2 8) 2x – 3y = 6 9) x + 2y = 1 10) 2x – y = 3
Back to Main Page
B(x2, y2 )
y2 y1
A(x1, y1)
x2 x1
Gradient m = Vertical Height Horizontal Distance