Sub-mm imaging of a proto-cluster region at z=3.09
磁共振成像常用技术术语
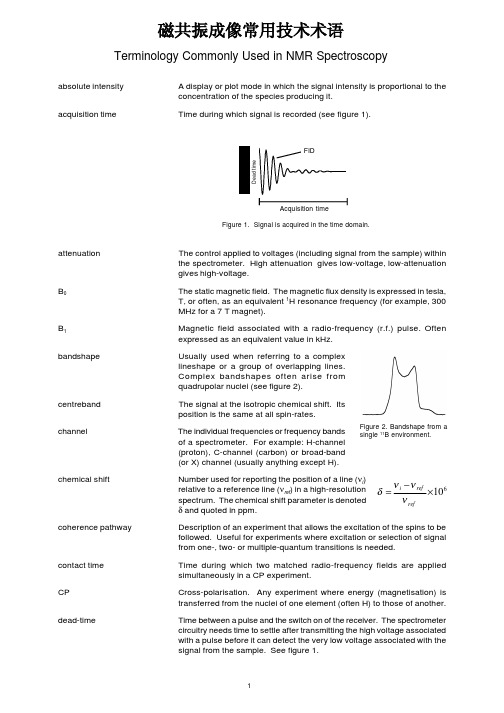
absolute intensityA display or plot mode in which the signal intensity is proportional to theacquisition timeattenuationThe control applied to voltages (including signal from the sample) within the spectrometer. High attenuation gives low-voltage, low-attenuation gives high-voltage.B 0The static magnetic field. The magnetic flux density is expressed in tesla,T, or often, as an equivalent 1H resonance frequency (for example, 300MHz for a 7 T magnet).B 1Magnetic field associated with a radio-frequency (r.f.) pulse. Often expressed as an equivalent value in kHz.bandshapeUsually used when referring to a complex lineshape or a group of overlapping plex bandshapes often arise from quadrupolar nuclei (see figure 2).centrebandThe signal at the isotropic chemical shift. Its position is the same at all spin-rates.channelThe individual frequencies or frequency bands of a spectrometer. For example: H-channel (proton), C-channel (carbon) or broad-band (or X) channel (usually anything except H).chemical shiftNumber used for reporting the position of a line (νi )relative to a reference line (νref ) in a high-resolution spectrum. The chemical shift parameter is denoted δ and quoted in ppm.coherence pathwayDescription of an experiment that allows the excitation of the spins to be followed. Useful for experiments where excitation or selection of signal from one-, two- or multiple-quantum transitions is needed.contact timeTime during which two matched radio-frequency fields are applied simultaneously in a CP experiment.CPCross-polarisation. Any experiment where energy (magnetisation) is transferred from the nuclei of one element (often H) to those of another.dead-time Time between a pulse and the switch on of the receiver. The spectrometercircuitry needs time to settle after transmitting the high voltage associatedwith a pulse before it can detect the very low voltage associated with thesignal from the sample. See figure 1.610×−=ref ref i νννδTerminology Commonly Used in NMR SpectroscopyFigure 2. Bandshape from a single 11B environment.磁共振成像常用技术术语d.c. offset Constant-value offset occurring in the FID (see “Problems”). Results ina central (zero-frequency) “spike” artefact in the spectrum whentransformed.deconvolution Mathematical process used to determine the intensities of overlappinglines.digital resolution This depends on the Fourier number. The bigger the Fourier number thegreater the number of data points per Hz of the spectrum and the higherthe digital resolution. See “Processing”.DP Direct-polarisation. An experiment in which the nuclei to be observedare excited directly.duty cycle A value used to assess whether anexperiment might damage thespectrometer (or the sample). Theduty cycle should never exceed 20 %(see “How to Choose a RecycleDelay”)dwell Spacing between data points in the time-domain. Can depend on theway acquisition is implemented but, commonly, dwell = 1/spectral width. endcap Open rotors have to be closed with endcaps before they can be spun. FID Free Induction Decay (see figure 1).field Magnetic field, with flux density quoted in T (Tesla) for the static magneticfield (B). For the magnetic field associated with an r.f. pulse the fluxdensity is given in mT or, more usually, expressed as a kHz equivalent(see “Matching”).flip-back Experimental procedure for shortening recycle times (see “How to Choosea Recycle”).Fourier number The number of points used in the FT. Always a power of 2.frequency domain Where information is displayed as a function of frequency - the spectrum FT Fourier Transform. Mathematical process to convert time-domain tofrequency-domain. Designed to work with 2n (n = integer) data points. gain Amplification applied to the received signal.Gauss Non-SI unit of magnetic field flux density. The SI equivalent is Tesla (T),1 T = 10,000 Gintensity On its own - the height of a line. Integrated-intensity is the area under theline.linebroadening Spectra can be artificially linebroadened to improve their appearance.This involves multiplying the FID with a decaying function prior to the FT.See “Processing”.lineshape The shape of individual lines in a spectrum. Commonly, Gaussian orLorentzian (figure 3) or a mixture of the two, are encounteredexperimentally.linewidth This is usually the full width at half-height (δν½)r.f. on-timer.f. on-time + r.f. off-timeduty cycle =magic-angle54.7° or 54° 44´magnetisation when described classically (non-quantum mechanically) an ensemble ofspins at equilibrium in an external magnetic field has a net magnetisationprecessing about an axis aligned along that field.magnetogyric ratio Symbol γ . A fundamental physical constant of elements with non-zerospin. For example γH is 2.675x10⁸ rads -1T -1.matchShort for Hartmann-Hahn match (see “Matching”)noisenormalised intensity Signal intensity can be multiplied by an arbitrary factor to give a particularheight to the highest (often) line or the integrated intensity. Opposite ofabsolute intensity.nuclear spin quantum number Symbol I . A fundamental property of a nucleus. Only nuclei with I > 0are said to be NMR “active”.phase (1)The phase of a pulse relates to its position in the xy plane of the rotating frame.phase (2)The phase of a spectral line comes from the way in which the real and imaginary components of a complex FT are combined (see “Processing”).phase cycling The way in which the phase of a pulse (or the receiver) is changed duringsuccessive repetitions of a pulse sequence. Used to suppress artefactsand select specific coherence pathways.ppm Parts per million. Usual way of reporting a chemical shift. A frequencydifference ∆ Hz 610×∆≈n observatio ν ppm precession“Movement of the axis of a spinning body around another axis” (as a gyroscope)probeThe business end of the spectrometer, where the sample goes.pulse angle When described in the rotating frame a pulse rotates the magnetisationthrough an angle θ. A pulse that rotates the magnetisation though 90° iscalled a 90° pulse.pulse duration Time for which a pulse occurs.quadrupole Any nucleus with I > ½.recycle (time)Or pulse delay or relaxation delay. Time between the end of dataacquisition and the start of excitation in successive repetitions of a pulsesequence. (See “How to Choose a Recycle”).referenceThe material giving the signal which defines the zero position in a high-heightresolution spectrum.repetitionsThe number of times a pulse sequence is repeated in an experiment.resolutionThe ability to separate closely spaced lines (see figure 4). As a rule of thumb,a pair of lines will be resolved if their linewidth is less than their separation.resolution enhancementThe opposite of linebroadening. An FID multiplied by an appropriate combination of increasing and decaying functions can yield extra resolution in a spectrum. See “Processing”.rotary echoA feature of an FID that occurs at intervals of 1/spin-rate (see “How to Set the Magic-angle”). They give rise to spinning sidebands in the spectrum.rotating frameA mathematical tool to make the effect of a pulse easy to visualise.Magnetisation precessing at ν Hz in a laboratory-based xyz axis system appears static in an axis system (frame) rotating at ν Hz.rotorThe container that holds the sample. Often referred to in terms of its outside diameter (for example, 5 mm).saturationCondition that arises when there is no population difference between excited and ground states. No signal is observable under such conditions.sidebandsOr spinning sidebands. Under some circumstances sidebands appear in a spectrum. They can occur on both sides of a centreband and separated from it by a frequency equal to the spin-rate. A spectrum may contain a manifold of sidebands and the centreband is not necessarily more intense than all of the sidebands.signalThe FID or one or more of the lines in a spectrum.signal-to-noise ratio (S/N)Ratio of the height of a line or signal (usually the largest) to the noise.Definitions of the measurement of noise vary. Signal increases as n (the number of repetitions) but noise only increases by √n so S/N increases by √n.spectral widthDifference in frequency of the two ends of the full spectrum. Not to be confused with the now largely obsolete term sweep width.spinA property of a nucleus with non-zero nuclear spin-quantum number (I ),as in spin-½. Or, simply, a nucleus with a magnetic moment.spin-lockIf, after a 90°x pulse a second, long-duration (spin-lock) r.f. field is applied along the y-axis the magnetisation is said to be spin-locked.spin-rateThe rate at which the sample is spun.spin-temperature inversionA manipulation carried out within the phase cycling of a CP experiment to remove magnetisation originating directly from the X-channel contact pulse.standard Any sample used to set-up the spectrometer and/or to define the zeroposition in the spectrum.Figure 4. Two lines of constant spacing but different linewidth.T 1Spin-lattice relaxation time-constant. Relates to the time taken for excited spins, in the presence of B 0, to loose energy to their surroundings and return to their equilibrium state.T 1ρSpin-lattice relaxation time-constant in the rotating frame. As for T 1 but this time in the presence of an applied radio-frequency field B 1.T 2Spin-spin relaxation time-constant. Relates to the time for a conserved exchange of energy between spins.T 2*A time-constant sometimes used to describe the decay of the observed time-domain signal (T 2* ≤ T 2). The shorter T 2* the broader the associated signal(s) in the spectrum.time-domainWhere information is recorded or displayed as a function of time (see figure 1).transmitter offsetThis allows fine control of the position of a transmitter (carrier frequency).With an appropriate offset, signals can be put exactly on-resonance or a specific amount off-resonance. Can be applied to any spectrometer channel.truncationIf the acquisition time is shorter than the FID then truncation of the FID is said to have occurred (See “Problems”).zero filling If the number of data points is not a power of two then zeroes are addedto the acquired data so that the total number of points Fourier transformedis 2n . Zero filling adds no signal to the spectrum but it can improveresolution (see “Processing”).。
mississippipdf

MISSISSIPPISUMMARY OF PLANT PROTECTION REGULATIONSUpdated June 2014Mississippi Department of Agriculture & CommerceBureau of Plant IndustryP. O. Box 5207Mississippi State, MS 39762Phone: 662-325-3390 / Fax: 662-325-8397John Campbell ......................................................................................................... B ureau DirectorState Plant Regulatory OfficialEmail: JohnCa@ Kenneth Calcote ...................................................................................Director, Plant Pest DivisionEmail: Kenneth@ Website: /departments/bpi/plant-pest-program.htmRegulations: /agency/regulations_laws/index_regl_subpart3_BPI.htmlThe information, as provided, is for informational purposes only and should not be interpreted as complete, nor should it be considered legally binding. Coordination with both your state and the destination state plant regulatory agency listed above may be necessary to stay up-to-date on revised requirements. Links to current laws and regulations can be found below.NURSERY STOCK DEFINITIONNursery Stock means all plants commonly known as nursery stock, whether field grown, greenhouse grown, or collected native plants, consisting of palms and woody perennial, trees, shrubs, seedlings, vines, roses, strawberry, blackberry and other brambles, budwood, cuttings, grafts, scions, bulbs, corms, rhizomes, or roots thereof; also other such plants and plant products grown or collected or kept for propagation, sale or distribution; excepting field, vegetable and flower seeds, cut flowers, cut ferns, cut foliage and other plant material not intended for propagation and when apparently free from injurious insect pests and plant diseases. GENERAL SHIPPING REQUIREMENTSAll nursery stock shipped into Mississippi must carry on each container or bundle a valid nursery inspection tag (inspection certificate) of the State of origin. Containers should also be plainly marked with the names and addresses of shipper and consignee.Any person receiving a shipment of plants or other articles from outside the State not in compliance with Mississippi certification and labeling requirements shall so inform the Bureauof Plant Industry or local inspector and hold such shipment unopened, subject to such inspection and disposition as may be required.NOXIOUS WEEDSA noxious weed is a plant species or classified group of plants declared by the Bureau of Plant Industry to be a public nuisance or to be especially injurious to the environment, to agricultural and horticultural production, or to wildlife and which should be controlled and the dissemination of which prevented. The sale, distribution or movement of the following plants into and within Mississippi is prohibited except under special permit for research purposes.MISSISSIPPI NOXIOUS WEED LISTBenghal dayflower (Commelina benghalensis)*Brazilian Satintail (Imperata braziliensis) *Chinese Tallow Tree/Popcorn Tree (Sapium sebiferum)Cogongrass (Imperata cylindrica) *Giant Salvinia (Salvinia molesta) *Hydrilla (Hydrilla verticillata) *Itchgrass (Rottboellia cochinchinensis) *Kudzu (Pueraria montana var. lobata) *Tropical soda apple (Solanum viarum) ** Also listed on the Federal Noxious Weed List.AQUATIC PLANTS PROHIBITED FOR SALE AND DISTRIBUTION IN MISSISSIPPIAlso, the Mississippi Department of Agriculture and Commerce has the authority under the Mississippi Aquaculture Act of 1998 (Section 79-22-9, Laws of Mississippi 1974) to regulate the cultivation and marketing of certain aquatic products. In the “Guidelines for Aquaculture Activities” regulation, the department further defined permitting requirements for the importation, selling, possessing, or transporting of species that are detrimental to the state’s native resources. The Mississippi Department of Wildlife, Fisheries, and Parks (MDWFP) and the Department of Marine Resources may advise MDAC in issuing cultivation and marketing permits (Section 49-7-80, Laws of Mississippi 1974). MDWFP determined the following species to be detrimental to the state’s native resources. Sales and distribution of the following species are prohibited in Mississippi.Egeria (African Elodea) Egeria densaWater Hyacinth Eichhornia crassipesRooted Hyacinth Eichhornia azureaEurasian Watermilfoil Myriophyllum spicatumWater Lettuce Pistia stratiotesPaperpark (Melaleuca) Melaleuca quinquenerviaREGULATED PESTS OF NON-QUARANTINE SIGNIFICANCE (List A)Regulated Pests of non-quarantine significance (List A): Includes pests of such destructive significance that they shall be controlled to meet general certification of nursery stock and/or other commodities for sale or shipment from wholesale and retail establishments. Plants and other commodities found infested/infected with pests in LIST A shall, at the discretion of the inspector, be declared unfit for sale and subject to immediate stop-sale and/or non-certification until treatment and pest control is achieved or the infested material destroyed to the satisfaction of the state entomologist. Plant material being transported into Mississippi from other states found infested/infected with pests in LIST A may be placed under stop-sale, the shipper notified of such, and arrangements made for the material to be treated and returned to the shipper. No additional quarantine measures shall be in effect unless the pest is officially placed on List B. Nursery stock and other commodities in order to meet general certification standards must be apparently free of the following pests:REGULATED PEST OF QUARANTINE SIGNIFICANCE (List B)Regulated pests of quarantine significance (List B): include pests requiring more restrictive actions to meet special requirements in order to prevent the introduction and spread of such pests into, out-of and within Mississippi. Such requirements may include quarantines, surveys, special restrictions on regulated articles, or other emergency actions for which special rules or quarantines may be officially adopted under the Mississippi Pl ant Act (“Act”). List B includes exotic species not yet detected in Mississippi posing an economic threat to the environment as well as horticultural and agricultural crops in Mississippi and includes additional pests on USDA/APHIS/PPQ’s “Regulated Plant Pest List,” as determined by the state entomologist to meet the purpose of the Act and the following:QUARANTINES OR ADDITIONAL REQUIREMENTSSWEET POTATO CERTIFICATION PROGRAMPLANT: Seed Sweet potatoes, Plants and Vine CuttingsSTATES REQUIRED: AllREQUIREMENTS: Seed sweet potatoes, plants, and vine cuttings must have attached acertificate tag of the State of Origin along with a Mississippi certificate tag with eachcontainer. Also, plants or vine cuttings, must be tied in bundles of 50 or 100 each withofficial certificate tape of the State of origin or the State of Mississippi and accompaniedby a certificate tag of the State of origin and Mississippi. Certificates of Inspection of theState of origin must be filed with and approved by the Bureau of Plant Industry beforeany shipments are made into Mississippi.SWEET POTATO WEEVIL QUARANTINEPEST: Sweet potato weevil, Cylas formicarius elegantulus (Sum)STATES REGULATED: AL, AR, FL, GA, LA, MS, SC, TXMATERIALS REGULATED: All sweet potato related materials and plants.RESTRICTIONS: Regulated materials may not move into or within the state without acertificate permit. Each container must possess a state of origin certificate permit tag.Materials from infested portions of regulated states are prohibited movement into orthrough non-infested portions of Mississippi.PHONY PEACH DISEASE QUARANTINEPESTS: Phony Peach VirusSTATES REGULATED: AL, AR, FL, GA, LA, MS, MO, SC, TN, TXMATERIALS REGULATED: Peach, plum, apricot, nectarine, and almond trees,roots or any tree or shrub budded on peach or nectarine roots.REQUIREMENTS: The movement of regulated articles into Mississippi shall beaccompanied by a certificate (securely attached to the outside of each container,package, or bundle) bearing the name and address of the consignor. Certificates or permits shall be issued only on the following conditions: (1) that each nursery inthe phony peach infested areas producing the regulated products shall apply to the State quarantine official for approval of the proposed nursery-growing site on orbefore August 15 of each year; (2) selected nursery sites shall be at least 300yards from wild or domesticated plum, 1/2 miles from phony-infested commercial orchards, and 1/2 mile from urban area; (3) the one-half environs of the nurserysite shall be inspected prior to October 1, and all phony trees found within suchenvirons removed prior to November 1; (4) all budding shall be restricted to theslip-bud method.LETHAL YELLOWING QUARANTINEPESTS: Lethal Yellowing MLO (mycoplasma-like organism)STATES REGULATED: Florida: Counties of Broward, Collier, Dade, Hendry, Martin, Palm Beach, and portions of Monroe and any additional counties that are confirmed tocontain palms infected with Lethal YellowingMATERIALS REGULATED: Palm species susceptible to Lethal Yellowing Disease.SHIPPING REQUIREMENTS: Regulated articles from the quarantined areas will beprohibited entry into the State of Mississippi. All regulated articles originating outsidethe quarantined areas will be prohibited entry unless each shipment is accompanied by a certificate from the Florida Division of Plant Industry stating the origin of the shipment. IMPORTED FIRE ANT QUARANTINEPESTS: Black Imported Fire Ant, Solenopsis richteriRed Imported Fire Ant, Solenopsis invictaREGULATED AREAS: See Federal IFA QuarantineREGULATED ARTICLES: Soil, compost, manure, humus, peat, etc., plants withroots and soil attached, grass sod, hay and straw, used mechanized soil-movingequipment.RESTRICTIONS: Certification guidelines are those listed in the USDA, APHIS,PPQ Imported Fire Ant Program Manual. See also Federal Imported Fire AntQuarantineBROWN GARDEN SNAIL QUARANTINEPEST: Brown Garden Snail, Helix aspersa MullerSTATES REGULATED: Entire state of California and other states hereinafter whichmay be found to be infested.MATERIALS REGULATED: Ornamentals, nursery stock, or any other plants, soil,sand, peat, or any other articles which may be responsible for movement of the browngarden snail.RESTRICTIONS: Regulated articles from the quarantined area will be prohibited entryinto the State of Mississippi, unless each shipment is accompanied by a certificate issued by and bearing the signature of the quarantine official of the State where shipmentoriginated, certifying that it has been determined by competent, official survey that theregulated articles contained in the shipment were inspected and found to be free of thebrown garden snail and that, further, the pest is not known to exist in the nursery or sitefrom which the shipment or regulated articles originated.Each shipment of nursery stock from an infested nursery or other regulated articles from an infested site must be accompanied by a standard Phytosanitary Export Certificateissued by the plant quarantine official of the State of origin where the shipment originated certifying that the shipment has been fumigated in a gastight chamber with methylbromide at a rate of 2 1/2 pounds per 1,000 cubic feet at 70 degrees F. or about for 2hours.A copy of the Phytosanitary Export Certificate must accompany the shipment with theusual State of origin nursery tag or certificate with one copy of the Phytosanitary Export Certificate being provided to the Bureau of Plant Industry for pre-shipment notification.Infested Shipments Arriving in Mississippi. Regulated articles arriving in Mississippi from an infested State without proper certification will be held under quarantine orreturned to the shipper at his expense, unless, infested. If infested with brown gardensnails or other dangerous pets, the shipment will be fumigated or destroyed at theshipper's expense.APPLESNAIL QUARANTINEPESTS: Snails of the family AmpullariidaeSTATES REGULATED:Entire states of California, Texas, Florida, North Carolina andHawaii and other states or territories which may be found infested.REGULATED ARTICLES: Applesnails in any living stage of development,ornamentals, nursery stock or any other plants, soil, sand, peat or any other articles which may contain applesnails.RESTRICTIONS: Each shipment from regulated areas must be accompanied by acertificate of inspection issued by a quarantine official of the state of origin stating thatthe regulated items have been inspected and found to be free of applesnails and that thepest is not known to exist in/at the nursery or site from which they were shipped.Each shipment of nursery stock from an infested nursery or other regulated articles from an infested site must be accompanied by a standard Phytosanitary Export Certificateissued by the plant quarantine official of the State of origin where the shipment originatedcertifying that the shipment has been fumigated in a gas tight chamber with methylbromide at a rate of 2 1/2 pounds per 1,000 cubic feet at 70 degrees F. or about for 2hours or with HCN at a rate of 25cc per 100 cubic feet for one hour at 50 degrees F. to 85 degrees F.A copy of the Phytosanitary Export Certificate must accompany the shipment with theusual State of origin nursery tag or certificate with one copy of the Phytosanitary Export Certificate being provided to the Bureau of Plant Industry for pre-shipment notification.Infested Shipments Arriving in Mississippi. Regulated articles arriving in Mississippi from an infested State without proper certification will be held under quarantine orreturned to the shipper at his expense, unless, infested. If infested with brown gardensnails or other dangerous pets, the shipment will be fumigated or destroyed at theshipper's expense.FORMOSAN SUBTERRANEAN TERMITE QUARANTINEPESTS: Formosan subterranean Termite, Coptotermes formosans Shiraki and otherspecies of the Genus Coptotermes.STATES REGULATED: Alabama counties of Baldwin, Calhoun, Lee and Mobile; SanDiego County in California ; Whole state of Florida; Georgia counties of Chatham, Cobb, Dekalb, Fayette, Gwinnett and Paulding; Whole State of Hawaii, Louisiana parishes ofAscension, Assumption, Beauregard, Calcasieu, Cameron, East Baton Rouge, Iberia,Iberville, Jeff Davis, Jefferson, Lafayette, LaFourche, Orleans, Plaquemines, Quachita,Sabine, St. Benard, St. Charles, St. James, St. John, St. Martin, St. Mary, St. Tammany,Tangipahoa, Terreborne, Vermillion, Washington and West Baton Rouge; North Carolina counties of Brunswick and Rutherford; South Carolina counties of Beaufort, Berkeley,Charleston, Dorchester, Orangeburg and York; Shelby County in Tennessee, Texascounties of Angelina, Aransas, Bexar, Dallas, Denton, Galveston, Hidalgo, Harris,Jefferson, Liberty, Nueces, Orange, Smith and Tarrant. Mississippi counties of Forrest,Hancock, Harrison, Hinds, Jackson, Jones, Lamar, Lauderdale, Madison, Pearl River and Rankin.REGULATED ARTICLES: Any stage of development of the formosan termite,Coptotermes formosanus, and other species of the genus Coptotermes; railroad cross ties, utility poles and all cellulose material that have been in contact with soil; and any otherproducts, articles or methods used to transport any type of article that presents a risk ofspread of the regulated pests.RESTRICTIONS: Regulated articles may be moved or sold after inspected by aninspector and deemed free of the pest, after it has been properly fumigated by a licensedor commercially certified applicator and proof of treatment is present.BENGHAL DAYFLOWER, TROPICAL SPIDERWORT QUARANTINEPESTS: Bengal Dayflower, Tropical Spiderwort, Commelina benghalensisREGULATED AREAS: Infested fields or premises in George and Jackson counties andother counties were Benghal Dayflower has been detected in Mississippi. Entire state ofGeorgia, infested counties in Alabama, North Carolina, Florida, and counties of otherstates known to be infested.REGULATED ARTICLES: Movement of regulated articles listed below into or withinthe state of Mississippi in any stage is hereby prohibited:a. All live stages of Commelina benghalensis, including seeds, vegetative growth, rootsand stolons.b. Soil from known infested fields, whether on commodities, seed or equipment.c. Farming equipment, excavation equipment and vehicles containing or holding soil orvegetative plant material coming from a known infested field, including but notlimited to peanut harvesters, combines, tillage equipment, cotton pickers, bulldozers,backhoes, excavators, dump trucks, etc.d. Hay harvested from infested fields, including peanut hay.RESTRICTIONS:Conditions governing transport or shipment of regulated articles:a. Equipment listed above may be certified to be moved out of a regulated/quarantinearea from an infested premises or field by one of the following means: (1) onceinspected and found to be free of soil and all live stages of Commelina benghalensisby an official inspector of the Bureau of Plant Industry (2) or after all the lands onwhich the piece of equipment has been operating during the last twelve months havebeen surveyed and found to be apparently free of Commelina benghalensis.b. Live stages listed above may not be moved from an infested premises or field exceptfor research purposes and only with a written permit issued by the Bureau of PlantIndustry.c. Soil may only be moved from an infested field or premises after being fumigatedwith an approved chemical to kill all life stages of Commelina benghalensis.d. Farmers harvesting hay who are not under a compliance agreement must have a fieldinspection prior to cutting hay, or in the case of peanuts prior to digging, in order toship hay out of the regulated area.e. A copy of certificate or permit issued by an official of the Bureau of Plant Industry orofficial of the issuing state must accompany each regulated item when moved from aregulated field.Infested or non-certified shipments of regulated articles from a regulated area will be held under quarantine, until certification can be documented, or returned to the shipper at hisexpense unless live stages of Commelina benghalensis are detected in which case it shall be destroyed or fumigated at the owner’s expense. If fumigation is required, the Bureauof Plant Industry nor its employees or agents, shall in any way be held responsible forinjury to regulated articles which might result from such fumigation.BAKANAE OR FOOLISH SEEDLING DISEASE QUARANTINEPESTS: Gibberella fujikuroi (bakanae strains)STATES REGULATED: The entire state of California and any other state whereinBakanae disease is found to occur.REGULATED ARTICLES: The causal agent Gibberella fujikuroi (bakanae strains),wild rice, rough rice, seed rice, research rice, milling rice, rice hulls, rice mill waste, used rice equipment and any other products, articles or means of conveyance.Exemptions: Milled / processed rice bagged and labeled for human consumption oranimal feeds containing regulated articles not destined for rice production areas.RESTRICTIONS: Regulated articles moving into or through Mississippi must have acertificate or limited permit attached to the article or to the container in which theregulated article is being moved. See quarantine for certificate or limited permitrequirements.PINK BOLLWORM QUARANTINEPESTS: Pink Bollworm, Pectinophora gossypiella SaundersSTATES REGULATED: Portions of AR, AZ, CA, LA, NM, NV, OK, and TX.REGULATED ARTICLES: Cotton plants, plant parts, plant products, used bagging and containers, used harvesting and processing equipment farm or household goods andproducts, personal belongings of transient pickers, any means of conveyance and anyother articles that may serve as host materials. Exemptions: Standard compression baled cotton lint, linters, and lint cleaner waste; trade-size lint samples, cottonseed cake andmeal, and edible okra grown in areas without pink bollworm.RESTRICTIONS: Cotton processing equipment originating in regulated states must bedismantled and cleaned in an approved manner to the satisfaction of an inspector, or befumigated before a permit will be issued for its movement into a pest-free area.Mechanical cotton pickers and used picking sacks must be accompanied by an officialfumigation certificate and sealed by the appropriate official of the state of origin.BOLL WEEVIL QUARANTINEPESTS: Boll Weevil, Anthonomus grandis BohemanREGULATED AREAS: The entire state of Mississippi and all states or portions of states infested with boll weevil.REGULATED ARTICLES: The boll weevil in any living stage of development; gintrash, seed cotton, cotton plants, bolls and used cotton equipment along with otherproducts, articles, means of conveyance, or any other item whatsoever is determined topresent a hazard in the spread of the boll weevil.RESTRICTIONS: Certificate or permit required to move regulated articles into orthrough an eradication area in Mississippi. Such certificates may be issued based onorigination in a non-infested premise having not been exposed to infestation, based ontreatment to destroy the infestation, based on having been grown, manufactured, stored or handled in such a manner they would not transmit infestation or based on an inspectionand found to be free of any infestation. Such certificates shall be securely attached to the outside of the container containing the regulated article. Regulated articles may bemoved by permit for scientific purposes.。
Discovery of a Galaxy Cluster via Weak Lensing

a r X i v :a s t r o -p h /0104094v 3 19 J u l 2001Draft version February 1,2008Preprint typeset using L A T E X style emulateapjDISCOVERY OF A GALAXY CLUSTER VIA WEAK LENSINGD.Wittman,J.A.Tyson,V.E.MargoninerBell Laboratories,Lucent Technologies,Murray Hill,NJ 07974wittman,tyson,vem@J.G.CohenAstronomy Department,California Institute of Technology,Pasadena,CA 91125jlc@I.P.Dell’AntonioPhysics Department,Brown University,Providence,RI 02912ian@Draft version February 1,2008ABSTRACTWe report the discovery of a cluster of galaxies via its weak gravitational lensing effect on background galaxies,the first spectroscopically confirmed cluster to be discovered through its gravitational effects rather than by its electromagnetic radiation.This fundamentally different selection mechanism promises to yield mass-selected,rather than baryon or photon-selected,samples of these important cosmological probes.We have confirmed this cluster with spectroscopic redshifts of fifteen members at z=0.276,with a velocity dispersion of 615km s −1.We use the tangential shear as a function of source photometric redshift to estimate the lens redshift independently and find z l =0.30±0.08.The good agreement with the spectroscopy indicates that the redshift evolution of the mass function may be measurable from the imaging data alone in shear-selected surveys.Subject headings:gravitational lensing—galaxies:clusters:general1.INTRODUCTIONClusters of galaxies are essential tools for developing our understanding of structure formation and for probing cos-mological parameters.In particular,the redshift evolution of the cluster mass function is a sensitive diagnostic of Ωm ,sufficiently sensitive that the existence of even one or two massive clusters at z ∼0.8favors a low-density universe (Donahue et al.1998,Ebeling et al.2000).This argu-ment assumes Gaussianity in the primordial fluctuations;clusters are equally useful at constraining primordial non-Gaussianity given an independent measure of Ωm (Robin-son,Gawiser &Silk 1999).Precise estimates of either quantity will require large,unbiased samples of clusters at a range of redshifts.Locally,unbiased samples are cru-cial for measuring σ8and for estimates of Ωm that rely on the fair sample hypothesis,i.e.that the composition of clusters in terms of baryon fraction or mass-to-light ra-tio is representative of the rest of the universe (Evrard 1997,Carlberg et al.1996).Finally,the evolution of the numbers of cluster-sized masses as a function of redshift constrains the cosmological constant and the dark energy equation of state (Tegmark 2001).If clusters are to serve as measures of the clumping of mass,we must identify them directly from observations of the mass distribution.This is difficult,however,because the vast majority of their matter is dark.The traditional methods of discovering clusters rely on optical emission from galaxies (e.g.Abell,Corwin &Olowin 1989;Zarit-sky,et al.1997)or X-ray emission from a hot intracluster plasma (e.g.Boehringer et al.2000).Clusters with a lower mass-to-light ratio or more baryons may well be overrep-resented in these samples.Radiation from baryons is a complicated proxy for mass,and hydrodynamic baryon-CDM models have been proposed to study bias in clusters (Blanton et al.1999).The development of weak gravitational lensing tech-niques (see Mellier 1999and Bartelmann &Schneider 2001for reviews)suggests a different approach:shear selection (Schneider 1996).Because all types of matter participate in lensing,deep,wide-field imaging will reveal in its shear pattern all mass concentrations regardless of mass-to-light ratio or baryon fraction.Of course,no single technique will be completely unbiased.For example,shear selec-tion,like optical selection and the Sunyaev-Zel’dovich ef-fect (Joy &Carlstrom 2001),will tend to be more sensitive to line-of-sight superpositions of unrelated structures,to which X-ray selection,with its dependence on the square of the density,is less vulnerable.With X-ray and (until now)shear selection,optical followup is still necessary to provide a parison of differently selected sam-ples will always be necessary.Still,the baryon and photon independence provided by shear selection are powerful fea-tures which may produce surprising new samples.Two “dark”mass concentrations,found through weak lensing analyses of apparently unrelated previously known clusters,have been reported (Erben et al.2000;Umetsu &Futamase 2000).Due to the absence of associated galaxies,the redshift and therefore masses of those clumps remain unknown.We report here the first spectroscopically con-firmed shear-selected cluster.We also introduce photomet-ric redshift techniques into the selection of sources for the weak lensing analysis.The recent development of these techniques (see Connolly et al.1995;Hogg et al.1998)greatly improves the promise of shear selection,as source galaxies may be divided into redshift bins to tune the sen-sitivity to lensing mass concentrations through a series of lens redshifts (mass tomography).In this paper,we use photometric redshifts to demonstrate that the shear-selected mass concentration is at roughly the same redshift as the cluster galaxies.This has always been an assump-12tion in lensing analyses of clusters,but this measurement implies that mass tomography is feasible.2.IMAGING OBSERVATIONS AND LENSING DETECTION We took B j V RI images of a“blank”field(containing no known cluster)centered at23:47:46+00:57:42(J2000) using the Big Throughput Camera(BTC,Wittman et al.1998)in photometric conditions at the Blanco4-m telescope of Cerro Tololo Inter-American Observatory in 1997and1998.Details of the data reduction,galaxy cat-alogs and seeing correction may be found in Wittman et al.(2000,W00);here we give only the basic parameters. Thefinal images are roughly40′square with0.43′′sam-pling and1.3′′FWHM after point-spread function correc-tions,with object counts peaking at Bj=26.4,V=26.1, R=25.6,and I=24.4(isophotal magnitudes).In the final catalog,each object’s shape is a weighted mean of the shapes measured in the differentfilters,as described in W00.In addition to the W00magnitude cut of23<R<26, we imposed a color cut of B j−R<1.5to emphasize blue field galaxies at higher redshift,a tactic often used in weak lensing analyses of known clusters(Tyson,Wenk&Valdes 1990).Using the method of Fischer&Tyson(1997),we constructed a mass map from the remaining31,000galax-ies(Figure1).A mass concentration stands out near the southwest corner;its peak is significant at the4.5σlevel, based on mass maps of bootstrap resampled catalogs.The mass concentration disappeared,as it should,under two null tests:rotating each galaxy in the catalog by45◦,and assigning the shape of a random different galaxy to each galaxy position.To check for any bias casued by proximity to thefield edge,we simulated afield of the same size and plate scalefilled with random galaxies,distorted the image as if lensed by a cluster of moderate(800km s−1)velocity dispersion,convolved and added noise to match the seeing and noise of the observations,cataloged,selected sources, and made mass maps as for the observations.Repeating this for a series of ten center-to-corner cluster positions, we found that the bias was small(<10%in peak density) and in the sense of reducing,not enhancing,our sensitivity to mass concentrations near the corner.We then made a color composite image from the B j and R images(Figure1.5,separate jpeg).A concentra-tion of reddish elliptical galaxies appears near the posi-tion of the density peak(23:46:23.85+00:45:00.8for the brightest cluster galaxy versus23:46:24.0+00:43:58.8for the density peak,a displacement of just over1′).Nothing appears at that position in the ROSAT database,and the NASA/IPAC Extragalactic Database contains only one object in the area,a large spiral which appears to be a foregroundfield galaxy.We concluded that this candidate cluster was worthy of spectroscopic followup.3.SPECTROSCOPIC FOLLOWUPWe designed a single slitmask containing26objects be-lieved to be cluster members,selected by avoiding blue objects and choosing suitably bright yellow/red galaxies in the color composite image in the area around the puta-tive cluster.This slitmask was used with the Low Resolu-tion Imaging Spectrograph(Oke et al.1995)on the Keck Telescope on the night of Nov.23,2000.A single1200sec exposure with the300l/mm grating was obtained;the spectral resolution was10˚A with a1arc-sec wide slit,and the region from4000to8000˚A was covered for each object. Two of the objects proved to be Galactic M dwarfs,while 17are members or near outliers of a cluster at z=0.276. One is a foreground galaxy,and six are background galax-ies.We assume an instrumental contribution to the ve-locity dispersion of100km/sec in the rest frame.While there are two outliers among the17possible cluster mem-bers,both sigma-clipping and the biweight estimator of Beers,Flynn&Gebhardt(1990)yield a velocity disper-sion estimate(in the rest frame)ofσv=615±150km s−1.4.LENS REDSHIFT AND MASS ESTIMATES USINGPHOTOMETRIC REDSHIFTSWith the cluster redshift in hand,we need only the red-shift distribution of the lensed sources to derive the clus-ter mass from the shear.In the past it has been diffi-cult enough to estimate the mean of this distribution,but photometric redshifts can provide a detailed distribution, in principle even an appropriate weight for each source galaxy.In this paper,we use tangential shear as a func-tion of source photometric redshift to estimate the lens redshift z l in a way independent of the spectroscopy.We demonstrate that the mass causing the shear signal is at roughly the same redshift as the cluster.For each galaxy observed in all fourfilters,we used the HyperZ package(Bolzonella,Miralles&Pell´o2000) to compute a redshift probability density function(PDF). We multiplied this by another PDF computed from the galaxy’s apparent magnitude,assuming that a Schechter (1976)luminosity function with M∗Bj=−19.73andα=−1.28(Folkes et al.1999)holds at each redshift(we as-sume H0=70km s−1Mpc−1,Ωm=0.3,andΩΛ=0.7 throughout).The latter PDF is quite broad,but serves a valuable purpose by suppressing high-redshift peaks which often appear in the former PDF.Thefirst and second mo-ments of thefinal PDF product provide the estimated red-shift and its statistical error.Henceforth,we use a catalog of26,000galaxies which is defined not by the magnitude and color cuts that went into Figure1,but by the re-quirement of detection in each of fourfilters leading to a photometric redshift.Of these26,000galaxies,13,000 were also in the initial catalog.The median z phot in this catalog is0.58.We verified the accuracy of the photometric redshifts by comparison with spectroscopic redshifts of31galaxies in the range0.23<z spec<0.83.This sample was composed of19galaxies with redshifts described in Section3(the ones detected in all fourfilters),plus another12galaxies (0.24<z<0.83)in a different region of the40′field, kindly provided by R.Guhathakurta.Wefind little bias, with(z spec−z phot)/(1+z spec)=−0.027on average,and an rms of only0.059in the same quantity.A detailed analysis of this photometric redshift method and its application to larger datasets is in preparation(Margoniner et al.2001). Before examining the dependence of the shear on source redshift,we mustfirst account for the equally large de-pendence on projected position relative to the lens.We are not interested in a detailed reconstruction of the lens; rather,for a given z phot we would like to collapse in-3formation from all sources at a wide range of projected radii into a single number characterizing the lensing sig-nal at that source redshift.Hence at a given z phot wefit a very simple model,a singular isothermal sphere(SIS), to the radial dependence of the tangential shear(cen-tered on the peak in the mass map),and use thefit-ted amplitude and its uncertainty.The assumption of a particular profile should not introduce any bias as a function of z phot.To test this,we also considered NFW (Navarro,Frenk&White1997)profiles.Although our data cannot constrain the scale radius r s,forfixed r s(225 kpc,Bartelmann,King&Schneider2001),the results do not change significantly from the SIS case.We therefore choose the SIS for simplicity.For an SIS,the tangential shearγt(r)=Σ(r)/Σcrit,whereΣ(r)∼r−1is the pro-jected mass density,Σcrit=(c2/4πG)(D s/D ls D l)is the critical density,and D s,D ls,and D l are the angular di-ameter distances from observer to source,lens to source, and observer to lens,respectively.Since only D s and D ls are changing with source redshift,the amplitude of an r−1fit to the tangential shear should grow with the distance ratio D s/D ls.Figure2shows thefitted tangential shear(at afiducial radius of1Mpc)as a function of z phot.It is consistent with zero for z phot≤0.3and increases monotonically for 0.3<z phot<1.3(the upper limit is to avoid extrapolat-ing too far beyond the range of spectroscopic verification of z phot).The dotted line illustrates the shear expected from a lens at z l=0.276,withΣfit to the points.This is a goodfit(χ2ν∼1).We explore the range of z l al-lowed by the shear data by stepping z l through the range 0.025≤z l≤1.3in steps of0.025,and refitting at each step.The probabilities corresponding toχ2at each step are plotted in Figure3.The median and mode of this distribution are at z l=0.31and0.30respectively,with a 68%confidence interval0.225<z l<0.375(these numbers change by less than0.01when an NFW profile is used). Thefit for z l=0.3is also shown in Figure2(dashed line).Thus the lens roughly coincides with the cluster of galaxies in redshift as well as in right ascension and decli-nation.This method can be used to estimate the redshift of any newly discovered lensing mass from the lensing data alone.Such a procedure may well become a standard part of shear-selected cluster surveys.Finally,we estimate the mass and mass-to-light(M/L) ratio using the best-fit projected mass.Still assum-ing an isothermal sphere,the projected mass inside of 250kpc(where it is convenient to measure the light)is 2.8±0.6×10¹⁴M⊙,assuming z l=0.276.For the range of z l allowed by theγt(z phot)curve,M proj(<250kpc) ranges from1.8−3.7×10¹⁴M⊙.The velocity dispersion implies M proj(<250kpc)=0.7±0.3×10¹⁴M⊙under the SIS assumption.The discrepancy may be due to the SIS assumption:Unlike the redshift estimate,the mass esti-mate is sensitive to the profile assumed.Converting from observed I band to rest-frame R using the approach of Fischer&Tyson(1997),wefind M/L R=(560±200)h in this pared to other clusters(Mellier1999), this is high but not exceptional.5.DISCUSSIONBaryon-unbiased samples of mass concentrations over a wide range of redshift will be of critical importance in constraining cosmological parameters.To realize the po-tential of this technique,weak lensing observations must have the sensitivity to discover clusters over a broad part of the cluster mass function.For example,constraints on Ωm from the mass function at high redshift currently in-volve only a few very massive clusters,and such extreme clusters lie far out on the tail of the mass distribution, which may not be Gaussian.Weak lensing surveys can probe clusters an order of magnitude less massive.Un-like X-ray and optical selection,a shear signal does not diminish as the square of the luminosity distance,so that low-mass clusters should be detectable even at high red-shift as long as the photometric redshifts are accurate in eliminating foreground sources.We have demonstrated the serendipitous discovery,with high signal-to-noise,of a rather modest cluster via a weak lensing analysis of a single40′field.The cluster was spec-troscopically confirmed at z=0.276,with a velocity dis-persion of615km sec−1.The tangential shear follows source(photometric)redshift in a manner which requires the lens to lie at or near the cluster redshift.Thus,all the ingredients are in place for a truly shear-selected sam-ple of clusters,in which any putative mass clump can be confirmed,and its redshift estimated,from the multi-color imaging data alone.This technique is also capable of an-swering the question of the existence of any truly dark clumps.The redshift(and therefore mass,and mass-to-light ratio lower limit)of any such clumps can only be derived from the shear versus source redshift curve.This further suggests that the promise of three-dimensional mass tomography(Tyson1995,2000)over cosmologically significant volumes can be realized in wide-field deep imaging surveys.Note that such a cluster is not unexpected in the volume probed by this data(Rah-man&Shandarin2001).Ongoing cosmic shear surveys covering tens of square degrees(e.g.the Deep Lens Sur-vey1,DESCART2)should discover significant samples of shear-selected clusters(Kruse&Schneider1999)and be-gin to constrainΩm and dark energy through the redshift evolution of the cluster mass function.We thank P.Guhathakurta for providing spectroscopic redshifts outside the cluster,and the CTIO stafffor their help with the BTC project and for their upgrading and maintenance of the delivered image quality of the Blanco telescope.Cerro Tololo Inter-American Observatory is a division of National Optical Astronomy Observatory (NOAO),which is operated by the Association of Univer-sities for Research in Astronomy,Inc.,under cooperative agreement with the National Science Foundation.BTC construction was partially funded by the NSF.12http://terapix.iap.fr/Descart4REFERENCESAbell G.O.,Corwin H.G.&Olowin R.P.1989,ApJS,70,1. Bartelmann,M.,King,L.&Schneider,P.2001,˚a,submitted,astro-ph/0103465Bartelmann,M.&Schneider,P.2001,Phys.Rep.,in press,astro-ph/9912508Beers,T.C.,,Flynn,K.&Gebhardt,K.1990,AJ,100,32 Blanton,M.,Cen,R.,Ostriker,J.P.,&Strauss,M.A.,1999,ApJ, 522,590.Boehringer,H.et al.2000,A&A,submitted,astro-ph/0012266. Bolzonella,M.,Miralles,J.-M.,&Pell´o,R.2000,A&A,363,476 Carlberg,R.G.,Yee,H.K.C.,Ellingson,E.,Abraham,R.,Gravel, P.,Morris,S.,&Pritchet,C.J.,1996,ApJ,462,32.Connolly,A.,et al.1995,AJ,110,2655.Donahue,M.,Voit,G.M.,Gioia,I.,Lupino,G.,Hughes,J.P.& Stocke,J.T.1998,ApJ,502,550Ebeling,H.,Jones,L.R.,Fairley,B.W,Perlman,E.,Scharf,C.& Horner,D.2000,ApJL,accepted,astro-ph/0012175Erben,T.,van Waerbeke,L.,Mellier,Y.,Schneider,P.,Cuillandre, J.-C.,Castander,F.J.&Dantel-Fort,M.2000,A&A355,23 Evrard,A.E.1997,MNRAS,292,289.Fischer,P.&Tyson,J.A.1997,AJ,114,14Folkes,S.et al.1999,MNRAS,308,459Hogg,D.,et al.1998,AJ,115,1418Joy,M.&Carlstrom,J.2001,Science,291,1715Kruse,G.&Schneider,P.1999,MNRAS,302,821Margoniner,V.E.et al.2001,in preparationMellier,Y.1999,ARAA37,127Navarro,J.F.,Frenk,C.S.,&White,S.D.M.1997,ApJ,490,493 Oke,J.B.,Cohen,J.G.,Carr,M.,Cromer,J.,Dingizian,A.,Harris, F.H.,Labrecque,S.,Lucinio,R.,Schaal,W.,Epps,H.,&Miller, J.1995,PASP,107,307Rahman,N.&Shandarin,S.2001,ApJ550,L121Robinson,J.,Gawiser,E.&Silk,J.2000,ApJ,532,1 Schechter,P.1976,ApJ,203,297Schneider,P.1996,MNRAS,283,837Tegmark,M.2001.Phys.Rev.D(in press);astro-ph/0101354 Tyson,J.A.,Wenk,R.A.&Valdes,F.1990,ApJ,341,L1 Tyson,J.A.1995,in Dark Matter,AIP Cong.Proc.336,eds.S. Holt&C.Bennett(AIP Press1995),p287Tyson,J.A.2000,Phys.Scripta,T85,259Umetsu,K.&Futamase,T.2000,ApJ,539,L5Wittman, D.,Tyson,J. A.,Bernstein,G.M.,Lee,R.W., Dell’Antonio,I.P.,Fischer,P.,Smith,D.R.&Blouke,M.M. 1998,Proc.SPIE3355,626Wittman, D.,Tyson,J. A.,Kirkman, D.,Dell’Antonio,I.& Bernstein,G.,2000,Nature,405,143Zaritsky,D.,Nelson,A.E.,Dalcanton,J.J.,&Gonzalez,A.H., 1997,ApJ,480,L915Fig.1.—Projected mass map,smoothed on a2′scale,of the40′field.Higher-density regions are shown darker.Contours are equally spaced in arbitary units(but linear in projected mass density);negative contours are omitted for clarity.One peak,at lower right,stands out at twice the density of any other peak(4.5σ).This mass overdensity corresponds to a small cluster of galaxies spectroscopically confirmed at z=0.276.The width of thisfield at that redshift is13Mpc.North is up and east is to the left.600.510.050.1Fig. 2.—Measured shear as a function of source photometric redshift (points).Each point represents the amplitude ofa best-fit isothermal shear profile at a fiducial radius of 1Mpc,with vertical error bars indicating the uncertainty in the fit.The dotted and dashed lines represent the shear expected from lenses at z =0.276and z =0.30,the spectroscopic and shear-derived redshifts respectively (the different amplitudes reflect slightly different best-fit masses).The horizontal error bars represent the nominal widths of the bins only;the effect of scatter in the photometric redshifts is neglected.700.510.10.20.30.40.5Fig.3.—Lens redshift probability density function (unnormalized).Solid line:at each putative lens redshift z l ,we fit alens mass to γt (z phot )(Figure 2)and compute the probability from the χ2for the remaining four degrees of freedom (five data points minus one fit parameter).Dotted line:we repeated the process assuming an NFW profile with r s =225kpc.Either assumption leads to a most probable z l within 0.03of the spectroscopic value.This figure "wittman_fig1.5.jpg" is available in "jpg" format from: /ps/astro-ph/0104094v3。
高光谱图像处理与信息提取前沿

3
3.1 3.1.1
高光谱图像处理与信息提取方法
噪声评估与数据降维方法 噪声评估 典型地物具有的诊断性光谱特征是高光谱遥
感目标探测和精细分类的前提,但是由于成像光 谱仪波段通道较密而造成光成像能量不足,相对 于全色图像,高光谱图像的信噪比提高比较困 难。在图像数据获取过程中,地物光谱特征在噪 声的影响下容易产生“失真”,如对某一吸收特征进 行探测,则要求噪声水平比吸收深度要低至少一 个数量级。因此,噪声的精确估计无论对于遥感 器性能评价,还是对于后续信息提取算法的支 撑,都具有重要意义。
张兵:高光谱图像处理与信息提取前沿
1063
得新的突破。高光谱图像处理与信息提取技术的 研究主要包括数据降维、图像分类、混合像元分 解和目标探测等方向(张兵和高连如,2011)。本文 首先从上述4个方向梳理高光谱图像处理与信息提 取中的关键问题,然后分别针对每个方向,在回 顾相关经典理论和模型方法的基础上,介绍近年 来取得的新的代表性成果、发展趋势和未来的研 究热点。此外,高性能计算技术的发展显著提升 了数据处理与分析的效率,在高光谱图像信息提 取中也得到了广泛而成功的应用,因此本文还将 介绍高光谱图像高性能处理技术的发展状况。
题制图的基础数据,在土地覆盖和资源调查以及 环境监测等领域均有着巨大的应用价值。高光谱 图像分类中主要面临Hughes现象(Hughes,1968)和 维数灾难 (Bellman , 2015) 、特征空间中数据非线 性分布等问题。同时,传统算法多是以像元作为 基本单元进行分类,并未考虑遥感图像的空间域 特征,从而使得算法无法有效处理同物异谱问 题,分类结果中地物内部易出现许多噪点。 (4) 高光谱图像提供的精细光谱特征可以用于 区分存在细微差异的目标,包括那些与自然背景 存在较高相似度的目标。因此,高光谱图像目标 探测技术在公共安全和国防领域中有着巨大的应 用潜力和价值。高光谱图像目标探测要求目标具 有诊断性的光谱特征,在实际应用中受目标光谱 的变异性、背景信息分布与模型假设存在差异、 目标地物尺寸处于亚像元级别等问题影响,有时 存在虚警率过高的问题,需要发展稳定可靠的新 方法。 此外,高光谱遥感观测的目的是获取有用的 目标信息,而不是体量巨大的高维原始数据,传 统图像处理平台和信息提取方式难以满足目标信 息快速获取的需求。尽管高性能处理器件的迅猛 发展,为亟待解决的高光谱图像并行快速处理和 在轨实时信息提取提供了实现途径,但也面临着 一系列的关键技术问题。并行处理和在轨实时处 理都需要对算法架构进行优化,同时要依据处理 硬件的特点考虑编程方面的问题,此外,在轨实时 处理还对硬件在功耗等方面提出了特殊的要求。
隐匿违禁物品探测的毫米波辐射图像融合方法

i g s h v lmiains n o c a e c n r b n dee t n,a i g f so ag rt m ba e o ma e a e i tto i c n e l d o ta a d tc i o n ma e u in l o h i sd n Co t u l tta so m sp o o e o he f so fvsb e i g s a d MMW a o ti ma e . e n o re r n fr i r p s d frt u in o ii l ma e n rdime rc i g s Th
i a e r a q ie t r u h he i v re m g sa e c u r d h o g t n e s Co tu lt r n f r .Ex rm e t l e u t h w h t h n o re ta som pe i n a r s ls s o t a t e
基于解剖学特征的乳腺X线图像胸肌分割

第39卷第8期自动化学报Vol.39,No.8 2013年8月ACTA AUTOMATICA SINICA August,2013基于解剖学特征的乳腺X线图像胸肌分割李艳凤1陈后金1杨娜1张胜君1摘要提出了基于解剖学特征(纹理特征和形状特征)的乳腺X线图像胸肌区域分割方法.融合边缘信息到谱聚类算法得到过分割图像.根据区域的亮度分布和胸肌的三角形状特征,提出区域聚合算法,从过分割图像中识别出胸肌边缘.该方法在322幅mini-MIAS(Mammographic image analysis society)乳腺图像和50幅北京大学人民医院乳腺中心乳腺图像上进行验证,实验结果表明,该方法对不同大小、形状和亮度的胸肌分割具有较强的鲁棒性.关键词图像分割,乳腺X线图像,胸肌,区域聚合,谱聚类引用格式李艳凤,陈后金,杨娜,张胜君.基于解剖学特征的乳腺X线图像胸肌分割.自动化学报,2013,39(8):1265−1272 DOI10.3724/SP.J.1004.2013.01265Pectoral Muscle Segmentation in Mammograms Based on Anatomic Features LI Yan-Feng1CHEN Hou-Jin1YANG Na1ZHANG Sheng-Jun1Abstract In this paper,an anatomic features-based method is proposed to segment the pectoral muscle region according to texture feature and shape feature.Firstly,spectral clustering combined with edge information is presented and used to segment the pectoral muscle,leading to an over-segmented result.Afterwards,a region merging algorithm is proposed on the basis of the intensity distribution of regions and the characteristic of triangle shape.Finally,the pectoral muscle is identified from the over-segmented result according to region merging.The proposed method is evaluated on322 mammograms from the mammographic image analysis society(mini-MIAS)database and50mammograms from the Breast Center of Peking University People s Hospital(BCPKUPH).The results show that the proposed method works well for pectoral muscles of different sizes,shapes and intensities.Key words Image segmentation,mammograms,pectoral muscle,region merging,spectral clusteringCitation Li Yan-Feng,Chen Hou-Jin,Yang Na,Zhang Sheng-Jun.Pectoral muscle segmentation in mammograms based on anatomic features.Acta Automatica Sinica,2013,39(8):1265−1272乳腺癌是女性最常见的一种恶性肿瘤.据世界卫生组织统计,全球每年有超过50万妇女死于乳腺癌,超过120万妇女被诊断患有乳腺癌,且其发病率正在不断上升,而增加人群主要来自发展中国家[1].随着我国国民经济的发展,人们生活方式的改变,我国己成为乳腺癌发病率增长最快的国家之一,然而若在初期进行治疗,其治愈的可能性很大.乳腺X 线摄影(Mammography)是最常用和最有效的乳腺癌筛查手段之一[2],进行乳腺X线摄影普查产生大量的乳腺X线图像(Mammogram),为了减轻医生收稿日期2012-04-27录用日期2012-10-09Manuscript received April27,2012;accepted October9,2012国家自然科学基金(61271305,61201363),中央高校基本科研业务费专项资金(2013YJS017),高等学校博士学科点专项科研基金(20110009110001)资助Supported by National Natural Science Foundation of China (61271305,61201363),Fundamental Research Funds for the Central Universities of China(2013YJS017),and Research Fund for the Doctoral Program of Higher Education of China (20110009110001)本文责任编委章毓晋Recommended by Associate Editor ZHANG Yu-Jin1.北京交通大学电子信息工程学院北京1000441.School of Electronic and Information Engineering,Beijing Jiaotong University,Beijing100044的工作量和提高检测精度,基于乳腺X线图像的计算机辅助诊断已被引入到乳腺癌的诊断工作中.在斜位视图(Mediolateral oblique,MLO)乳腺图像中,正确地分割胸肌区域具有重要意义.其可以提高乳腺密度估计和肿块检测的正确率[3],同时胸肌区域也是多视图配准中主要的标志.然而不同的成像位置和病人的个体差异,造成胸肌在大小、亮度、形状和纹理特性上呈现多样性.成像中对乳房的挤压造成腺体组织和胸肌的底部重叠.这些因素使得胸肌的自动分割仍然是一个难度较大的问题[2].目前,针对MLO中胸肌的自动分割的研究有: Ferrari等[4]使用霍夫变换分割肌区域.Kwok等[2]同样使用霍夫变换得到初始边缘,再通过边缘变化检测对初始边缘进行修正,当胸肌边缘曲率变化较大时,通过霍夫变换检测到的边缘误差很大.之后Ferrari等[5]提出使用Gabor小波多分辨率技术来检测胸肌区域,该方法克服了霍夫变换的直线假设不足,但其仅考虑边缘上每点的角度信息,会造成胸肌边缘分割不完整.Ma等[6]提出基于最小生成树(Minimum spanning tree,MST)和基于自适应金字塔(Adaptive pyramid,AP)的分割方法.MST1266自动化学报39卷方法对面积较小的胸肌识别能力较差[6],AP 方法通常会将胸肌区域内部的直线误认为胸肌边缘线.Camilus 等[3]也采用图划分思想对胸肌区域进行分割,同时引入贝塞尔曲线对胸肌边缘进行修正.Wang 等[7]提出利用离散时间序列的Markov 链进行胸肌分割,其提高了多层胸肌的检测性能,但不适用于尺寸较小的胸肌.近来Camilus 等[8]采用分水岭变换来识别胸肌边缘,然而分水岭变换导致很大程度的过度分割,从中识别出胸肌边缘比较困难.综上所述,基于霍夫变换的方法将胸肌边缘假设为直线,易导致分割错误.基于图划分的分割方法大多仅考虑亮度信息,忽略梯度信息,易造成边缘定位不准确.目前这些方法基本是以西方数据库作为实验对象,由于地理环境等影响,东西方女性乳腺组织结构存在较大差异.通常西方女性多为脂肪型腺体乳房,东方女性多为致密型腺体乳房,致密型乳腺X 线图像中正常组织相互重叠使得图像背景更复杂.针对以上问题,本文以胸肌区域的纹理一致性特征和三角形状特征为基础,实现胸肌区域的分割.1实验数据和方法1.1实验数据和预处理本文选取的实验对象为322幅mini-MIAS (Mammographic image analysis society)数据库[9]和50幅北京大学人民医院乳腺中心(The Breast of Peking University People s Hospital,BCPKUPH)乳腺图像.mini-MIAS 乳腺图像大小为1024像素×1024像素,分辨率为200µm/像素,像素宽度为8比特,其乳房区域边缘不明显,且包含人工噪声,如图1(a)所示.BCPKUPH 乳腺图像大小不固定,像素宽度为12比特,其乳房区域边缘较为明显,人工噪声较少,如图1(b)所示.为了降低处理时间,将所有图像降采样为512像素高度.图1乳腺X 线图像Fig.1Mammograms在进行胸肌分割之前,需噪声去除、背景分割和图像翻转三个预处理过程.1)噪声去除:使用中值滤波器去除图像中的破坏噪声,通过水平线检测,去除带状噪声;2)背景分割:使用多级最小交叉熵阈值分割去除背景;3)图像翻转:统计左半区域和右半区域中黑色像素点的数量,若左半部分黑色像素点数量多,则对图像进行翻转,使胸肌区域位于左上角.1.2整体算法本文算法的提出主要以胸肌区域的两个解剖学特征为基础.1)胸肌区域的纹理基本上是一致的[5];2)将胸肌区域调整到左上角且去除左边的黑色像素之后,胸肌区域接近于三角形状[6].根据胸肌区域的纹理一致性特征,本文采用谱聚类方法对其进行分割,为了提高边缘分割的准确性,提出结合边缘信息的谱聚类分割.类别数目的自动确定是谱聚类分割中已知的困难之一,对此,本文采用较大数值的类别数目进行谱聚类分割.对于其造成的过分割现象,基于区域的亮度分布和胸肌区域的类三角形特性提出区域聚合准则,对过分割区域进行区域聚合,识别正确的胸肌边缘.2基于谱聚类的分割2.1谱聚类谱聚类的思想源于谱图划分,每一个样本数据看成是图中的顶点V ,根据样本两两之间的相似度,将相应顶点之间的连接边E 赋权重W ,得到基于样本相似度的无向加权图G =(V ,E ,W )[10].在应用谱聚类分割之前,使用各向异性扩散滤波进行平滑.目前,应用谱聚类分割已有一些新的进展[11],为提高运算时间,减少存储空间,本文采用Nystrom 谱聚类算法[12].谱聚类的一般过程如下:输入.R n 上的数据集X =(x 1,x 2,···,x n )和聚类类别数k .步骤1.计算相似矩阵W .当i =j 时,W ij =e (− xi −x j 2/2σ2),W ii =0.步骤 2.计算拉普拉斯矩阵L ,L =D −1/2W D −1/2.其中,D 是对角化矩阵,D ii =j W ij .步骤3.计算L 的前k 个最小特征值及其对应的特征向量v 1,v 2,···,v k .步骤 4.v 1,v 2,···,v k 按列组成矩阵V ∈R n ×k ,归一化V 为矩阵U ,其中,u ij =v ij /( l v 2il )1/2.步骤5.对于i =1,2,···,n ,令y i ∈R k 为矩阵U 的第i 行.步骤6.采用k 均值算法将y i ∈R k 聚成k 类C 1,C 2,···,C k .8期李艳凤等:基于解剖学特征的乳腺X 线图像胸肌分割1267输出.Cluster 1,Cluster 2,···,Cluster k ,其中,Cluster i ={j |y j ∈C i }.根据实验结果,相似矩阵尺度参数σ取值为0.05.聚类类别数k 的取值为8到12.基于亮度的谱聚类仅选取亮度值作为顶点,即:x i =Int (i )(1)其中,Int 为原始图像转换后的1维向量,Int (i )为第i 个像素点的灰度值.谱聚类分割会产生一些孤立区域,为消除孤立区域对边缘检测的影响,将其与周围区域合并,合并后分割结果如图2(b)所示.图2谱聚类分割结果Fig.2Segmentation results by spectral clustering2.2结合边缘信息的谱聚类为提高边缘分割的准确性,本文引入包含边缘信息的梯度幅度作为顶点的另一个特征.采用Sobel 算子掩膜h x =[−101;−202;−101]和h y =[−1−2−1;000;121]计算水平方向和垂直方向的近似梯度G x 和G y ,由式(2)计算图像的梯度幅度G .G =G 2x +G 2y (2)其中,G x =conv(I,h x ),G y =conv(I,h y ).I 为原始图像,conv(a,b )为a 和b 的卷积.分别利用亮度最大值Int max 和梯度幅值的最大值G max 对亮度和梯度进行归一化,Int norm (i )=Int (i )/IntInt max ,G norm (i )=G (i )/G max .以归一化后的结果作为顶点的特征,即x i =[Int norm (i ),G norm (i )].使用此顶点进行谱聚类并进行区域合并的结果如图2(c).可见本文方法边缘分割更准确.3胸肌边缘识别胸肌区域纹理的变化和选取较大值的聚类类别数,造成了胸肌区域的过分割,因而需要对过分割结果进行区域聚合,以识别出胸肌边缘.3.1区域表达谱聚类算法将原始图像分为不同的类Cluster i和其对应的边缘Edge i ,表达为式(3).Cluster =k i =1Cluster iEdge =k i =1Edge iI =(Cluster ,Edge)(3)I 为原始图像,Cluster i 为图像I 中被标记为第i 类的像素点集合,Edge i 由Cluster i 的边缘点组成.k 为聚类类别数,k 个Cluster i 的并集组成Cluster,k 个Edge i 的并集组成Edge.每一个类至少包含一个连通区域,连通区域与类的关系如下:Cluster i =m i j =1Region i,jEdge i,j ={(x,y )∈Edge |(x,y )∈Region i,j }Edge i =m ij =1Edge i,j (4)Region i,j 是Cluster i 中第j 个连通区域,Region i,j 的边缘点组成集合Edge i,j ,m i 是Cluster i 中连通区域的个数.谱聚类分割后,原始图像被表达为不同的连通区域及其对应的边缘的集合,如图3所示.图3原始图像区域表达Fig.3Region representation of the original mammogram1268自动化学报39卷3.2区域聚合准则使用区域的亮度分布和胸肌区域的类三角形状特征进行区域聚合.包括以下两个过程:1)采用直方图信息代表区域的亮度分布,根据亮度分布相似度进行区域聚合.每个区域仅包含所有灰度值的一部分,若统计0∼255灰度值间每一个灰度的像素个数,区域间的相似度过低,考虑将0∼255等分为16个区间进行灰度值统计.16个亮度区间为interval(1)∼interval(16),计算如式(5):interval(i)=256(i−1)16:256i16−1,(5)i=1,2,···,16第i个区间的直方图h(i)为h(i)=jn jn,j∈interval(i)(6)其中,n j为图像中灰度值为j的像素个数,n为图像像素点的个数.使用Region表示谱聚类分割后的所有连通区域,即:Region=ki=1m ij=1Regioni,j(7)采用Bhattacharyya系数[13−14]定义Regionp 和Regionq的亮度相似度Sim(p,q),其计算如下:Sim(p,q)=16i=1h p(i)·h q(i)(8)h p(i)和h q(i)分别为Regionp 和Regionq的第i个区间的直方图.根据亮度相似度大小,依次聚合所有区域,直至所有区域聚合为一个整体.所有聚合结果构成树形分割,树的底部为每一个连通区域,树的顶部为整幅图像[15].树形分割形成如下:输入.集合Region.步骤1.计算Region内两两区域间的Sim值,寻找Sim最大值对应的区域Regionp 和Regionq.步骤2.聚合Regionp 和Regionq为新的区域Regionr ,即Regionr=Regionp∪Regionq.步骤3.将Regionr添加到Region中,同时从Region中去除Regionp 和Regionq,即:Region={Region∪Regionr \(Regionp,Regionq)}.步骤4.重复步骤1,到所有区域聚合为一个区域.输出.每一次聚合结果Regionr和其对应的边缘Edger .2)根据三角形状准则,从树形分割结果中识别胸肌边缘.根据以下两个准则寻找胸肌区域分割结果:a)经翻转后胸肌区域位于图像的左上角;b)胸肌区域形状与直角三角形状基本类似.胸肌区域的底部与腺体组织没有有效分离时,可能造成分割的区域与直角形差别较大.对此,本文选取图像中靠上的部分进行三角形状验证.根据直角三角形面积等于两直角边长乘积一半特征,定义三角形系数为分割的区域面积和边长相乘得到的面积之比.当系数接近1时,该区域满足三角形状.为了适应胸肌区域的多层结构,在所有满足三角形状的分割结果中,选取面积最大的分割结果作为胸肌分割结果.图4(a)为本文谱聚类分割结果,由准则1)和2)聚合的胸肌区域如图4(b)所示.图4区域聚合Fig.4Region merging由于腺体组织的影响,底部的胸肌边缘没有被正确识别(图4(b)中的图像底部).根据胸肌的三角形状,对底部边缘进行修正.胸肌区域的类三角形特征保证从上到下,胸肌最左侧到最右侧的宽度基本上是逐渐下降的.设E(i)为胸肌最右侧边缘第i行的横坐标,则E为单调不增函数,E的差分(由式(9)计算)应小于等于0.同时胸肌边缘是连续的,因而E为平滑曲线,其差分应大于某一负值.diff(i)=E(i+1)−E(i)(9)图4(b)中E的差分如图5所示.在胸肌边缘的上部(图5中0∼50),边缘点差分值小于等于0,且变化幅度较小,说明边缘识别正确;在胸肌边缘的底部(图5中100∼150),边缘点差分值变化范围很大,说明该范围内胸肌边缘识别错误.将diff(i)>0且diff(i)<−2的边缘点记为失效点Ind(i).使用与其相邻的点修正Ind(i),修正后的点记为R(i).对于非边缘底部的失效点,设失效点的范围为i1∼i2,且i1≤i2,R(i)计算如下:R(i)=E(i1−1)−E(i1−1)−E(i2+1)i2−i1+2×8期李艳凤等:基于解剖学特征的乳腺X 线图像胸肌分割1269(i −i 1+1)(10)图5边缘点的差分Fig.5Difference of the edge points对于边缘底部的失效点,失效点的范围为i 1∼i 2,且i 1≤i 2,由于i 2为图像的底行,仅使用i 1上面的有效点计算R (i ),如式(11)所示.R (i )=E (i 1−1)−E (i 1−α)−E (i 1−1)α−1×(i −i 1+1)(11)α为修正尺度,实验中取值为10.修正后胸肌边缘如图4(c)所示,底部的胸肌边缘被正确分割.4实验结果及讨论部分实验结果如图6所示.对于不同的面积(图6(a)和6(b))、不同的曲率(图6(c)和6(d))、复杂纹理(图6(e))、对比度低(图6(f))、多层结构(图6(g))等情况均能得到很好的分割结果.图6(h)中,胸肌区域的上部和下部的斜率和亮度变化较大,本文方法正确分割出胸肌区域.从这些结果可以看出本文提出的分割方法具有很好的鲁棒性.图6胸肌分割结果Fig.6Segmentation results of some pectoral muscles图7和图8为本文提出的分割方法与其他分割方法的比较.图7中腋窝的褶皱呈现出和胸肌区域相似的特征,文献[2]中的方法将腋窝误认为胸肌,如图7(c)所示;而本文方法分割出正确的边缘,如图7(d)所示.图7mini-MIAS 中mdb065的分割比较Fig.7Segmentations of mdb065from mini-MIAS图8中外层胸肌对比度低于内部结构对比度,基于AP [6]的胸肌分割方法将内层直线误认为胸肌边缘线,如图8(c)所示.而本文分割结果与医生手工分割结果误差较小,如图8(d)所示.图8mini-MIAS 中mdb039的分割比较Fig.8Segmentations of mdb039from mini-MIAS图9中,本文方法在胸肌较长情况中出现了欠分割现象.该图下部的胸肌区域与上部的胸肌区域亮度差别较大,且胸肌边缘出现了微小断裂.图9(b)为医生分割结果,图9(c)为本文方法识别的胸肌区域.基于霍夫变换、Gabor 滤波和分水岭变换的分割方法,在该图像中也出现了欠分割现象.图9mini-MIAS 数据库中mdb075的分割比较Fig.9Segmentations of mdb075from mini-MIAS使用面积归一化误差[5]、行归一化误差[6]和豪斯道夫(Hausdorff)距离[16]三个准则进行定量评1270自动化学报39卷价.为与已有方法在同一实验对象下进行比较,将Ferrari等[5]提供医生分割结果的84幅mini-MIAS数据库中的图像作为实验对象.4.1面积归一化误差分析面积归一化误差定义为:假阳性(False positive,FP)和假阴性(False negative,FN)像素点占胸肌面积之比.根据文献[5]的定义,FP像素点为算法识别为胸肌区域而医生认为不是胸肌区域;FN像素点为算法没有识别为胸肌区域而医生认为是胸肌区域.将胸肌区域调整为左上角后,FP像素点的比例(F P I)和FN像素点的比例(F N I)计算如下:F P I=1A(I)pi=1max{0,E alg(i)−E rad(i)}F N I=1A(I)pi=1max{0,E rad(i)−E alg(i)}(12)其中,A(I)为图像I中医生标注的胸肌区域的面积, p是胸肌区域出现的行数,E alg(i)为算法分割的胸肌边缘点的横坐标,E rad(i)为医生标注的胸肌边缘点的横坐标.平均假阳性误差(F P m)和平均假阴性误差(F N m)由式(13)计算,N为测试图像的个数,本文为84.F P m=1NNi=1F P i,F N m=1NNi=1F N i(13)表1基于面积归一化误差的分割性能比较Table1Comparisons by area normalized errorHough Gabor AP本算法F P m0.01980.00580.03710.0216F N m0.25190.05770.05950.0506 F P<0.05&F N<0.0510455049min(F P,F N)<0.05&001823 0.05<max(F P,F N)<0.10min(F P,F N)<0.05&00117 max(F P,F N)>0.100.05<F P<0.10&822030.05<F N<0.100.05<min(F P,F N)<0.100002&max(F P,F N)>0.10F P>0.10&F N>0.10661750将本文提出的方法与已有方法在面积归一化误差方面进行比较,如表1所示.在平均假阴性误差F N m方面,本文方法是最低的,为0.0506;同时平均假阳性误差F P m也在可以接受的范围.在高精度分割方面,即F P和F N同时小于0.05,或F P 和F N中最小值小于0.05,另一项在0.05和0.1之间,本文接近86%的分割处于该范围,高于其他方法(霍夫变换[4]、Gabor滤波[5]和AP[6]的方法分别为12%、53.5%和81%).对于错误分割方面,本文方法只有2幅图像误差较大,低于现有的一些方法(霍夫变换[4]、Gabor滤波[5]和AP[6]的方法分别为66、17和5).以上分析表明本文方法具有较高的分割精度和较低的错误分割率.4.2行归一化误差分析行归一化误差(Row normalized error,RNE)定义为:在胸肌区域中,算法识别的胸肌边缘点与医生手工分割的边缘点之间的距离平均值,计算:RNE=1ppi=1|E rad(i)−E alg(i)|(14)本文分割结果的RNE分布情况如图10所示.由于只有文献[6]给出该指标,仅与文献[6]中的两种方法对比.对于高精度分割,即RNE小于5个像素点(1.0mm)的图像,MST方法在该项中约占50%,AP方法约占65%,本文约为60%.在最大误差分割方面,本文方法RNE的最大值在30∼35 (6.0mm∼7.0mm),而MST方法RNE的最大值在115∼120(23.0mm∼24.0mm)之间,AP方法RNE的最大值在80∼85(16.0mm∼17.0mm)之间.以上结果表明本文提出的方法在图像分割的精度上高于MST方法,且错误分割率低于MST方法.AP方法的图像分割精度与本文相似,但本文的错误分割率较低.图10本文方法的行归一化误差分析Fig.10The RNE analysis of the proposed method 4.3Hausdorff距离分析手工分割结果中的边缘点集(A)和算法识别出8期李艳凤等:基于解剖学特征的乳腺X线图像胸肌分割1271的边缘点集(B)之间的Hausdorff距离[16]定义为H(A,B).H(A,B)=max(h(A,B),h(B,A))h(A,B)=max p∈A min q∈B(D(p,q))(15) D(p,q)为p,q两点的欧氏(Euclidean)距离. Hausdorff距离的平均值代表方法的准确性,标准差代表方法的稳定性.本文方法Hausdorff距离的平均值和标准差为3.65±1.45mm.霍夫变换[4]和Gabor小波[5]方法的平均值和标准差分别为7.08±5.26mm和3.84±1.73mm.本文方法在均值和标准差方面均优于文献[4−5].基于分水岭变换[8]方法距离的均值和标准差为3.85±1.07mm.本文方法稳定性较文献[8]差一些,但准确性上胜过文献[8].5结论本文提出了一种乳腺X线图像胸肌分割方法,分割精度较高.将梯度信息融入到谱聚类中,较好地避免了错分现象.在谱聚类类别数目选取的难点上,本文采用较大数目类别数进行分割,通过区域聚合处理过分割现象,减弱了分割正确性对聚类类别数的依赖性.本文后续的工作是研究尺度参数对谱聚类结果的影响,实现尺度参数的自适应选取.致谢医生手工分割结果由Camilus K S提供,分割医生为Rangayyan R M,作者对此表示感谢.同时感谢北京大学人民医院乳腺中心提供的乳腺X线图像.References1WHO Media Centre.WHO cancer fact sheets[Online],avail-able:http://www.who.int/mediacentre/factsheets/fs297/ en/index.html,February1,20122Kwok S M,Chandrasekhar R,Attikiouzel Y,Rickard M T.Automatic pectoral muscle segmentation on mediolateral oblique view mammograms.IEEE Transactions on Medical Imaging,2004,23(9):1129−11403Camilus K S,Govindan V K,Sathidevi P puter-aided identification of the pectoral muscle in digitized mammo-grams.Journal of Digital Imaging,2010,23(5):562−5804Ferrari R J,Rangayyan R M,Desautels J E L,Frere A F.Segmentation of mammograms:identification of the skin-air boundary,pectoral muscle,andfibro-glandular disc.In:Proceedings of the5th International Workshop Digital Mammography.Toronto,Canada:American Roentgen Ray Society,2001.573−5795Ferrari R J,Rangayyan R M,Desautels J E L,Borges R A, Frere A F.Automatic identification of the pectoral muscle in mammograms.IEEE Transactions on Medical Imaging, 2004,23(2):232−2456Ma F,Bajger M,Slavotinek J P,Bottema M J.Two graph theory based methods for identifying the pectoral muscle in mammograms.Pattern Recognition,2007,40(9): 2592−26027Wang L,Zhu M L,Deng L P,Yuan X.Automatic pec-toral muscle boundary detection in mammograms based on Markov chain and active contour model.Journal of Zhejiang University:Science C,2010,11(2):111−1188Camilus K S,Govindan V K,Sathidevi P S.Pectoral muscle identification in mammograms.Journal of Applied Clinical Medical Physics,2011,12(3):215−2309Suckling J.Mammographic image analysis society mini mammographic database[Online],available:http://peipa./ipa/pix/mias/,January19,199910Shi J B,Malik J.Normalized cuts and image segmentation.IEEE Transactions on Pattern Analysis and Machine Intel-ligence,2000,22(8):888−90511Liu Song-Tao,Yin Fu-Liang.The basic principle and its new advances of image segmentation methods based on graph cuts.Acta Automatica Sinica,2012,38(6):911−922(刘松涛,殷福亮.基于图割的图像分割方法及其新进展.自动化学报,2012,38(6):911−922)12Fowlkes C,Belongie S,Chung F,Malik J.Spectral grouping using the Nystrom method.IEEE Transactions on Pattern Analysis and Machine Intelligence,2004,26(2):214−2251272自动化学报39卷13Tung F,Wong A,Clausi D A.Enabling scalable spec-tral clustering for image segmentation.Pattern Recognition, 2010,43(12):4069−407614Comaniciu D,Ramesh V,Meer P.Kernel-based object tracking.IEEE Transactions on Pattern Analysis and Ma-chine Intelligence ,2003,25(5):564−57715Arbel´a ez P,Maire M,Fowlkes C,Malik J.Contour detec-tion and hierarchical image segmentation.IEEE Transac-tions on Pattern Analysis and Machine Intelligence,2011, 33(5):898−91616Huttenlocher D P,Klanderman G A,Rucklidge W -paring images using the Hausdorffdistance.IEEE Transac-tions on Pattern Analysis and Machine Intelligence,1993, 15(9):850−863李艳凤北京交通大学电子信息工程学院博士研究生.2006年获得北京交通大学通信工程学士学位.主要研究方向为生物医学图像处理及其应用.E-mail:*****************.cn(LI Yan-Feng Ph.D.candidate atthe School of Electronic and Informa-tion Engineering,Beijing Jiaotong Uni-versity.She received her bachelor degree from Beijing Jiaotong University in2006.Her research interest covers biomedical image processing and applications.)陈后金北京交通大学电子信息工程学院教授.主要研究方向为数字信号和图像处理.本文通信作者.E-mail:***************.cn(CHEN Hou-Jin Professor at theSchool of Electronic and InformationEngineering,Beijing Jiaotong Univer-sity.His research interest covers digital signal and image processing.Corresponding author of this paper.)杨娜中北大学讲师,北京交通大学电子信息工程学院博士研究生.主要研究方向为信息处理和神经网络.E-mail:*****************.cn(YANG Na Lecturer at the Schoolof Electronic and Information Engineer-ing,North University of China andPh.D.candidate at the School of Elec-tronic and Information Engineering,Beijing Jiaotong Uni-versity.Her research interest covers information processing and neural networks.)张胜君北京交通大学电子信息工程学院博士研究生.主要研究方向为生物医学图像处理和模式识别.E-mail:*****************.cn(ZHANG Sheng-Jun Ph.D.can-didate at the School of Electronic andInformation Engineering,Beijing Jiao-tong University.Her research interest covers biomedical image processing and pattern recogni-tion.)。
A high-flux high-order harmonic source
A high-flux high-order harmonic sourceP. Rudawski, C. M. Heyl, F. Brizuela, J. Schwenke, A. Persson, E. Mansten, R. Rakowski, L. Rading, F. Campi, B. Kim, P. Johnsson, and A. L’HuillierCitation: Review of Scientific Instruments 84, 073103 (2013); doi: 10.1063/1.4812266View online: /10.1063/1.4812266View Table of Contents: /content/aip/journal/rsi/84/7?ver=pdfcovPublished by the AIP PublishingAdvertisement:REVIEW OF SCIENTIFIC INSTRUMENTS84,073103(2013)A high-flux high-order harmonic sourceP.Rudawski,1,a)C.M.Heyl,1F.Brizuela,1J.Schwenke,1A.Persson,1E.Mansten,2R.Rakowski,1L.Rading,1F.Campi,1B.Kim,1P.Johnsson,1and A.L’Huillier11Department of Physics,Lund University,P.O.Box118,SE-22100Lund,Sweden2MAX-lab,Lunds Universitet,P.O.Box118,SE-22100Lund,Sweden(Received12March2013;accepted11June2013;published online9July2013)We develop and implement an experimental strategy for the generation of high-energy high-order harmonics(HHG)in gases for studies of nonlinear processes in the soft x-ray region.We generate high-order harmonics by focusing a high energy Ti:Sapphire laser into a gas cellfilled with argon or neon.The energy per pulse is optimized by an automated control of the multiple parameters that influence the generation process.This optimization procedure allows us to obtain energies per pulse and harmonic order as high as200nJ in argon and20nJ in neon,with good spatial properties, using a loose focusing geometry(f#≈400)and a20mm long medium.We also theoretically ex-amine the macroscopic conditions for absorption-limited conversion efficiency and optimization of the HHG pulse energy for high-energy laser systems.©2013Author(s).All article content,except where otherwise noted,is licensed under a Creative Commons Attribution3.0Unported License.[/10.1063/1.4812266]I.INTRODUCTIONHigh-order harmonics generated by the nonlinear inter-action of an intense ultrashort laser pulse with atoms ormolecules are now used in manyfields of physics.The in-terest in the generated radiation results from unique featureslike tunability over the extreme ultraviolet(XUV)and softx-ray(SXR)spectral regions(reaching several keV1,2),ex-cellent beam quality,3and ultrashort pulse duration downto the attosecond range.4High-order harmonic generation(HHG)sources are well established in many research areassuch as attosecond science5or femtosecond spectroscopy6and have become interesting for high-resolution imaging,7,8free-electron-laser seeding,9and nonlinear optics in the XUVrange.10,11Most applications of HHG sources benefit from har-monic pulses with high pulse energy.This requirement isdifficult to achieve due to the low conversion efficiency ofthe generation process.Since the discovery of the HHG pro-cess over two decades ago,12,13its conversion efficiency hasbeen progressively improved by optimizing the macroscopicphase-matching conditions and the microscopic single atomresponse.High-order harmonic generation has been carriedout in different conditions,such as high-pressure jets,14gascells,15semi-infinite media,and capillaries.16Phase-matchingoptimization using loosely focused(possibly self-guided)fundamentalfields has led to conversion efficiencies of∼10−7in neon,15∼10−5in argon,17and slightly below10−4in xenon.18,19By modifying the generationfield,e.g.,by com-bining the fundamentalfield with one or more of its harmon-ics,the microscopic single atom response has been controlledon the subcycle level leading to enhanced HHG signals and/orgeneration of even-order harmonics.20–22In this article,we describe a high-flux HHG sourceoperating in the photon energy range up to100eV.The HHG a)Electronic mail:piotr.rudawski@fysik.lth.se setup is designed to work in a loose focusing geometry(up to5m focal length)and is driven by a high energy femtosecondlaser system delivering up to100mJ per pulse.The optimiza-tion of the signal is performed using an automated scan ofthe main parameters that contribute to phase-matching(e.g.,driving pulse intensity,gas pressure,etc.).Using this tech-nique we have obtained a total energy per pulse in argon of amicrojoule and a few hundred nJ in neon,in a geometry withan f-number f#=f/D≈400and f#≈133,respectively, and a20mm long gas cell.Beam profiles were measuredusing an XUV-camera and the coherence properties wereestimated in a Young’s double-slit experiment.The article isorganized as follows.Section II presents theoretical con-siderations for HHG under loose focusing.The HHG setuptogether with the methods for characterization and opti-mization are described in Sec.III.Results obtained with thehigh-energy,ultrashort laser system at the Lund Laser Centreare presented in Sec.IV.Section V presents a summary ofthe work and a discussion about scaling to extremely longfocal lengths.II.MODEL FOR LOOSE FOCUSING HHGHigh-order harmonic generation with high conversionefficiency requires optimization of both the microscopicand macroscopic properties of the process.The microscopicresponse is well described by a semi-classical three-stepmodel.23,24In every half-cycle of the driving wave,electronscan tunnel through the distorted atomic potential barrier,be-ing then accelerated in the intense laserfield.Depending onthe release time into the continuum,the electrons may returnto the parent ion and recombine,emitting an XUV photon.The trajectories of these electrons can be divided into twogroups called short and long,depending on the excursion timein the continuum.HHG requires laser intensities in the rangeof1014W/cm2–1015W/cm2depending on the selected gas.0034-6748/2013/84(7)/073103/7©Author(s)201384,073103-1Macroscopically,the total HHG signal is a coherent sumof the photons emitted from different atoms in the medium.For a given harmonic order q,constructive addition occursalong the propagation direction over the so-called coherencelength L coh=π/ k.Here, k=qk1−k q is the wave-vector mismatch along the propagation direction between the gener-atedfield and the laser-induced polarization at frequency qω.In order to maximize the coherence length,the wave-vectormismatch must be minimized.In a non-guiding focus geom-etry this can be done through the interplay between the foursources of wave-vector mismatch,k= k g<0+ k n>0+ k p<0+ k d<0for z<0>0for z>0.(1)The negative contribution k g originates from theGaussian beam phase gradient along the propagation direc-tion(z). k n and k p describe the neutral and free-electrondispersion which have opposite sign and are proportional tothe gas pressure.To explicitly outline this linear dependence,we write k n,p=p∂( k n,p)/∂p,where the partial derivative is now pressure independent in the following. k d is thegradient of the so-called dipole phase which is proportionalto the intensity gradient and is small for the short trajectoriesbut large for the long ones.25Under our experimental conditions,the short trajectoriesdominate the HHG process.If only these trajectories are con-sidered in Eq.(1),the dipole phase contribution can be ne-glected and the wave-vector mismatch can be minimized bycanceling the plasma dispersion and Gaussian beam phasegradient with the neutral dispersion.For afixed generation ge-ometry,the degree of ionization in the medium determines thepressure,p match,for which the system is phase matched.26,27For each harmonic order,p match is defined asp match=−k g∂( k n)∂p+∂( k p)∂p.(2)For a given medium,harmonic order,and focal length,the only variable parameter is the free-electron contributionwhich is proportional to the degree of ionization(∂ k p/∂p ∝r ion),and consequently can be adjusted by changing the laser intensity.The equation requires the intensity to be lowenough so that the contribution due to neutral dispersion dom-inates over the free-electron dispersion.This defines a maxi-mum ionization degree(r maxion ),typically a few percent,abovewhich phase-matched generation is not possible.Figure1shows the variation of p match in argon as a func-tion of the degree of ionization for three harmonic orders and two different focusing geometries.p match tends towards infin-ity when r ion reaches r maxion .At low degree of ionization,thephase-matching pressure varies little both with pressure and with harmonic order.Considering that the dipole response is highest at the highest intensity,one could assume that the most efficient generation is possible at high pressures andat intensities that support an ionization degree around r maxion .High intensities,however,lead to steep gradients of r ion in the longitudinal and radial directions within the generation volume,confining phase-matched generation to a small vol-ume and leading to transient phase-matching.27In spite ofa FIG.1.Phase matching pressure in Ar as a function of ionization degree for different harmonic orders,q,and different focus geometries f#=100,blue, and f#=400,red.The central wavelength is800nm and the generation cell is placed at the focus of the fundamental beam.higher single atom response at high intensity,those effects can reduce the overall efficiency.An optimum ionization de-gree should assure phase-matched HHG over a broad band-width and a large volume.The ionization level should be such that the phase-matching pressure is approximately constant for a broad range of high-order harmonics,potentially leading to short and intense attosecond pulses.This phase-matching bandwidth increases with decreasing ionization degree yet at the same time the single atom response as well as the con-version efficiency decrease.As a rule of thumb,the optimumvalue for the ionization degree can be taken as∼r maxion/2for the highest harmonic in the considered HHG bandwidth.Un-der the conditions of Figure1,this corresponds to∼2%ion-ization and a laser intensity of∼1.1×10¹⁴W/cm2.When the coherence length,L coh,is maximized,the har-monic emission is limited by re-absorption in the generation gas.The absorption length,L abs,is defined byL abs(p)=kTpσion,(3)where k is the Boltzmann constant,T the temperature, andσion the ionization cross-section.Following the ar-gumentation of Constant et al.,28the harmonic yield is then maximized when the medium length,L med,is at least three times the absorption length.This allows to define an optimum medium length under phase-matched conditions,L optmed=3L abs(p match).For example for the21st harmonic in Ar,and f#=400,T=300K,σion=2×10⁻²¹m2,p match ≈5mbar,and consequently L opt med should be chosen to be at least12mm.For high-energy laser systems,an increase of the absorption-limited HHG intensity can be achieved by scal-ing up the f#,i.e.,by increasing the focal length for a certain initial beam diameter.The conversion efficiency can be held constant when changing the focal length if the laser pulse en-ergy,the gas pressure,and the medium length are scaled ing Gaussian optics and Eqs.(2)and(3),we derive the following scaling relations:E f(laser energy)∝f2 in order to keep the same intensity at focus,p match∝1/f2since k g∝1/f2,and L med∝f2.This ensures constant conversionFIG.2.Scaling of the phase matching pressure and the required laser pulse energy with focal length(or f#)for different ionization levels in argon.The corresponding minimum laser pulse energy required is shown in red.For the simulations,the following parameters were used:beam diameter before fo-cusing:D=10mm,gas cell position:at the focus,central wavelength of 800nm,harmonic order q=21.The required pulse energy was calculated assuming a peak intensity of1.5×1014W/cm2and a pulse length of45fs. efficiency,independent of the focusing geometry,27and the harmonic energy E h∝f2.Figure2illustrates these scaling relations in the case of argon,with the following parameters:800nm wavelength,a 45fs pulse duration,an intensity of1.5×1014W/cm2at fo-cus,and an initial beam diameter of10mm.A laser pulse energy of10mJ requires a focal length of approximately5m and a generation pressure of a few mbar to efficiently generate harmonics.III.HIGH-ORDER HARMONIC EXPERIMENTAL SETUP Our HHG setup consists of three sections:generation,di-agnostics,and application(see Figure3).The sections are connected by vacuum tubes with a diameterφ=40mm. The generation section is mounted on stiffly connected op-tical tables.The diagnostics section together with the applica-tion chamber are mounted on a rail system.This allows us to adjust the distance between the vacuum chambers depending on the focusing geometry in order to avoid damage of optical elements placed after the generation by the fundamental laser field.It also provides vibration isolation and high stability.High-order harmonics are generated by loosely focusing a high energy laser beam into a noble gas.The fundamen-tal laser beam is apertured down by a variable diameter iris (I),typically between9and30mm and focused by a lens (L).Control of the beam size allows for re-adjustments of the focusing geometry(f#)as well as laser energy and in-tensity distribution at focus.Thus it allows us to optimize phase-matching in a simple way.Directly after the focusing optics,the beam enters the generation chamber.The entrance UV fused silica window is mounted at a small angle to avoid back propagation of the reflected light to the laser system. The beam propagates inside a100mm diameter vacuum tube and is folded by mirrors(M)mounted on small breadboards placed in6-way crosses.Alternatively,the laser beam can be focused by a mirror at near-normal incidence placed in one of the vacuum crosses.The focused beam interacts with the noble gas confined in a cell(PGC).The cylindrical cell has a diameter of typically0.5mm and a length between3mm and20mm.The gas is released at the repetition rate of the laser by a valve29driven by a piezo-electric actuator and syn-chronized with the laser pulse.The opening and closing times are optimized for maximum harmonic signal.Simulating the gas distribution in the cell,we found a small pressure gradient from the middle of the cell,where the gas is injected,towards the ends of the cell,where the pressure abruptly drops.The cell is mounted on an XY motorized stage.Additionally,two motorized actuators control the tilt of the cell with respect to the incoming beam.In order to optimize the position of the cell relative to the laser focus the gas cell is additionally placed on a6cm long-range translation stage moving along the propagation direction(Z).The generation chamber is designed to work simultane-ously with up to two gas cells.The cells can be mounted in parallel or in series.The parallel configuration allows for the generation of two independent harmonic beams30 while the serial configuration can be used for the enhancement of the HHG process using low-order harmonics generated in thefirst cell.22In both configurations,the generated harmonic beam propagates collinearly with the fundamental radiation in vacuum(10−6mbar)to the diagnostics chamber.Elimination FIG.3.HHG setup in the4m focusing configuration;L-focusing lens,I-iris,M-folding mirrors,PGC-pulsed gas cell,F-aluminumfilters,RM-rotating mirror,XS-XUV spectrometer,VS-VUV spectrometer,and XCCD-XUV CCD camera.FIG.4.High-order harmonic spectra in argon(a)and neon(b)gas.The pulse energy per individual harmonics,shown as dots,was obtained by combining total energy measurements with the spectral response from the XUV spectrometer.of the fundamental is achieved by using200nm thick alu-minumfilters(F).Thefilters are mounted on a manual trans-lation stage placed at the entrance of the diagnostics chamber, and controlled from the outside of the vacuum chamber.The alignment of the setup is based on the beam position at the entrance iris and a reference point inside the diagnostics chamber.The precise alignment of the gas cell with respect to the laser beam is done by motorized control of the cell’s four axes(XY and two tilts).The reference point and gas cell are monitored by cameras equipped with variable focal length objectives.At the center of the diagnostics chamber,a gold-coated flat mirror(RM)mounted on a rotation stage is used to send the XUV beam to the different instruments or,when the mir-ror is removed,towards the application chamber(Fig.3). The HHG spectra are measured by aflat-field grating spec-trometer(XS,Jobin-Yvon PGM-PGS200).The spectrome-ter detects spectrally-resolved far-field spatial profiles of in-dividual high-order harmonics in the XUV spectral range. Low-order harmonics are detected using a vacuum ultravio-let monochromator(VS,McPherson234/302).The vacuum ultraviolet spectrometer is equipped with an MCP detector coated with CsI allowing HHG diagnostics in a range from50 to250nm.Additionally,spatial profiles and energy measure-ments are carried out using a back-illuminated XUV-CCD (Andor iKon-L)camera(XCCD).To attenuate the HHG beam for these measurements we use one or two200nm thick alu-minumfilters.IV.RESULTSThis section presents measurements of high-order har-monics generated in argon and neon.The driving laser sys-tem is a high-power Ti:Sapphire chirped-pulse-amplification-based laser system delivering45fs pulses with up to100mJ energy at10Hz repetition rate.Before compression,the laser beam is spatiallyfiltered with a conical pinhole mounted in a vacuum chamber.The pinhole waist,approximately500μm, is placed in a focal plane of a1.7m focal length lens.The laser beam diameter is30mm at the entrance to the har-monic setup.The laser beam position and angle are actively stabilized.Figure4presents typical integrated harmonic spectra for (a)argon and(b)neon,recorded by the XUV spectrometer. The driving laser beam,with20mJ energy in case of argon and24mJ in case of neon,was focused by a4m lens in a 20mm long cell.The HHG cut-off energy is45eV(29th harmonic)in argon whereas in neon it reaches91.5eV (59th harmonic).Under these conditions the total measured harmonic energy per laser shot is1.15μJ for argon and 0.23μJ for neon.These values correspond to conversion ef-ficiencies of5×10−5for argon and8×10−6for neon.Due to the high sensitivity of the XUV camera to the infrared radi-ation,the harmonic beam energy is measured within the alu-minumfilter’s transmission window,i.e.,between14eV and 71eV,corresponding to harmonic orders between11and45. The measurement procedure,similar to the one described by Erny et al.,31is based on XUV-CCD recorded background-subtracted images.The images are integrated to obtain the total number of counts.The total number of photons is es-timated based on a calibration curve from the manufacturer. The individual harmonic energy is obtained by multiplying the total HHG beam energy with the relative intensity of each harmonic measured by the spectrometer.The spectrum is cor-rected for the folding mirror reflection(based on data from Henke et al.32),the grating efficiency,and the measured alu-minumfilter transmission.The estimated pulse energy per harmonic is shown as dots in Figure4.The most promi-nent harmonic,both in argon and neon is the21st harmonic (32.5eV).Its energy is250nJ in argon and30nJ in neon. These values are comparable to previous results obtained by Takahashi et al.15,17Tofind the optimum high-order harmonic energies an au-tomated optimization procedure was carried out.This proce-dure is briefly summarized here.The important parameters to control are:fundamental beam energy and diameter(before focusing),gas pressure,and gas cell position relative to the laser focus.The energy of the fundamental beam is varied by an attenuator consisting of a half-wave plate mounted on a motorized rotation stage and a polarizer.We use a motorizedFIG.5.Intensity of the 21st harmonic generated in argon as a function of driving laser energy and generation gas pressure.The measurements were carried out for a gas cell placed at the laser focus for three iris sizes:(a)φ=22mm,(b)φ=24mm,and (c)φ=32mm.The values of a harmonic intensity between the measured points,shown as black dots,were interpolated.variable iris to change the diameter of the fundamental beam before focusing.The distance between the center of the cell and the fundamental beam waist is varied by moving the cell.Finally,the gas pressure in the cell is adjusted by controlling a voltage applied to the cell nozzle’s piezoelectric disks.We record a set of harmonic spectra while varying these four pa-rameters in an automated way.Either the total HHG energy or the energy of a single harmonic can be optimized.Our op-timization procedure allows us to routinely obtain HHG ener-gies at the level of several hundred nJ in argon and a few tens of nJ in neon.An example of the automated optimization is presented in Figure 5,where we investigated the dependence of the in-tensity of the 21st harmonic generated in argon as a func-tion of the laser energy and gas pressure for three iris diam-eters.The signal is normalized to the maximum obtained for 21st harmonic.The recorded data show that for increasing iris size (decreasing f #),the required laser energy decreases and the phase matching pressure increases in agreement with our model prediction (see Fig.1).Similar optimization in neon shows,as expected,a higher p match .The optimum iris diam-eter corresponds to the longest Rayleigh range (the highest f #)for which the phase-matching conditions can be achieved,while keeping a high enough intensity at focus.It assures the highest HHG beam energy as is shown in Sec.II .Figure 6(a)shows the spatial profile of high-order har-monics generated in argon and transmitted through an alu-minum filter.The corresponding orders are between 11and 45.The back-panel shows that the intensity distribution is al-most perfectly Gaussian.Similar high quality Gaussian beams were generated in neon.The high spatial quality of the gen-erated beams is due partly to the spatial quality of the driving beam,and partly to optimized phase-matching along the prop-agation axis.In our conditions,IR and XUV beams distortion due to nonlinear and plasma effects are negligible.The generated beams divergence carries information about the contribution from the electronic trajectories.The divergence of the “short trajectory”harmonic beam is usu-ally much smaller than for the “long trajectory”harmonics.For the 21st harmonic generated in argon,the divergence of the beam resulting from the long trajectory is 14times higher than that from the short trajectory.36The different divergence is a consequence of a larger accumulated phase on the long trajectories.The analysis of the harmonic beam divergence shows that the main contribution to HHG in our conditions comes from the short trajectories.The contribution from the long trajectories is visible on the analyzed CCD images as a weak background.30To estimate the spatial coherence of the HH beam,we performed a double-slit experiment.The degree of coherence of the HHG beam can be estimated from the fringe contrast in the diffraction pattern.33,34The slits used in this experiment had a width of 40μm,a slit separation of 400μm,and were located 1.5m from the source.Figure 6(b)shows a cross-section of the double-slit diffraction pattern obtained with a single shot exposure.The experimental data were fittedwithFIG.6.(a)Spatial profile of the harmonic beam generated in Ar by focusing fundamental radiation with 2m focal length lens into a 10mm long cell,recorded with an x-ray CCD camera.The back-panel shows the cross-section of the beam (gray,dotted line),and a fitted intensity distribution (blue,dashed line),(b)Diffraction pattern created in a double-slit experiment,experimental data (blue,solid line),and fitted intensity distribution (red,dashed line).a theoretical intensity function formed by the sum of diffrac-tion patterns of the different harmonic wavelengths within thetransmission window of thefilter.The bestfit was found witha degree of coherence of0.8,in good agreement with previousmeasurements.35V.SUMMARY AND OUTLOOKWe have developed a high-energy HHG setup,working ina loose focusing geometry,generating a total energy per laserpulse of a microjoule in argon and a few hundred nJ in neon.The source is designed for future studies of nonlinear pro-cesses in the XUV spectral range.The high harmonic pulseenergies together with their high spatial coherence allow usto reach high peak intensities.For example,an intensity of2×1014W/cm2per harmonic pulse could be reached by fo-cusing the HHG beam generated in argon using a broadbandgrazing-incident mirror,assuming a3μm focal spot size,20fs duration,and30%transmission after reflection andfilteringby an Alfilter.Our theoretical analysis of phase-matching in theabsorption-limited case provides a simple guide for scalingHHG properties to high laser energies.For example we esti-mate that with E f=1J,f=50m,p=0.01mbar,and L med =6m,harmonic pulses with energy as high as70μJ could be reached.Further increase in energy could be achieved by mod-ifying the single atom response,e.g.,using a double-cellscheme.22Our current beam line includes the option to drivethe HHG process with two cells or to use an interferometricsetup in order to combine the fundamental with itself,its sec-ond or third harmonic(ω/ω,ω/2ω,andω/3ω),thus providinga large range of options for modifying the drivingfield.Our experimental results combined with the above con-siderations show that HHG has the potential to provide in-tense ultrashort pulses reaching the intensity levels requiredfor nonlinear experiments in the XUV spectral range. ACKNOWLEDGMENTSThis research was supported by the Marie Curie programATTOFEL(ITN),the European Research Council(ALMA),the Joint Research Programme ALADIN of Laserlab-EuropeII,the Swedish Research Council,the Swedish Foundationfor Strategic Research,and the Knut and Alice WallenbergFoundation.1C.Spielmann,N.H.Burnett,S.Sartania,R.Koppitsch,M.Schnürer,C. Kan,M.Lenzner,P.Wobrauschek,and F.Krausz,“Generation of coherent x-rays in the water window using5-femtosecond laser pulses”Science278, 661(1997).2T.Popmintchev,M.-C.Chen,D.Popmintchev,P.Arpin,S.Brown,S.Al-isauskas,G.Andriukaitis,T.Balciunas,O.D.Mücke,A.Pugzlys,A.Bal-tuska,B.Shim,S.E.Schrauth,A.Gaeta,C.Hernández-García,L.Plaja, A.Becker,A.Jaron-Becker,M.M.Murnane,and H.C.Kapteyn,“Bright coherent ultrahigh harmonics in the keV x-ray regime from mid-infrared femtosecond lasers,”Science336,1287–1291(2012).3Y.Tamaki,J.Itatani,M.Obara,and K.Midorikawa,“Highly coherent soft x-ray generation by macroscopic phase matching of high-order harmon-ics,”Jpn.J.Appl.Phys.40,L1154–L1156(2001).4E.Goulielmakis,M.Schultze,M.Hofstetter,V.S.Yakovlev,J.Gagnon,M. Uiberacker,A.L.Aquila,E.M.Gullikson,D.T.Attwood,R.Kienberger,F.Krausz,and U.Kleineberg,“Single-cycle nonlinear optics,”Science320, 1614(2008).5F.Krausz and M.Ivanov,“Attosecond physics,”Rev.Mod.Phys.81,163–234(2009).6S.L.Sorensen,O.Bjorneholm,I.Hjelte,T.Kihlgren,G.Ohrwall,S. Sundin,S.Svensson,S.Buil,D.Descamps,and A.L’Huillier,“Femtosec-ond pump-probe photoelectron spectroscopy of predissociative states in acetylen,”J.Chem.Phys.112,8038(2000).7R.L.Sandberg,C.Song,P.W.Wachulak,D.A.Raymondson,A.Paul,B. Amirbekian,E.Lee,A.E.Sakdinawat,-O-V orakiat,M.C.Marconi, C.S.Menoni,M.M.Murnane,J.J.Rocca,H.C.Kapteyn,and J.Miao,“High numerical aperture tabletop soft x-ray diffraction microscopy with 70-nm resolution,”Proc.Natl.Acad.Sci.U.S.A.105,24–27(2008).8J.Schwenke,E.Lorek,R.Rakowski,X.He,A.Kvennefors,A.Mikkelsen, P.Rudawski,C.M.Heyl,I.Maximov,S.-G.Pettersson,A.Persson,and A. L’Huillier,“Digital in-line holography on amplitude and phase objects pre-pared with electron beam lithography,”J.Microsc.247,196–201(2012). mbert,T.Hara,D.Garzella,T.Tanikawa,bat,B.Carre,H. Kitamura,T.Shintake,M.Bougeard,S.Inoue,Y.Tanaka,P.Salieres,H. Merdji,O.Chubar,O.Gobert,K.Tahara,and M.-E.Couprie,“Injection of harmonics generated in gas in a free-electron laser providing intense and coherent extreme-ultraviolet light,”Nat.Phys.4,296–300(2008).10E.P.Benis,D.Charalambidis,T.N.Kitsopoulos,G.D.Tsakiris,and P. Tzallas,“Two-photon double ionization of rare gases by a superposition of harmonics,”Phys.Rev.A74,051402(R)(2006).11K.Ishikawa and K.Midorikawa,“Two-photon ionization of He+as a non-linear optical effect in the soft-x-ray region,”Phys.Rev.A65,043405 (2002).12M.Ferray,A.L’Huillier,X.F.Li,G.Mainfray,and C.Manus,“Multiple-harmonic conversion of1064nm radiation in rare gases,”J.Phys.B21, L31(1988).13A.McPherson,G.Gibson,H.Jara,U.Johann,T.S.Luk,I.A.McIn-tyre,K.Boyer,and C.K.Rhodes,“Studies of multiphoton production of vacuum-ultraviolet radiation in the rare gases,”J.Opt.Soc.Am.B4,595 (1987).14T.Brabec and F.Krausz,“Intense few-cycle laserfields:Frontiers of non-linear optics,”Rev.Mod.Phys.72,545(2000).15E.J.Takahashi,Y.Nabekawa,and K.Midorikawa,“Low-divergence co-herent soft x-ray source at13nm by high-order harmonics,”Appl.Phys. Lett.84,4–6(2004).16T.Popmintchev,M.C.Chen,P.Arpin,M.M.Murnane,and H.C.Kapteyn,“The attosecond nonlinear optics of bright coherent x-ray generation,”Nat. Photonics4,822–832(2010).17E.Takahashi,Y.Nabekawa,T.Otsuka,M.Obara,and K.Midorikawa,“Generation of highly coherent submicrojoule soft x rays by high-order harmonics,”Phys.Rev.A66,021802(R)(2002).18E.Takahashi,Y.Nabekawa,and K.Midorikawa,“Generation of10-μJ co-herent extreme-ultraviolet light by use of high-order harmonics,”Opt.Lett. 27,1920(2002).19J.-F.Hergott,M.Kovacev,H.Merdji,C.Hubert,Y.Mairesse,E.Jean, P.Breger,P.Agostini,B.Carré,and P.Salières,“Extreme-ultraviolet high-order harmonic pulses in the microjoule range,”Phys.Rev.A66, 021801(R)(2002).20J.Mauritsson,P.Johnsson,E.Gustafsson,A.L’Huillier,K.J.Schafer,and M.B.Gaarde,“Attosecond pulse trains generated using two color laser fields,”Phys.Rev.Lett.97,013001(2006).21D.Shafir,H.Soifer,B.D.Bruner,M.Dagan,Y.Mairesse,S.Patchkovskii, M.Yu.Ivanov,O.Smirnova,and N.Dudovich,“Resolving the time when an electron exits a tunneling barrier,”Nature(London)485,343–346 (2012).22F.Brizuela, C.M.Heyl,P.Rudawski, D.Kroon,L.Rading,J.M. Dahlström,J.Mauritsson,P.Johnsson,C.L.Arnold,and A.L’Huillier,“Efficient high-order harmonic generation boosted by below-threshold har-monics,”Sci.Rep.3,1410(2013).23P.B.Corkum,“Plasma perspective on strong-field multiphoton ionization,”Phys.Rev.Lett.71,1994(1993).24K.J.Schafer,B.Yang,L.F.DiMauro,and K.C.Kulander,“Above thresh-old ionization beyond the high harmonic cutoff,”Phys.Rev.Lett.70,1599 (1993).25P.Salières,A.L’Huillier,and M.Lewenstein,“Coherence control of high-order harmonics,”Phys.Rev.Lett.74,3776(1995).26S.Kazamias,D.Douillet,F.Weihe,C.Valentin,A.Rousse,S.Sebban,G. Grillon,F.Augé,D.Hulin,and P.Balcou,“Global optimization of high harmonic generation,”Phys.Rev.Lett.90,193901(2003).。
相关法
Efficient subpixel image registration by cross-correlation.Registers two images (2-D rigid translation) within a fraction of a pixel specified by the user. Instead of computing a zero-padded FFT (fast Fourier transform), this code uses selective upsampling by amatrix-multiply DFT (discrete FT) to dramatically reduce computation time and memory without sacrificing accuracy. With this procedure all the image points are used to compute the upsampled cross-correlation in a very small neighborhood around its peak. This algorithm is referred to as the single-step DFT algorithm in [1].[1] Manuel Guizar-Sicairos, Samuel T. Thurman, and James R. Fienup, "Efficient subpixel image registration algorithms," Opt. Lett. 33, 156-158 (2008).ContentsSyntaxThe code receives the FFT of the reference and the shifted images, and an (integer) upsampling factor. The code expects FFTs with DC in (1,1) so do not use fftshift.output = dftregistration(fft2(f),fft2(g),usfac);The images are registered to within 1/usfac of a pixel.output(1) is the normalized root-mean-squared error (NRMSE) [1] between f and g.output(2) is the global phase difference between the two images (should be zero if images are real-valued and non-negative).output(3) and output(4) are the row and column shifts between f and g respectively.[output Greg] = dftregistration(fft2(f),fft2(g),usfac);Greg is an optional output, it returns the Fourier transform of the registered version of g, where the global phase difference [output(2)] is also compensated.Obtain a reference and shifted imagesTo illustrate the use of the algorithm, lets obtain a reference and a shifted image. First we read the reference image f(x,y)f = im2double(imread('cameraman.tif'));Define g(x,y) as a version of f(x,y) shifted by fractional values of a pixel and multiplied by a global phase.deltar = 3.48574;deltac = 8.73837;phase = 2;[nr,nc]=size(f);Nr = ifftshift([-fix(nr/2):ceil(nr/2)-1]);Nc = ifftshift([-fix(nc/2):ceil(nc/2)-1]);[Nc,Nr] = meshgrid(Nc,Nr);g =ifft2(fft2(f).*exp(i*2*pi*(deltar*Nr/nr+deltac*Nc/nc))).*exp(-i*phase );figure(1);subplot(1,2,1);imshow(abs(f));title('Reference image, f(x,y)')subplot(1,2,2);imshow(abs(g));title('Shifted image, g(x,y)')We have shifted the image by 8.73837 and 3.48574 pixels in the x and y direction, respectively, and added a phase of 2 radians to g(x,y). The shift was implemented by applying a linear phase on its FT, thus we have assumed that the images wrap around (features leaving one side of the window reappear on the opposite side) and that the image is band-limited (interpolated by a sinc function). Cross-correlation image registration by DFTs (both the matrix-multiply DFT and the zero-padded FFT) share these assumptions.This registration technique is well suited to compare images that are captured in Fourier domain (i.e. to evaluate an image reconstruction by holography or phase retrieval) which are strictly band-limited and exhibit the wrap-around effect.Even though the registration code assumes band-limited images that wrap around, we have obtained very good results when applying it toband-limited microscope images, and aliased imagery. That is when shifting the image brings in new content instead of wrapping it around or when the images are not band-limited.Sample Image Registrationdftregistration.m receives the FT of f and g and the upsampling factor. The code expects DC of the FTs at (1,1) so don't use fftshift.We now use the image registration code to register f and g within 0.01 pixels by specifying an upsampling parameter of 100[output Greg] = dftregistration(fft2(f),fft2(g),100);display(output),output =0.0008 2.0000 3.4900 8.7400The pixel shift error (difference between the true and obtained shifts) is0.0016 and 0.0043 in the x and y directions respectively. Well within the expected accuracy of 0.01. Notice that using the conventional zero-padded FFT approach with the same accuracy, would require computation of a 25,600x25,600 FFT, which would require more than 19 Gbytes of RAM and a very comfortable chair.The following plot shows the reference image and the registered image.figure(1);subplot(1,2,1);imshow(abs(f));title('Reference image, f(x,y)')subplot(1,2,2);imshow(abs(ifft2(Greg)));title('Registered image, gr(x,y)')DisclaimerI have made every effort to evaluate the proper working of this code under many different conditions. However, it is the responsibility of the user to ensure that this registration code is adequate for their application.Feel free to e-mail me with questions or comments.。
ARRI ALEXA Mini LF 摄影机说明书
Identity Number K1.0024074Model ALEXA Mini LFSensor Type Large Format ARRI ALEV III (A2X) CMOS sensor with Bayer pattern colorfilter arraySensor Maximum Resolution and Size4448 x 309636.70 x 25.54 mm / 1.444 x 1.005"⌀ 44.71 mm / 1.760"Sensor Frame Rates0.75 - 90 fpsWeight∼2.6 kg / ∼5.7 lbs(camera body with LPL lens mount)800 g (MVF-2)Photosite Pitch8.25 μmSensor Active Image Area Photosites LF Open Gate ProRes 4.5K: 4448 x 3096LF Open Gate ARRIRAW 4.5K: 4448 x 3096LF 16:9 ProRes HD: 3840 x 2160LF 16:9 ProRes 2K: 3840 x 2160LF 16:9 ProRes UHD: 3840 x 2160LF 16:9 ARRIRAW UHD: 3840 x 2160LF 2.39:1 ProRes 4.5K: 4448 x 1856LF 2.39:1 ARRIRAW 4.5K: 4448 x 1856Sensor Active Image Area Dimensions LF Open Gate ProRes 4.5K: 36.70 x 25.54 mm / 1.445 x 1.006"LF Open Gate ARRIRAW 4.5K: 36.70 x 25.54 mm / 1.445 x 1.006"LF 16:9 ProRes HD: 31.68 x 17.82 mm / 1.247 x 0.702"LF 16:9 ProRes 2K: 31.68 x 17.82 mm / 1.247 x 0.702"LF 16:9 ProRes UHD: 31.68 x 17.82 mm / 1.247 x 0.702"LF 16:9 ARRIRAW UHD: 31.68 x 17.82 mm / 1.247 x 0.702"LF 2.39:1 ProRes 4.5K: 36.70 x 15.31 mm / 1.445 x 0.603"LF 2.39:1 ARRIRAW 4.5K: 36.70 x 15.31 mm / 1.445 x 0.603" Recording File Container Size LF Open Gate ProRes 4.5K: 4480 x 3096LF Open Gate ARRIRAW 4.5K: 4448 x 3096LF 16:9 ProRes HD: 1920 x 1080LF 16:9 ProRes 2K: 2048 x 1152LF 16:9 ProRes UHD: 3840 x 2160LF 16:9 ARRIRAW UHD: 3840 x 2160LF 2.39:1 ProRes 4.5K: 4480 x 1856LF 2.39:1 ARRIRAW 4.5K: 4448 x 1856Recording File Image Content LF Open Gate ProRes 4.5K: 4448 x 3096LF Open Gate ARRIRAW 4.5K: 4448 x 3096LF 16:9 ProRes HD: 1920 x 1080LF 16:9 ProRes 2K: 2048 x 1152LF 16:9 ProRes UHD: 3840 x 2160LF 16:9 ARRIRAW UHD: 3840 x 2160LF 2.39:1 ProRes 4.5K: 4448 x 1856LF 2.39:1 ARRIRAW 4.5K: 4448 x 1856Exposure Latitude14+ stops over the entire sensitivity range from EI 160 to EI 3200 asmeasured with the ARRI Dynamic Range Test Chart (DRTC-1) Exposure Index Adjustable from EI 160-3200 in 1/3 stopsEI 800 base sensitivityShutter Electronic shutter, 5.0°- 356° or 1s - 1/8000sRecording Formats MXF/ARRIRAWMXF/Apple ProRes 4444 XQMXF/Apple ProRes 4444MXF/Apple ProRes 422 HQRecording Media Codex Compact DrivesRecording Frame Rates LF Open Gate ProRes 4.5K: 0.75 - 40 fpsLF Open Gate ARRIRAW 4.5K: 0.75 - 40 fpsLF 16:9 ProRes HD: 0.75 - 90 fpsLF 16:9 ProRes 2K: 0.75 - 90 fpsLF 16:9 ProRes UHD: 0.75 - 60 fpsLF 16:9 ARRIRAW UHD: 0.75 - 60 fpsLF 2.39:1 ProRes 4.5K: 0.75 - 60 fpsLF 2.39:1 ARRIRAW 4.5K: 0.75 - 60 fpsNote: maximum fps values are preliminary informationRecording Modes Standard real-time recordingNo Pre-recordingNo IntervalometerViewfinder Type Multi Viewfinder MVF-2 with 4" flip-out monitorViewfinder Technology OLED viewfinder displayLCD fold out monitorViewfinder Resolution Pixel1920 x 1080Viewfinder Diopter Adjustable from -5 to +5 dioptersColor Output Rec 709Rec 2020Log CCustom Look (ARRI Look File ALF-2)Look Control Import of custom 3D LUTASC CDL parameters (slope, offset, power, saturation)White Balance Manual and auto white balance, adjustable from 2000K to 11000K in 10KstepsColor correction adjustable range from -16 to +16 CC1 CC corresponds to 035 Kodak CC values or 1/8 Rosco valuesFilters Built-in motorized ND filters 0.6, 1.2, 1.8Fixed optical low pass, UV, IR filterImage Outputs 1x proprietary signal output for MVF-2 viewfinder on VF CoaXPressconnector (video, audio, power, control signals)SDI 1:-HD only, Processed or Clean, with or without a look file applied-1.5G 422 HD (SMPTE ST292-1, up to 30 fps, progessive (p) or progressivesegmented frame (psf))-3G 422 HD (SMPTE ST425-1, up to 60 fps, p)-3G 444 HD (SMPTE ST425-3, up to 30 fps, p)SDI 2:-HD or UHD, Clean only, with or without a look file applied, or SDI 1 clone-1.5G 422 HD (SMPTE ST292-1, up to 30 fps, p or psf)-3G 422 HD (SMPTE ST425-1, up to 60 fps, p)-3G 444 HD (SMPTE ST425-3, up to 30 fps, p)-6G 422 UHD (SMPTE ST2081-10, up to 30 fps, p)“Clean” is an image without surround view or overlays (status, false color,zebra, framelines, etc.)“Processed” is an image with surround view or overlays.Lens Squeeze Factors 1.001.251.301.501.651.802.00Exposure and Focus Tools False ColorZebraZoomAperture and Color PeakingAudio Input1x LEMO 6pin balanced stereo line in with 12V power output(Line input max. level +24dBu correlating to 0dBFS)Audio Output SDI (embedded)3,5mm stereo headphone jack (on MVF-2)Audio Recording 2 channel linear PCM, 24 bit 48 kHzRemote Control Options MVF-2 viewfinder can act as wired remote control with 10m/33ft cableWeb-based remote control from smart phones, tablets and laptops viaWiFi & Ethernet (beta version)Camera Access Protocol (CAP) via Ethernet & WiFiGPIO interface for integration with custom control interfacesWCU-4 hand-unit with control over lens motors and operationalparameters via built-in white radioSXU-1 hand-unit with control over one lens channelOCU-1 and Master Grip control of lens and user buttonsInterfaces1x LEMO 5pin LTC Timecode In/Out1x LEMO 10pin Ethernet for remote control and service1x BNC SYNC IN1x LEMO 7pin EXT multi purpose accessory interface w. RS pin and 24Vpower output1x LEMO 4pin LBUS (on lens mount) for lens motors, daisy chainable1x USB 2.0 in media bay (for user setups, look files etc)Wireless Interfaces Built-in WiFi module (IEEE 802.11b/g)Built-in White Radio for ARRI lens and camera remote controlLens Mounts LPL lens mount with LBUS connectorPL-to-LPL adapterLeitz M mount (available from Leitz)Flange Focal Depth LPL mount: 44 mmwith PL-to-LPL adapter: 52 mmPower Input1x LEMO 8pin (11-34 V DC)Power Consumption Around 65 W when recording ARRIRAW at 24 fps with MVF-2 attached(preliminary information)Power Outputs 1x Fischer 3pin 24V RS1x LEMO 2pin 12V1x LEMO 7pin EXT 24V power outputPower Management-Measurements HxWxL140 x 143 x 188 mm / 5.5 x 5.6 x 7.4"(camera body with LPL lens mount)Operating Temperature-20° C to +45° C / -4° F to +113° F @ 95% relative humidity max, noncondensing, splash and dust proof through sealed electronics Storage Temperature-30° C to +70° C / -22° F to +158° FSound Level< 20 dB(A) at 24fpsSoftware Licenses-。
纹理物体缺陷的视觉检测算法研究--优秀毕业论文
摘 要
在竞争激烈的工业自动化生产过程中,机器视觉对产品质量的把关起着举足 轻重的作用,机器视觉在缺陷检测技术方面的应用也逐渐普遍起来。与常规的检 测技术相比,自动化的视觉检测系统更加经济、快捷、高效与 安全。纹理物体在 工业生产中广泛存在,像用于半导体装配和封装底板和发光二极管,现代 化电子 系统中的印制电路板,以及纺织行业中的布匹和织物等都可认为是含有纹理特征 的物体。本论文主要致力于纹理物体的缺陷检测技术研究,为纹理物体的自动化 检测提供高效而可靠的检测算法。 纹理是描述图像内容的重要特征,纹理分析也已经被成功的应用与纹理分割 和纹理分类当中。本研究提出了一种基于纹理分析技术和参考比较方式的缺陷检 测算法。这种算法能容忍物体变形引起的图像配准误差,对纹理的影响也具有鲁 棒性。本算法旨在为检测出的缺陷区域提供丰富而重要的物理意义,如缺陷区域 的大小、形状、亮度对比度及空间分布等。同时,在参考图像可行的情况下,本 算法可用于同质纹理物体和非同质纹理物体的检测,对非纹理物体 的检测也可取 得不错的效果。 在整个检测过程中,我们采用了可调控金字塔的纹理分析和重构技术。与传 统的小波纹理分析技术不同,我们在小波域中加入处理物体变形和纹理影响的容 忍度控制算法,来实现容忍物体变形和对纹理影响鲁棒的目的。最后可调控金字 塔的重构保证了缺陷区域物理意义恢复的准确性。实验阶段,我们检测了一系列 具有实际应用价值的图像。实验结果表明 本文提出的纹理物体缺陷检测算法具有 高效性和易于实现性。 关键字: 缺陷检测;纹理;物体变形;可调控金字塔;重构
Keywords: defect detection, texture, object distortion, steerable pyramid, reconstruction
II
- 1、下载文档前请自行甄别文档内容的完整性,平台不提供额外的编辑、内容补充、找答案等附加服务。
- 2、"仅部分预览"的文档,不可在线预览部分如存在完整性等问题,可反馈申请退款(可完整预览的文档不适用该条件!)。
- 3、如文档侵犯您的权益,请联系客服反馈,我们会尽快为您处理(人工客服工作时间:9:00-18:30)。
a r X i v :a s t r o -p h /0010101v 1 4 O c t 2000D RAFTVERSIONF EBRUARY 1,2008Preprint typeset using L A T E X style emulateapj v.04/03/99SUB-MM IMAGING OF A PROTO-CLUSTER REGION AT z =3.09S.C.C HAPMAN ,1G.F.L EWIS ,2D.S COTT ,3E.R ICHARDS ,4C.B ORYS ,3C.C.S TEIDEL ,5K.L.A DELBERGER ,5A.E.S HAPLEY 51Observatoriesof the Carnegie Institution of Washington,Pasadena,Ca 91101,U.S.A.2Anglo-Australian Observatory,P.O.Box 296,Epping,NSW 1710,Australia3Department of Physics &Astronomy,University of British Columbia,Vancouver,B.C.V6T 1Z1,Canada4Department of Physics &Astronomy,Arizona State University,P.O.Box 8701504,Tempe,Az 85287-1504,U.S.A.5Palomar Observatory,Caltech 105-24,Pasadena,Ca 91125,U.S.A.Draft version February 1,2008ABSTRACTWe have used the Submillimetre Common-User Bolometer Array (SCUBA)detector on the James Clerk Maxwell Telescope (JCMT)to measure bright sub-mm emission associated with a recently discovered exten-sive (>100h −1kpc)and highly luminous,‘blob’of Ly αemission at z =3.09.The blob lies within a known large overdensity of optical sources in the z =3.07–3.11range,and is centered on a locally overdense peak within this region.The best explanation for the copious sub-mm emission is a dust obscured continuum source,which may produce the ionizing flux for the Ly αcloud.Cooling gas explanations are plausible but excessively compli-cated,and the 450/850µm ratio rules out a significant fraction of the signal arising from the Sunyaev-Zel’dovich increment.At least two additional ≃10mJy sub-mm detections in the SCUBA map,with a surface density sig-nificantly higher than in blank field surveys,suggests that they may be associated with the z =3.09structure.A SCUBA ‘photometry’observation of a second nearby Ly αblob tentatively detects a weaker sub-mm counterpart.Subject headings:galaxies:clusters:general –galaxies:evolution –galaxies:formation –submillimeter:galaxies –radio continuum:galaxies1.INTRODUCTIONDeep sub-mm surveys with SCUBA have detected distant lu-minous galaxies which emit most of their energy at far infrared wavelengths (e.g.,Smail et al.1997;Barger et al.1998,Hughes et al.1998,Eales et al.1998).Although some of these sources have been identified with very faint and sometimes very red op-tical counterparts (Smail et al.1999)their poorly constrained redshift distribution (Barger et al.1999,Smail et al.2000)has made their interpretation unclear.Bright distant SCUBA sources appear similar to local ultra-luminous infra-red galax-ies (e.g.Sanders 2000),but represent a more significant fraction of the global star formation at high redshift.How these differ at high z ,and how they are related to optically selected galaxies remains to be understood.We might expect such luminous sub-mm sources to be espe-cially prevalent in regions that will one day become rich clusters of galaxies.For instance,if early type galaxies (which are dom-inant only in rich cluster environments)form by major merger events,then during the epoch of their formation they might pro-duce a large fraction of the bright sub-mm sources in the Uni-verse.There might therefore be a strong clustering signal from sub-mm sources at high redshift (e.g.Ivison et al.2000).Even if the sub-mm sources are primarily AGN-driven,we might ex-pect them to be strongly clustered,given the bulge to black hole mass correlations (cf.,Gebhardt et al.2000).Since it is not yet possible to measure the clustering prop-erties of sub-mm sources,the next best approach is to examine regions that are already known to be overdense from other tech-niques.The most likely time in a cluster’s history for a bright sub-mm phase is when smaller groups are collapsing,prior to virialization of the whole proto-cluster environment,when compact groups of objects with relatively low velocity disper-sion present high probabilities for merger events.Therefore,galaxy concentrations within known large-scale overdensitiesare good places to search for significant sub-mm emission.Extensive spectroscopic surveys have recently shown strong clustering among the star forming Lyman break galaxy (LBG)population at z ∼3(e.g.,Adelberger et al.1998).In one strik-ing example,a high-contrast redshift overdensity of LBGs at z =3.09in the SSA22survey field was discovered (Steidel et al.1998),with deep,narrow band Ly αimaging used to identify at least 160likely members of this structure (Stei-del et al.2000).Most dramatic in this z =3.09spike was the discovery of two extensive (>100h −1kpc),highly luminous (L Ly α∼1037W)‘blobs’of Ly αemission.The ‘blobs’resem-ble the giant Ly αnebulae associated with high redshift radio galaxies (cf.van Ojik et al.1996),but have <1%of the as-sociated radio continuum flux and no obvious source of UV photons bright enough to excite the nebular emission.Fabian et al.(1986)suggested that such extended emission line nebu-lae might be the signature of ‘maximal cooling flows’in proto-cluster and proto-galaxy environments –these ‘blobs’resemble just such objects.The SSA229×9arcmin field at z =3.07–3.11is a factor of 6overdense in LBGs relative to the general field,and about twice as overdense again within the local density peak centered on ‘blob 1’.At present,the SSA22structure is by far the best studied candidate for a clustered region at z >1.The space den-sity of the LBG redshift ‘spikes’is similar to that of rich x-ray clusters at low redshift,supporting the plausible identification of the LBG overdensities as proto-cluster sites.We have obtained SCUBA 850µm and 450µm maps of the Ly αblob lying at an overdensity peak within the already over-dense field,revealing an extremely luminous sub-mm counter-part.In this letter,we describe the available multi-wavelength data for the blob regions and explore the relevant excitation mechanisms.12Sub-mm imaging of a proto-cluster region at z=3.092.OBSERV ATIONS AND REDUCTIONThefield centered on the Lyα‘blob1’(RA2000=22h17m 26s,δ2000=+00◦12′40′′)was observed with the SCUBA in-strument(Holland et al.1999)on the JCMT.During an ob-serving run in May2000,we obtained450and850µm im-ages simultaneously in‘jiggle’mode,with half-power beam widths of7.5and14.7arcsec respectively.The effective inte-gration time(total time spent on the map,on and off source) was8.2ks,reaching a1σsensitivity of3.3mJy and24mJy at850µm and450µm respectively.We used45arcsec chop throws atfixed RA and declination with position angles of0, 90and135degrees from north,to avoid consistently chop-ping any structures onto each other.For the central source,the 850µmflux density was measured byfitting a single beam tem-plate(derived from observing Mars)to the source in each scan and combining the results with inverse variance weighting.The fluxes are consistent with each other in each of the individual scans.Since no other sources are detected in the individual scans,we simply stacked and combined the scans and similarly fit beam templates to all sources representing peaks>2.8σin thefinal map.In addition,a‘photometry’observation in three-bolometer chopping mode(see Chapman et al.2000a,Scott et al.2000)was performed on the Lyα‘blob2’for an effective on-source observing time of2.8ks,reaching an RMS of1.2mJy at 850µm.Pointing was checked hourly on blazars and a sky-dip was performed to measure the atmospheric opacity.The pointing variations were around2arcsec,while the average atmospheric zenith opacities at450µm and850µm were1.39and0.22.The data were reduced using the Starlink package SURF(Jenness et al.1998).Spikes werefirst carefully rejected from the data, followed by correction for atmospheric opacity and sky subtrac-tion using the median of the outer ring array elements.We then weighted each pixel by its timestream inverse variance,relative to the central pixel.The multiple scans taken at dithered po-sitions,together with sky rotation throughout the observations, ensure that each point of the map is covered by several bolome-ters.The data werefinally calibrated against the compact H II region16293−2422,observed during the same nights. Archive VLA data were retrieved for thisfield,with RMS sensitivities of60µJy at1.4GHz and40µJy at8.5GHz.The beam is comparable to the SCUBA beam at850µm,but since thefield was observed as a low declination snapshot,the beam is elongated to approximately14×20arcsec.The visible images on which our present analysis is based were obtained using the Palomar200inch telescope with the COSMIC camera.Spectroscopy and near-IR imaging were ob-tained with the Keck10m telescope and the LRIS and NIRC instruments respectively,and are described elsewhere(Steidel et al.2000).3.ANALYSIS AND RESULTS3.1.The blob sourcesWe have detected an unresolved sub-mm counterpart to the ‘blob1’(SMMJ221726+0013)with an850µmflux density of 20mJy.At z=3.09this corresponds to a luminosityνLν=3.4×10¹¹h−2L⊙for anΩ=1cosmology,giving a bolometric lumi-nosity of>1013L⊙for any reasonable temperature and emis-sivity index.There is also a∼3σdetection at the central po-sition in the450µm map(76mJy),which also does not appear to be extended.A SCUBA photometry observation of the other Lyαblob(‘blob2’)gives a2.8σdetection of a much weaker sub-mm counterpart,S850=3.3mJy.The850µm and450µm images of the‘blob1’are presented in Fig.1,convolved with a14′′Gaussian,while thefluxes at various wavelengths for the two blob sources and surrounding sub-mm sources are listed in Table1.Other known z∼3objects from Steidel et al.(2000) are denoted with crosses on the850µm map,while a Lyαnar-rowband image with K-band contours and SCUBA error circles overlaid is presented in Fig.2for both blobs.The extremely lu-minous sub-mm source appears coincident with the central Lyαknot(‘blob1’).Although this Lyαpeak remains undetected in the broadband optical to R>26,it has a K-band counterpart with an associated R−K>5.The sub-mm centroid lies only2 arcsec from this Lyαpeak,entirely consistent with the JCMT pointing errors.No radio counterpart was detected at the sensi-tivity limits of the VLA images consistent with a high-z emit-ting source.For‘blob2’,the SCUBA photometry observation was tar-geted on the Lyαcenter,near a weak K-band source,where we identify a possible∼3mJy detection.However,without higher resolution it is difficult to know which source within the∼15′′beam is giving rise to the sub-mm emission.In particular an LBG,M14,lies at the edge of the SCUBA beam,∼6′′northeast of the‘blob2’center.If M14was generating the sub-mmflux, then the beam efficiency correction would imply an850µmflux of∼5mJy,similar to the very red LBG(R−K=4.6)detected by SCUBA(Westphal-MMD11–Chapman et al.2000a).How-ever,M14is a very faint LBG(R=25.5)and is not especially red(R−K=3),and is thus not expected to be a strong sub-mm emitter.Moreover the relatively faint sub-mm emission makes it unlikely that a radio counterpart could be detectable for a z∼3in the archive VLA maps.3.2.The other sub-mm sourcesAs well as the central‘blob1’detection,there are perhaps as many as three additional source detections(∼>3σ∼10mJy) in the850µm map.Our best attempt to describe the extended region to the west is as three separate sources in a blend(source 3in the Table).However,low signal-to-noise and resolution means that this is little more than a guess.The850µm blend region may be extended at450µm,but is detected only in the northern part.Two possible sources to the NW(4th and5th in the table)appear unresolved,but are near the edge where the noise is worse and poorly defined,although source6appears coincident with a450µm source.Radio observations provide rough constraints on the red-shifts of sub-mm sources(Carilli&Yun1999,2000;Barger et al.2000).Our sub-mm detected galaxies in SSA22have in-ferred bolometric luminosities several times that of Arp220, with expected1.4GHz radiofluxes∼85µJy(Helou et al.1985) and thus lie below the detection threshold of current VLA observations.Applying the Carilli&Yun(2000)relation to provide redshift constraints from the850µm detections and 1.4GHz upper limits shows that all these sources have predicted redshifts z∼>2.0.The ratio S450/S850can also loosely constrain the source red-shifts(cf.Hughes et al.1998).While the central blob source, and source4are consistent with z∼3,the sources3and5in the Table with450µm detections haveflux ratios suggesting lower redshifts.For the western blend region,confusion makes it hard to draw any inferences.Theflux ratio for the northern source (850µm source5)suggests a redshift less than2.However,the source is near the edge,identification of the450µm peak with the850µm source is far from certain,and the lack of an obviousChapman et al.3radio counterpart suggests z>2.Turning now to optical identifications,wefind no known z∼3optical/near-IR candidates within the error circles of these additional sub-mm source detections.The sub-mm sources may be extremely faint(R>26,K>22),similar to the radio selected sub-mm bright populations studied by Barger et al.(2000)and Chapman et al.(2000b).However,not all sub-mm sources are associated with such optically faint counterparts(e.g.the LBG W-MMD11,Chapman et al.2000a).In addition,only about half of the blue,UV bright z∼3.0galaxies are included in LBG catalogs(largely due to photometric errors and blending with foreground objects),thus it is possible that a sub-mm source could be associated with a UV bright z∼3.0galaxy even if it has no counterpart in our LBG list.The relatively low detec-tion significance of these surrounding sub-mm sources,and the absence of any obvious counterparts at other wavelengths,sug-gest that we exercise caution in over-interpreting these objects. Nevertheless,the number density of∼10mJy SCUBA sources is about an order of magnitude higher than in SCUBA blank fields(cf.Blain et al.1999;Barger et al.2000;Chapman et al.2000c);at least some of these sources are likely to be asso-ciated with the z=3.09structure.4.DISCUSSION AND CONCLUSIONSThe central‘blob1’SCUBA source is among the most lumi-nous high-z sub-mm sources known.It is especially interesting that this object was discovered through the presence of tremen-dous amounts of Lyαemission,usually thought of as easily de-stroyed by the presence of dust.This begs the question:would other bright sub-mm sources(if their redshifts were known)ex-hibit similar Lyα‘halos’?One luminous sub-mm selected source,SMMJ02399-0136, is known to be associated with an extended(>8′′)Lyαregion (Ivison et al.1998),although the actual extent has not yet been constrained through a narrow-band image.Both star forming and AGN components have been identified,although the pri-mary power source for the sub-mm emission has not been con-strained.A few high-z radio galaxies with giant Lyαhalos have also been detected in the sub-mm,including4C41.17(Cham-bers et al.1990)which has a possible‘cluster’of sub-mm sources associated(Ivison et al.2000).However,in the case of this SSA22blob,the Lyαhalo is hard to explain through ex-citation of the ambient medium by a radio jet,since there is no known radio counterpart here.Archibald et al.(2000)have ob-served a sample of high redshift radio galaxies using SCUBA, detecting several with known Lyαhalos.The sub-mm emission from the‘blob1’object is more luminous than any radio galaxy in this survey of47sources over1<z<4.Indeed,the lack of significant radio emission from our blob1SCUBA object sug-gests that the Lyαhalos surrounding distant radio galaxies may not be entirely related to the radio sources.The questions of the ionizing source for the Lyαblobs and the nature of the sub-mm emission remain.The blobs are prob-ably excited by either photoionization from a central source, or as a result of virialization in a deep potential.The sub-mm emission could be either a UV-luminous star forming galaxy or an obscured AGN.More extended sub-mm emission such as from a coolingflow or even from the Sunyaev-Zel’dovich effect are also possible.The lack of a UV source in the optical images, coupled with the large dust mass implied by the sub-mm detec-tions,make direct photoionization of the Lyαfrom such a cen-tral AGN or starburst difficult to imagine.However,it is con-ceivable that complicated geometrical and radiative transfer ef-fects could conspire to allow substantial Lyαfluxes at the same time that the continuum sources are heavily obscured by dust along our line of sight(e.g.Neufeld1991).The fact that the second Lyαblob is not a strong sub-mm source suggests that an obscured continuum source need not be the primary driver for the Lyαemission.For a pure star-burst galaxy,the star formation rate extrap-olated from the sub-mm would be in excess of500h−2M⊙yr−1 for‘blob1’.By analogy with the giant Lyαhalos around high-z radio galaxies,there is reason to suspect a luminous AGN at the heart of the Lyαblob.Although the redshift of the Lyα‘blob1’(z=3.09)is relatively high for radio detection,the farIR/radio correlation for radio quiet sources(Helou et al.1995)suggests a1.4GHzflux density of∼170µJy if it is a steep spectrum ob-ject(Carilli&Yun1999),and possibly a comparable8.5GHz flux if it had theflatter spectrum characteristic of an AGN.Our Bayesian95%upper limits of142µJy(1.4GHz)and95µJy (8.5GHz)lie well within the uncertainties of the Carilli&Yun (2000)relation,and deeper observations will be required to fur-ther constrain the properties of the system.The ratio S450/S850 for the central source is3.8±1.2,which is consistent with a starburst or radio quiet AGN lying at z≃3(cf.Hughes et al.1998).Another possibility is that the850µmflux could be partly Sunyaev-Zel’dovich increment,although the detection of 450µmflux argues against this being a significant component. On theoretical grounds,the surface brightness of the increment for rich local clusters would be expected to be around1mJy per SCUBA beam,and all other things being equal,S-Z sur-face brightness is independent of redshift.The S-Z signal is ap-proximately∝M×ρ:the background density is proportional to(1+z)3,and so the core of a cluster virializing at high redshift would be much denser.However,the characteristic non-linear mass in anΩM=1universe goes like(1+z)−6/(3+n),where n is the power-spectrum slope.For CDM models n is-1to-2 on the relevant scales.Hence,though the estimate is depen-dent on cosmology,the simple M×ρargument suggests that the S-Z contribution is not likely to explain all our signal.The expected decrement at8.4GHz would be≃100µJy,and hence at the limit of being detectable currently.If the blobs are associated with cooling-flow-like phenom-ena(e.g.Hu1992),then some of the sub-mm emission could come from dust associated with distributed star-formation in the coolingflow.Edge et al.(1999)and Chapman et al.(2000c) have searched for such emission in well-known rich clusters with null results.However,local coolingflow clusters are not necessarily a proper benchmark,given that the associated gas densities could conceivably be much higher at z∼3.Fardal et al.(2000)and Haiman et al.(2000)have recently modelled the cooling radiation from forming galaxies and concluded that sub-virial temperatures for the gas could lead to much lower x-ray luminosities than one would expect from extrapolating lo-cal coolingflows.While it is not inconceivable that some of the flux has this source,even optimistic estimates for the strength of the signal,as discussed in the above papers,come out at a few mJy.Future observations will continue to elucidate the nature of the‘blobs’.For optically thin sub-mm emission,we can esti-mate the expected x-ray signal of the‘blob1’sub-mm object using different analogs for the central source at z=3.09,and representative sub-mm/x-ray indices(cf.Fabian et al.2000). Even the most heavily obscured(Compton-thick)AGN,analo-gous to NGC6240,should be detectable with Chandra or New-4Sub-mm imaging of a proto-cluster region at z =3.09ton with soft and hard x-ray fluxes of order ≃10−18Wm −2,while an Arp220analog would be even fainter.Deeper radio maps or higher frequency interferometer maps would be able to distin-guish any SZ component,as well as confirm the other sub-mm sources and their positions.The extreme sub-mm luminosity from the central Ly αhalo in ‘blob 1’(and weaker emission detected from ‘blob 2’)is an intriguing phenomenon,given the fragility of the Ly αline in the presense of dust.This combination of deep,large-area Ly αsurveys and sub-mm images may be interesting to explore fur-ther as a way of unearthing information about clusters in their early stages of formation.We thank the staff of the JCMT for their assistance with the SCUBA observations.The James Clerk Maxwell Tele-scope is operated by The Joint Astronomy Centre on behalf of the Particle Physics and Astronomy Research Council of the United Kingdom,the Netherlands Organization for Scientific Research,and the National Research Council of Canada.REFERENCESAdelberger K.,Steidel C.C.,Giavalisco M.,Dickinson M.,Pettini M.,et al.1998,ApJ,505,18Archibald E.N.,Dunlop J.S.,Hughes D.H.,Rawlings S.,Eales S.A.,et al.2000,MNRAS,in press [astro-ph/0002083]Barger A.J.,Cowie L.L.,Sanders D.B.,Fulton E.,Taniguchi Y .,et al.1998,Nature,394,293Barger A.J.,Cowie L.L.,Smail I.,et al.1999,AJ,117,2656Barger A.J.,Cowie L.L.Richards E.A.2000,AJ,119,2092Blain A.,Kneib J.-P.,Ivison R.J.,Smail I.1999,ApJ,512,L87Carilli C.L.,Yun,S.M.1999,ApJ,513,L13Carilli C.L.,Yun,S.M.2000,ApJ,530,618Chapman S.C.,Scott D.,Steidel C.C.,Borys C.,Halpern M.,et al.2000a,MNRAS,in press [astro-ph/9909092]Chapman S.C.,Richards E.,Lewis G.F.,2000b,Nature,submittedChapman S.C.,Scott D.,Borys C.,Fahlman G.G.2000c,MNRAS,submitted [astro-ph/0009067]Eales S.,Lilly S.,Gear W.,Dunne L.,Bond J.R.,et al.1999,ApJ,515,518Fabian A.C.,Arnaud K.A.,Nulsen P.E.J.,Mushotzky R.F.1986,ApJ,305,9Fabian A.C.,Smail I.,Iwasawa K.,Allen S.W.,Blain A.W.,et al.2000,MNRAS,315,L8Fardal M.,Katz N.,Gardner J.P.,Hernquist L.,Weinberg D.H.,et al.2000,ApJ,in press [astro-ph/0007205]Gebhardt K.,Bender R.,Bower G.,Dressler A.,Faber S.M.,et al.2000,ApJ,in press [astro-ph/0006289]Haiman Z.,Spaans M.,Quataert E.2000,ApJ,submitted [astro-ph/0003366]Helou G.,Soifer B.T.,Rowan-Robinson M.1985,ApJ,298,L7Holland W.S.,Robson E.I.,Gear W.K.,Cunningham C.R.,Lightfoot J.F.,et al.1999,MNRAS 303,659Hu E.M.1992,ApJ,391,608Hughes D.H.,Serjeant S.,Dunlop J.,Rowan-Robinson M.,Blain A.,et al.1998,Nature,394,241Ivison R.J.,Smail I.,Le Borgne J.-F.,Blain A.W.,Kneib J.-P.,Bezecourt,J.,et al.1998,MNRAS,298,583Ivison R.J.,Dunlop J.S.,Smail I.,Dey A.,Liu M.C.,et al.2000,AJ,in press [astro-ph/0005234]Neufeld D.A.1991,ApJ,370,L85Sanders D.B.2000,AdSpR,25,2251[astro-ph/9904292]Scott D.,Lagache G.,Borys C.,Chapman S.C.,Halpern M.,et al.2000,A&A,357,L5Smail I.,Ivison R.J.,Blain A.W.1997,ApJ,490,L5Smail I.,Ivison R.J.,Kneib J.-P.,Cowie L.L.,Blain A.W.,et al.1999,MNRAS,308,1061Smail I.,Ivison R.J.,Owen F.N.,Blain A.W.,Kneib J.-P.2000,ApJ 528,612Steidel C.C.,Adelberger K.L.,Dickinson M.,Giavalisco M.,Pettini M.,et al.1998,ApJ,492,428Steidel C.C.,Adelberger K.L.,Shapley A.E.,Pettini M.,Dickinson M.,et al.2000,ApJ,in press [astro-ph/9910144]van Ojik R.,Röttgering H.J.A.,Carilli C.L.,Miley G.K.,Bremer M.N.,1996,A&A,313,25135400 12 0000 13 0022 17 2822 17 24Blob 1, 850 micron00 12 0000 13 0022 17 2822 17 24Blob 1, 450 micronF IG .1.—The sub-mm 850µm (left)and 450µm (right)images of the extended Ly αregion.These maps have been smoothed with a 14′′Gaussian beam and have contours at 3σ,4σ,5σ,....The noisy edges have been clipped,but possible detections very close to the edge of the remaining images could still be noise artifacts.Crosses on the 850µm image denote known z ∼3sources,discovered either as LBGs or through the Ly αnarrowband imaging of Steidel et al.(2000).Chapman et al.5F IG. 2.—The lyalpha narrowband images of‘blob1’(left)and‘blob2’(right)with NIRC K−band imagery(contours)superposed(as originally presented in Steidel et al.2000).Known Lyman-break galaxies,M14and C11,are indicated.Circles have been overlaid to indicate the expected sub-mm error circle and beamsize(larger for the‘photometry’observation of‘blob2’because of the2′′dither pattern employed).T ABLE1Properties of sub-mm objects within the2Lyα‘blob’regionssource S850µm S450µm S1.4GHz S8.5GHz redshift b(mJy)(mJy)(µJy)(µJy)R EFERENCES.—.a)Sub-mmflux densities do not contain a∼10%calibration uncertainty at850µm and∼20%at450µm.The450µm measurements are made in matched15′′apertures to the850µm centroids.b)redshift lower limits estmated from the sub-mm/radio index using the Bayesan95%radio upperlimit and Carilli&Yun(2000)indicator.c)20′′diameter aperture estimate.。