
等温滴定量热法的实验操作
Video ArticleIsothermal Titration Calorimetry for Measuring Macromolecule-Ligand AffinityMichael R. Duff,1, Jordan Grubbs1, Elizabeth E. Howell11Department of Biochemistry, Cellular and Molecular Biology, University of TennesseeCorrespondence to: Elizabeth E. Howell at lzh@URL: /video/2796DOI: doi:10.3791/2796Keywords: Molecular Biology, Issue 55, Isothermal titration calorimetry, thermodynamics, binding affinity, enthalpy, entropy, free energyDate Published: 9/7/2011Citation: Duff,, M.R., Grubbs, J., Howell, E.E. Isothermal Titration Calorimetry for Measuring Macromolecule-Ligand Affinity. J. Vis. Exp. (55), e2796, doi:10.3791/2796 (2011).Isothermal titration calorimetry (ITC) is a useful tool for understanding the complete thermodynamic picture of a binding reaction. In biological sciences, macromolecular interactions are essential in understanding the machinery of the cell. Experimental conditions, such as buffer and temperature, can be tailored to the particular binding system being studied. However, careful planning is needed since certain ligand and macromolecule concentration ranges are necessary to obtain useful data. Concentrations of the macromolecule and ligand need to be accurately determined for reliable results. Care also needs to be taken when preparing the samples as impurities can significantly affect the experiment.When ITC experiments, along with controls, are performed properly, useful binding information, such as the stoichiometry, affinity and enthalpy, are obtained. By running additional experiments under different buffer or temperature conditions, more detailed information can be obtained about the system. A protocol for the basic setup of an ITC experiment is given.The video component of this article can be found at /video/2796/Isothermal titration calorimetry (ITC) is a well established technique that can determine all the thermodynamic parameters (affinity, enthalpy and stoichiometry) of a binding interaction in one experiment.1 ITC works by titrating one reactant into a second reactant under isothermal conditions.The signal measured is the heat released or absorbed upon interaction (binding) of the two reactants. A series of injections are performed and the heat signal will approach zero as the limiting reactant becomes saturated. Fitting of the isotherm gives the thermodynamic parameters.Several reviews are available that describe the instrumentation as well as the math of data collection and analysis. 2,3 While other calorimeters are available (most notably the ITC200 with small volumes), here we describe a general protocol for the VP-ITC manufactured by MicroCal (now part of GE Healthcare).1. Preparing Samples1.In order to prepare the macromolecule and ligand in buffer, some potential issues need to be addressed. Accurate fits require properconcentrations of the macromolecule, the species that typically goes in the sample cell of the ITC, and ligand, the species in the injection syringe. Because some proteins aggregate at the high concentrations needed for the species in the injection syringe, most often the protein is loaded into the sample cell. The optimal macromolecule concentration is determined from "c", the product of the predicted affinity of the system, which can be estimated using orthogonal methods prior to using ITC, and the total macromolecule concentration, where c = K a*[M].Optimal values of c range from 10-1000, 1 though it is possible to get accurate data for weak-binding systems under specific experimental conditions with c-values below the lower limit.4 Thus, the macromolecule concentration must be determined with this range of c values in mind (i.e., for a K a of 106 M-1, macromolecule concentrations of 10 to 1000 μM should be used). Prior knowledge of the binding affinity of the system can help minimize the protein used for ITC through better design of the ITC experiment. The concentration of the ligand should be large enough (7-25 fold more concentrated than the K d for the weakest ligand binding site) so that saturation occurs within the first third to half of the titration. Accurate fitting of the data also requires saturation of the signal. For systems with higher binding affinity, a lower ligand concentration should be used to avoid saturation too early in the titration, which will give inaccurate fits. Once the heat of dilution control (i.e.titration of ligand into buffer) has been subtracted from the titration, the enthalpy at saturation should approach zero.2.Because small molecule impurities can give rise to artifactual signals in the ITC measurements, it is best, if possible, that the macromoleculeand ligand be exhaustively dialyzed against buffer. Alternatively, column chromatography, desalting spin columns, or buffer exchangecentrifugal filters (for example, Centricons) can be used to change the buffer of the macromolecule. If the ligand is a small molecule, it can be prepared using the dialysis buffer after the macromolecule has been dialyzed or by dialyzing against dialysis membranes with cutoffs suitable for small molecules (i.e. 100-500 Da for a Spectra/Por Float-A-Lyzer). Differences in the buffer composition between the ligand and macromolecule solutions can lead to signal artifacts from the heat of the dilution of impurities in the samples. After preparation, check to make sure the pH of the buffer, macromolecule and ligand match (± 0.05 pH units) as artifacts in the enthalpy can arise due to buffer protonation effects.5 Make sure to prepare enough of each species. For triplicate experiments and a dilution control, the amount of material needed will depend upon the ITC used. But, for most ITC instruments that have approximate 2 ml volume sample cells, at least 6-7 ml ofmacromolecule solution will be needed, and can be conveniently prepared in 15 ml falcon tubes. For 300 μL injection syringes, 1-2 ml of solution should be adequate, and can be prepared in either falcon tubes or microcentrifuge tubes.3.Dust, and other particulates, can cause artifacts in the baseline of the ITC thermogram. It is imperative that they be removed prior to runningthe experiment. After preparation of sample stock solutions, the samples should be centrifuged in microcentrifuge tubes for five minutes at 8000 to 14,000 RPM to pellet particles in the solution. Remove the supernatant, being careful not to disturb the pellet, and place it in a new falcon/microcentrifuge tube.If reductants are needed to maintain reduced cysteines, use low concentrations and fresh stocks of β-mercaptoethanol,TCEP (tris(2-carboxyl)phosphine) or dithiothreitol to minimize any artifacts due to reductant oxidation. Also, the presence of organic solvents in thebuffer (common for some small molecule ligands that may need methanol or DMSO in order to be soluble) can cause signal artifacts. If organic solvents are needed for the ligand, then the macromolecule solution must also contain the same concentration to avoid any signal arising from the heat of dilution of the organic solvent. Slight differences in buffer composition between the ligand and macromolecule due to cosolvents, salts or pH are possible during preparation of the samples. It is best to check the dilution of the ligand into the sample buffer or the sample buffer into the macromolecule to ensure that heat signals arising from differences in the buffer content don't cause data arising solely from artifacts.4.Check the concentrations of the macromolecule and ligand carefully using techniques suitable to your system (such as absorbancemeasurements, HPLC ,colorimetric assays, BCA assays for proteins, etc) to record their exact concentrations. Differences in the actual concentration and the concentration used to fit the isotherm will cause errors in the stoichiometry, enthalpy and binding affinity determined from the experiment. It is common to degas the samples to avoid signal artifacts due to air bubbles or release of dissolved gases during the titration, particularly at higher temperatures.2. Setting up the Experiment1.Make sure the sample cell and injection syringe are cleaned according to the manufacturer's protocol prior to loading the macromolecule andligand. Rinse the sample cell two or three times with 1.8 ml of distilled water using the Hamilton syringe (use care with the Hamilton syringe as the barrel is easily broken or the needle bent). Next rinse the sample cell several times with 1.8 ml of buffer. Load the sample cell with 1.8 ml of macromolecule solution, being careful to avoid bubble formation.2.Fill the reference cell with distilled water. For most buffers, distilled water is fine to use as the reference solution. However, for buffers withparticularly high ionic strengths or osmolality, it is better to use the buffer as a reference.3.Remove air bubbles from the reference and sample cells using the Hamilton syringe. Gently move the needle of the syringe up-and-down thesides of the cell knocking any bubbles that may be at the bottom of the cell and attached to the well to the top of the cell. Remove any excess volume from the sample and reference cells.4.Attach a plastic syringe to the fill port of the injection syringe using tubing. Rinse the injection syringe with distilled water. Follow by a bufferrinse. Make sure the injection syringe is completely evacuated by drawing air through the system. Place the needle of the injection syringe into the ligand solution and draw the ligand solution into the injection syringe until the entire syringe is full. Continue drawing a little excess volume (approximately 50 μl or more) into the port and attached tubing. Immediately close the fill port of the syringe and detach the tubing and plastic syringe. Purge and refill the injection syringe two more times to remove any bubbles from the syringe. Remove the syringe from the ligand solution and wipe the side with a kimwipe to remove any drops, being careful not to touch the syringe tip to the kimwipe as this may remove volume from the syringe. Also, be careful not to knock or jar the syringe as this also can cause loss of volume from the syringe tip.Place the injection syringe into the sample cell.5.Set up the parameters for running the ITC. For binding systems with strong heat signals, a large number of low volume injections will givemore data points for fitting (e.g. 75 injections of 3 μl). For systems that have weak heat signals, a small number of large volume injections are preferable (e.g. 33 injections of 8 μl). Most commonly, fewer injections with higher injection volumes are used. It may take severaltitrations to optimize the conditions that are best for your system. It is important to note that the binding enthalpy can either be exothermic or endothermic, depending upon the system being studied. Unfortunately, some systems have low heat signals, making the heat of reaction difficult to determine. Problems with such systems can potentially be overcome by increasing the concentration of the macromolecule, changing the temperature of the experiment (depending upon the heat capacity of the binding system), and/or altering the pH or ionicstrength of the buffer.6.Also consider the time spacing between each injection. It is imperative that after each injection of ligand, the system is given time toequilibrate and the heat signal returns to baseline before the next injection occurs. For most systems, three to five minutes should beadequate. The time between injections should be increased for systems where the equilibration doesn't occur within five minutes.7.Because there will be some mixing between the macromolecule and ligand solutions in the injection syringe once it is inserted into the samplecell, the first injection will give spurious results. It is best to use small volumes (e.g. 2 μl) for the first one or two injections (so they can later be discarded) and keep the subsequent injections at the desired values.8.Choose the temperature of the experiment (with 25 °C being the most common, though temperatures between 2 and 80 °C can be used). Itis best to choose a temperature that matches other experiments (binding, kinetics, etc.) performed on the ligand-macromolecule system. The ITC can be set up to equilibrate at a temperature different from the temperature of the experiment. If the experiment is going to be performed at a temperature more than 10 °C away from room temperature, then it is best to set the equilibration temperature for the instrument within 5°C of the experimental temperature. This will decrease the time the instrument will take to reach the temperature of the experiment.The stirring speed of the syringe also needs to be considered. Stirring is necessary for adequate mixing of the ligand and macromolecule during the titration, but some proteins are destabilized by rapid stirring. For these cases, the stirring speed should be set at a relatively low rate. Once all the experimental parameters have been set up, then the experiment can be started.9.Once the experiment has finished, the ITC can be cleaned according to the manufacturer's protocol. The solution in the sample cell at the endof the experiment can be kept if additional experiments on the macromolecule-ligand complex mixture are desired.10.Repeat the titrations at least one or two more times to get reproducible data. Run a control where ligand is titrated into buffer in the samplecell to determine the heat of dilution for the ligand. For some systems where there is cooperative binding, additional information aboutthe binding process can be gained by injecting the macromolecule into the ligand. The different injection orientations can give additional information, which may be helpful for global fitting.63. Analyzing the Data1.Fitting of the data can be easily performed using macros in any data fitting program (usually supplied by the manufacturer along with theinstrument). Load the first data file. Check the raw thermogram for any signs of air bubbles or other artifacts in the signal. If there are any artifacts (such as spikes in the baseline or peaks when there was no injection at that time point), then note these data points as they should be removed. Next, load the ligand dilution control data, and subtract the ligand dilution data from the binding isotherm. At this time, remove all spurious data points, including the first one or two data points of the titration where dilution artifacts occur (refer to step 7).2.Select the data fitting model (one binding site, two/multiple binding sites, cooperative binding, etc) to be used to fit the data. The data canbe fit with initial guesses of the fitting parameters, stoichiometry (n), enthalpy (ΔH) and binding affinity (K a). If prior knowledge of the binding affinity, or other parameters, is known from orthogonal experiments, then these values can be entered. This helps avoid the fit becoming trapped in local minima during fitting. Once the data have been fit for the first titration, repeat steps 15 and 16 for the rest of the isotherms.Alternatively, the data can be fit globally using programs such as SEDPHAT.6 SEDPHAT may be particularly helpful in global fitting of binary complex datasets (i.e. molecules A+B) in combination with ternary complex datasets (molecules A+B+C). For example, in binding of moleculeC to an A-B complex, it is not always clear whether there might be any signal due to binding of C to A or of B to A (if A is not fully saturated).3.To ensure that the ITC data are not artifactual, the binding affinity and stoichiometries obtained from ITC should be compared with anorthogonal method.7,8 Additionally, the ITC enthalpy value can be compared to the enthalpy from a van't Hoff plot.9 It can also prove helpful to use different concentrations of the ligand or macromolecule as the absolute value of the heat signal should increase with increasing macromolecule concentration. Artifacts are most likely to arise if the buffers in the cell and syringe are not matched. Another possibility for artifacts arises from impure samples.4.We recommend that the user start with simple binary complex titrations for which there is previous information available on K d andstoichiometry. Then, if additional ligands bind, the user can try more complicated ternary complex titrations, varying the ligand concentrations, and perhaps switching the syringe and cell components. A comparison of enthalpies for both paths to ternary complex formation should be additive as enthalpy is a state function.10 Again, SEDPHAT6 is likely to be quite useful here.4. Representative Results:Figure 1. A representative example of a well-behaved titration for the binding of the cofactor NADPH to E. coli chromosomal dihydrofolate reductase (ecDHFR). Panel (A) shows the raw thermogram; (B), the binding isotherm from the integrated thermogram fit using the one-site model in the Origin software; and (C) the fit of the isotherm using the one binding site model from SEDPHAT along with fit residuals. From the Origin software, using the one site binding model, n = 1.09 ± 0.02, K d = 0.194 ± 0.001 μM, ΔH = -22.7 ± 0.4 kcal/mol, TΔS = -13.1 ± 0.4 kcal/mol, and ΔG = -9.16 ± 0.01 kcal/mol. Fits of the data using Sedphat afford an n of 0.94 ± 0.01, a K d of 0.195 ± 0.013 ΔM, a ΔH of -22.5 ± 0.2 kcal/mol, TΔS of -13.39 kcal / mol and ΔG of -9.15 kcal/mol.ITC has been used extensively in studying ligand macromolecule interactions,11 with studies looking at protein-ligand,12 DNA-ligand13 and RNA-macromolecule14 studies. ITC can even be run with solid materials, such as nanoparticles, that form uniform suspensions.15 Further, ternary systems, where one ligand is already bound to the macromolecule and a second ligand is titrated, can be used to determine the thermodynamics of, for example, binding of substrate to an enzyme-cofactor system.7 Studies can also be performed for molecules with very high binding affinities that would normally exceed the detection limit of the ITC by performing competition binding assays with weaker binding ligands.16 Information on weakly binding ligands can also be obtained by competition assays.17 The role of water in binding can be explored by ITC,18 along with the dependence of the enthalpy on solvent reorganization.19 Recently, the thermodynamics of conformational change of DNAK variants were measured upon binding of ADP and ATP.20 Protein-protein association can be studied by ITC, yielding information on hetero complexes21 as well as on homo-association.22 Temperature effects on the binding enthalpy will give the heat capacity of the binding event.2 The number of protons absorbed or released upon binding can also be determined from experiments performed in buffers with different enthalpies of ionization.5 If additional ITC studies are done at different pH values, then the pKa of the group involved can potentially be determined. 23To summarize, accurate measurements of the concentration of the macromolecule and ligand are imperative for a good ITC experiment. Sample concentrations also need to be within a proper range to get reliable data. Care should be taken with the buffer as small molecule impurities and pH mismatches will cause artifacts in the thermogram.No conflicts of interest declared.This work was supported by NSF grant MCB-0817827.1.Wiseman, T., Williston, S., Brandts, J.F., & Lin, L.N. Rapid measurement of binding constants and heats of binding using a new titrationcalorimeter. Anal. Biochem. 179, 131-137 (1989).2.Jelesarov, I. & Bosshard, H.R. Isothermal titration calorimetry and differential scanning calorimetry as complementary tools to investigate theenergetics of biomolecular recognition. J. Mol. Recognit. 12, 3-18 (1999).3.Velazquez-Campoy, A., Leavitt, S.A., & Freire, E. Characterization of protein-protein interactions by isothermal titration calorimetry. MethodsMol. Biol. 261, 35-54 (2004).4.Turnbull, W.B. & Daranas, A.H. On the value of c: can low affinity systems be studied by isothermal titration calorimetry? J. Am. Chem. Soc.125, 14859-14866 (2003).5.Fukada, H. & Takahashi, K. Enthalpy and heat capacity changes for the proton dissociation of various buffer components in 0.1 M potassiumchloride. Proteins. 33, 159-166 (1998).6.Houtman, J.C., et al. Studying multisite binary and ternary protein interactions by global analysis of isothermal titration calorimetry data inSEDPHAT: application to adaptor protein complexes in cell signaling. Protein Sci. 16, 30-42 (2007).7.Bradrick, T.D., Beechem, J.M., & Howell, E.E. Unusual binding stoichiometries and cooperativity are observed during binary and ternarycomplex formation in the single active pore of R67 dihydrofolate reductase, a D2 symmetric protein. Biochemistry. 35, 11414-11424 (1996).8.Shenoy, S.R., et al. Multisite and multivalent binding between cyanovirin-N and branched oligomannosides: calorimetric and NMRcharacterization. Chem. Biol. 9, 1109-1118 (2002).9.Chopra, S., Lynch, R., Kim, S.H., Jackson, M. & Howell, E.E. Effects of temperature and viscosity on R67 dihydrofolate reductase catalysis.Biochemistry. 45, 6596-6605 (2006).10.Norris, A.L. & Serpersu, E. Interactions of Coenzyme A with the Aminoglycoside Acetyltransferase (3)-IIIb and Thermodynamics of a TernarySystem. Biochemistry. 49, 4036-4042 (2010).11.Falconer, R.J., Penkova, A., Jelesarov, I., & Collins, B.M. Survey of the year 2008: applications of isothermal titration calorimetry. J. Mol.Recognit. 23, 395-413 (2010).12.Ababou, A. & Ladbury, J.E. Survey of the year 2005: literature on applications of isothermal titration calorimetry. J. Mol. Recognit. 20, 4-14(2007).13.Buurma, N.J. & Haq, I. Advances in the analysis of isothermal titration calorimetry data for ligand-DNA interactions. Methods. 42, 162-172(2007).14.Salim, N.N. & Feig, A.L. Isothermal titration calorimetry of RNA. Methods. 47, 198-205 (2009).15.De, M., You, C.C., Srivastava, S., & Rotello, V.M. Biomimetic interactions of proteins with functionalized nanoparticles: a thermodynamicstudy. J. Am. Chem. Soc. 129, 10747-10753 (2007).16.Velazquez-Campoy, A. & Freire, E. Isothermal titration calorimetry to determine association constants for high-affinity ligands. Nat. Protoc. 1,186-191 (2006).17.Velazquez Campoy, A. & Freire, E. ITC in the post-genomic era...? Priceless. Biophys. Chem. 115, 115-124 (2005).18.Harries, D., Rau, D.C., & Parsegian, V.A. Solutes probe hydration in specific association of cyclodextrin and adamantane. J. Am. Chem. Soc.127, 2184-2190 (2005).19.Chervenak, M.C. & Toone, E.J. A direct measure of the contribution of solvent reorganization to the enthalpy of binding. J. Am. Chem. Soc.116, 10533-10539 (1994).20.Taneva, S.G., Moro, F., Velazquez-Campoy, A., & Muga, A. Energetics of nucleotide-induced DnaK conformational states. Biochemistry. 49,1338-1345 (2010).21.Jelesarov, I. & Bosshard, H.R. Thermodynamics of ferredoxin binding to ferredoxin:NADP+ reductase and the role of water at the complexinterface. Biochemistry. 33, 13321-13328 (1994).22.Burrows, S.D., et al. Determination of the monomer-dimer equilibrium of interleukin-8 reveals it is a monomer at physiological concentration.Biochemistry. 33, 12741-12745 (1994).23.Baker, B.M. & Murphy, K.P. Evaluation of linked protonation effects in protein binding reactions using isothermal titration calorimetry. Biophys.J.71, 2049-2055 (1996).。
等温滴定量热法(ITC)
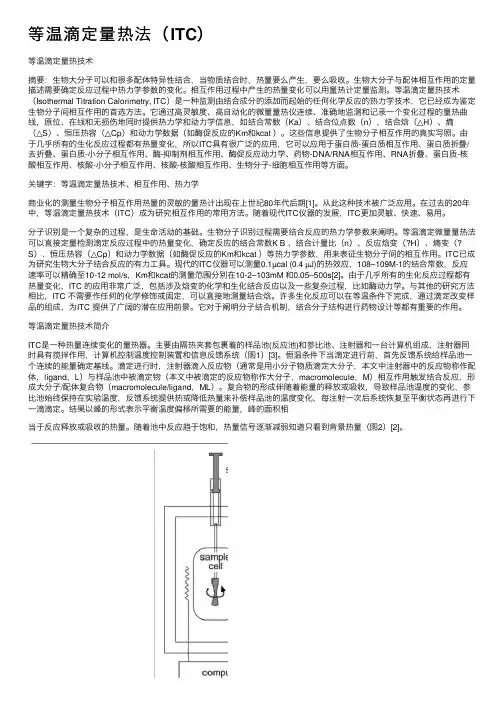
等温滴定量热法(ITC)等温滴定量热技术摘要:⽣物⼤分⼦可以和很多配体特异性结合,当物质结合时,热量要么产⽣,要么吸收。
⽣物⼤分⼦与配体相互作⽤的定量描述需要确定反应过程中热⼒学参数的变化。
相互作⽤过程中产⽣的热量变化可以⽤量热计定量监测。
等温滴定量热技术(Isothermal Titration Calorimetry, ITC)是⼀种监测由结合成分的添加⽽起始的任何化学反应的热⼒学技术,它已经成为鉴定⽣物分⼦间相互作⽤的⾸选⽅法。
它通过⾼灵敏度、⾼⾃动化的微量量热仪连续、准确地监测和记录⼀个变化过程的量热曲线,原位、在线和⽆损伤地同时提供热⼒学和动⼒学信息,如结合常数(Ka)、结合位点数(n),结合焓(△H)、熵(△S)、恒压热容(△Cp)和动⼒学数据(如酶促反应的Km和kcat )。
这些信息提供了⽣物分⼦相互作⽤的真实写照。
由于⼏乎所有的⽣化反应过程都有热量变化,所以ITC具有很⼴泛的应⽤,它可以应⽤于蛋⽩质-蛋⽩质相互作⽤、蛋⽩质折叠/去折叠、蛋⽩质-⼩分⼦相互作⽤、酶-抑制剂相互作⽤、酶促反应动⼒学、药物-DNA/RNA相互作⽤、RNA折叠、蛋⽩质-核酸相互作⽤、核酸-⼩分⼦相互作⽤、核酸-核酸相互作⽤、⽣物分⼦-细胞相互作⽤等⽅⾯。
关键字:等温滴定量热技术、相互作⽤、热⼒学商业化的测量⽣物分⼦相互作⽤热量的灵敏的量热计出现在上世纪80年代后期[1]。
从此这种技术被⼴泛应⽤。
在过去的20年中,等温滴定量热技术(ITC)成为研究相互作⽤的常⽤⽅法。
随着现代ITC仪器的发展,ITC更加灵敏、快速、易⽤。
分⼦识别是⼀个复杂的过程,是⽣命活动的基础。
⽣物分⼦识别过程需要结合反应的热⼒学参数来阐明。
等温滴定微量量热法可以直接定量检测滴定反应过程中的热量变化,确定反应的结合常数K B 、结合计量⽐(n)、反应焓变(?H)、熵变(? S)、恒压热容(△Cp)和动⼒学数据(如酶促反应的Km和kcat )等热⼒学参数,⽤来表征⽣物分⼦间的相互作⽤。
ITC等温滴定量热法的操作说明解读
Page 4
4
Page 5
5
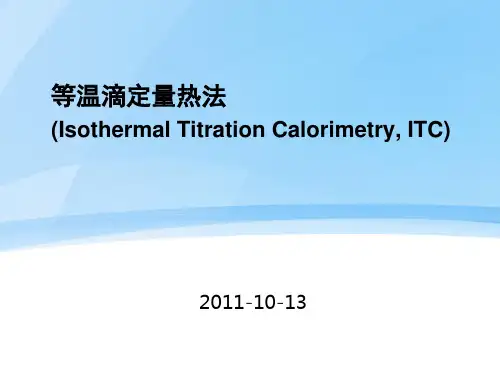
在恒温下,注射器中的“配体”溶液滴定到包含“高分子”溶液的池中。当配体 注射到池中,两种物质相互作用,释放或吸收的热量与结合量成正比。当池中的 高分子被配体饱和时,热量信号减弱,直到只观察到稀释的背景热量。
Page 2
2
独特特点:
– 它对被研究体系的溶剂性质、光谱性质和电学性质等没有任何限制条件,即 具有非特异性的独特优势,
– 样品用量小,方法灵敏度和精确度高(仪器最小可检测热功率2 nW,最小可 检测热效应0.125uJ,生物样品最小用量0.4ug,温度范围2 ℃ - 80 ℃,滴 定池体积(1.43 ml)。
等温滴定量热法
(Isothermal Titration Calorimetry, ITC)
2011-10-13
Isothermal Titration Calorimetry, ITC
等温滴定量热技术(ITC)是一种监测由结合成分的添加而起始的任何
化学反应的热力学技术,即用一种反应物滴定另一种反应物,随着加 入滴定剂的数量的变化,测量反应体系温度的变化
ITC提供了(△G)以及(△H) 和(△S),产生了结合机理的真 实图像。
Page 15
15
ITC:用生物相关模型系统架起桥梁
ITC的关键优势之一是创建生物相关实验的独特能力。再没有其他技术 能提供完全无标记且液相的分析环境,同时无需靶点高分子或配体的固 定。ITC的应用在相关模型生物系统的建立和验证中起了重要的作用。
Page 16
16
INS
9
Page 9
典型的ITC数据
等温滴定量热法
Page 9
典型的ITC数据
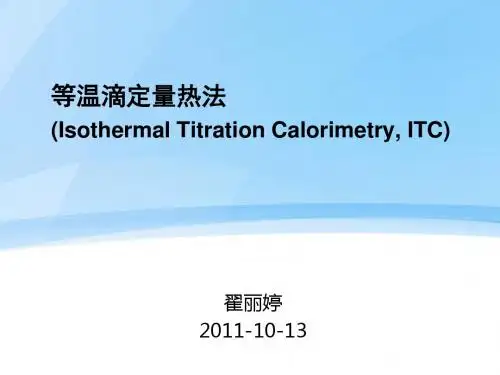
配体溶液20次注射到ITC池的 蛋白溶液中。每个注射峰(上 图)下方的区域与注射所释放 的总热量相等。当这种综合的 热量相对添加到池中的配体摩 尔比作图时,就获得了相互作 用的完整结合等温线(下图)。 用单位点模型来验证数据。化 学计量、结合常数及焓的数值 都显示在框内。
Page 8
8
滴定一般在尽可能接近绝热的条件下进行,被滴定物可以是液体或悬 浮的固体;滴定剂可以是液体或气体。温度变化是由滴定剂与被滴定 物间的化学作用或物理作用(例如一种有机分子吸附于固体表面)引 起的。 实验数据以热谱图形式表示,它提供了有关反应中物质的量(滴定终 点)和反应物质的特性(焓变)的数据。对图进行分析,可以得知反 应容器中发生的反应的类型和数目,以及溶液中存在的各物种的浓度 等信息。这部分内容称为热滴定,同时还可以确定反应的化学计量关 系,计算反应的热力学量,如平衡常数K(Δ G°)、标准状态下的焓变Δ H° 和熵变Δ S°,这部分内容称为滴定量热法。 测温滴定法以热效应为基础,与溶液的许多性质(如粘度、光学透明度、 介电常数、溶剂强度、以及离子强度等)无关,因此可以用于气相、液相、 非水溶液、有色溶液、胶体溶液和粘稠浆状等体系。
ITC提供了(△G)以及(△H) 和(△S),产生了结合机理的真 实图像。
Page 15
15
ITC:用生物相关模型系统架起桥梁
ITC的关键优势之一是创建生物相关实验的独特能力。再没有其他技术 能提供完全无标记且液相的分析环境,同时无需靶点高分子或配体的固 定。ITC的应用在相关模型生物系统的建立和验证中起了重要的作用。
它通过高灵敏度、高自动化的微量量热仪连续、准确地监测和记录一
个变化过程的量热曲线,原位、在线和无损伤地同时提供热力学和动 力学信息,它已经成为鉴定生物分子间相互作用的首选方法。
ITC等温滴定量热法的操作说明

实验总结
实验结果的讨论及其意 义
分析实验结果,讨论相互作 用的特性、结合亲和力等, 并探讨结果对相关研究领域 的意义。
需要改进的方面
总结实验中的不足和问题, 提出改善和优化实验方法的 建议。
ITC 等温滴定量热法的 重要性
介绍ITC等温滴定量热法在生 物研究中的应用和优势,强 调其对解决科学问题的重要 性。
确保样品和配体的纯度和浓度,准备适 当的缓冲液进行滴定实验。
结果分析
信息的含义
通过分析数据,可以获得化学反 应的热效应、平衡常数、热力学 参数等信息。
数据的解释
异常情况处理
根据实验条件和数据分析结果, 解释实验中观察到的现象和趋势, 揭示背后的机理。
记录并分析实验中可能出现的异 常情况,如峰形变异、噪音等, 以确定实验结果的可靠性。
实验步骤
1
实验参数调整
2
根据实验需求,调整参数如温度、浓度、 滴定量等,以优化实验结果。
3
实验过程数据处理
4
将实验中得到的热效应数据转化为相关 参数,并进行数据分析和解释。
操作流程
按照以下步骤进行实验: 1. 样品和配体的准备 2. 初始化仪器 3. 进行等温滴定实验 4. 结束实验并保存数据
样品处理和置换缓冲液
ITC等温滴定量热法的操作说明
I. 简介 A. ITC (等温滴定量热法) 是一种测量在生物分子之间发生的相互作用的热效应的技术。 B. ITC 在生物科学研究中广泛应用,例如研究蛋白质结合、药物相互作用等。 . ITC 的优势包括无需标记物质、直接可测量热效应以及定量分析结果。 II. 实验前准备 A. 准备所需的仪器和试剂,包括等温滴定量热仪、样品和配体等。 B. 检查和准备实验所需设备,如清洗实验容器、校准测温系统等。 C. 遵守实验室的安全操作规程,戴上个人防护装备。
等温滴定量热法

另一个检测对照和环境的热量差。当样品中发生化学反应的时候,释放或者吸
收热量,因此样品和对照的温度差会通过对样品进行增加或者减少热量而稳定
在一个水平,就是baseline。因此那些用来维持ΔT1=常数的热量就被系统检
Page ▪测7 画作曲线。Βιβλιοθήκη 7Page ▪ 8
8
▪ 滴定一般在尽可能接近绝热的条件下进行,被滴定物可以是液体或悬 浮的固体;滴定剂可以是液体或气体。温度变化是由滴定剂与被滴定 物间的化学作用或物理作用(例如一种有机分子吸附于固体表面)引 起的。
▪ 实验数据以热谱图形式表示,它提供了有关反应中物质的量(滴定终 点)和反应物质的特性(焓变)的数据。对图进行分析,可以得知反 应容器中发生的反应的类型和数目,以及溶液中存在的各物种的浓度 等信息。这部分内容称为热滴定,同时还可以确定反应的化学计量关 系,计算反应的热力学量,如平衡常数K(ΔG°)、标准状态下的焓变ΔH° 和熵变ΔS°,这部分内容称为滴定量热法。
Page ▪ 2
Page ▪ 3
Page ▪ 4
Page ▪ 5
Page ▪ 6
ITC系统是通过细胞反馈网络 CFB来分别测量或者补偿样品和对照由于反应所产
生或者吸收的热量。两个硬币状的东西放置在绝热的圆筒中,通过那个细细的
管子与外界联通。有两个热量检测装置。一个用来检测两个样品之间的热量差,
▪ 测温滴定法以热效应为基础,与溶液的许多性质(如粘度、光学透明度、 介电常数、溶剂强度、以及离子强度等)无关,因此可以用于气相、液相、 非水溶液、有色溶液、胶体溶液和粘稠浆状等体系。
Page ▪ 9
9
Page ▪ 10
典型的ITC数据
配体溶液20次注射到ITC池的 蛋白溶液中。每个注射峰(上 图)下方的区域与注射所释放 的总热量相等。当这种综合的 热量相对添加到池中的配体摩 尔比作图时,就获得了相互作 用的完整结合等温线(下图)。 用单位点模型来验证数据。化 学计量、结合常数及焓的数值 都显示在框内。
ITC等温滴定量热法的操作说明资料
Page 16
16
INS
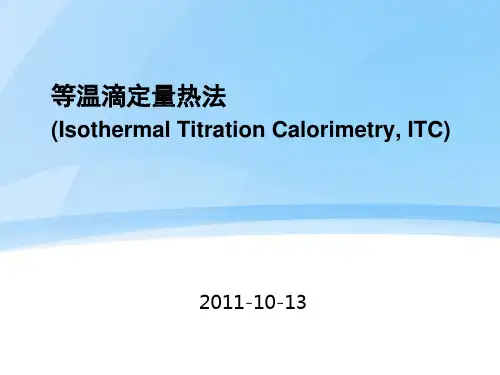
它通过高灵敏度、高自动化的微量量热仪连续、准确地监测和记录一
个变化过程的量热曲线,原位、在线和无损伤地同时提供热力学和动 力学信息,它已经成为鉴定生物分子间相互作用的首选方法。
可获得生物分子相互作用的完整热力学参数,包括结合常数(Ka)、 结合位点数(n)、摩尔结合焓(△H)、摩尔结合熵(△S)、摩尔恒 压热容(△Cp),和动力学参数(如酶促反应的Km和kcat)
Page 6
6
ITC系统是通过细胞反馈网络 CFB来分别测量或者补偿样品和对照由于反应所产 生或者吸收的热量。两个硬币状的东西放置在绝热的圆筒中,通过那个细细的 管子与外界联通。有两个热量检测装置。一个用来检测两个样品之间的热量差, 另一个检测对照和环境的热量差。当样品中发生化学反应的时候,释放或者吸 收热量,因此样品和对照的温度差会通过对样品进行增加或者减少热量而稳定 在一个水平,就是baseline。因此那些用来维持Δ T1=常数的热量就被系统检 7 Page 7 测画作曲线。
Page 3
3
Applications include:
Characterization of molecular interactions of small molecules Lead optimization. Enzyme kinetics.
Assessment of the effect of molecular structure changes on binding mechanisms.
9
Page 9
典型的ITC数据
配体溶液20次注射到ITC池的 蛋白溶液中。每个注射峰(上 图)下方的区域与注射所释放 的总热量相等。当这种综合的 热量相对添加到池中的配体摩 尔比作图时,就获得了相互作 用的完整结合等温线(下图)。 用单位点模型来验证数据。化 学计量、结合常数及焓的数值 都显示在框内。
结构化学实验-itc等温量热滴定
一、实验目的:1.了解MicroCal iTC200等温滴定量热仪在测量蛋白质相互作用中的应用2.了解仪器基本工作原理,学习蛋白质相互作用的测定步骤和仪器操作3.简要分析实验结果。
二、实验原理:在研究两种或两种以上的蛋白质的功能时,相关蛋白质之间常常存在相互作用(常常是氢键或范德华力),如果两蛋白可以彼此结合,则结合的过程中会放出一定的热量。
所以,通过测定蛋白质相互作用时放出热量的大小,可以得到蛋白相互作用时的结合常数KD、化学计量比N和焓变ΔH,从而由热力学公式ΔG = RT lnKD和ΔG = ΔH -TΔS可以进一步得到反应的自由能变化。
在恒温下,注射器中的“配体”溶液滴定到包含“高分子”溶液的池中。
当配体注射到池中,两种物质相互作用,释放或吸收的热量与结合量成正比。
当池中的高分子被配体饱和时,热量信号减弱,直到只观察到稀释的背景热量。
MicroCal iTC200等温滴定量热仪可以用来定量测定生物分子间的相互作用,例如蛋白质-蛋白质相互作用(包括抗原-抗体相互作用和分子伴侣-底物相互作用);蛋白质折叠/去折叠;蛋白质-小分子相互作用以及酶-抑制剂相互作用;酶促反应动力学;药物-DNA/RNA相互作用;RNA折叠;蛋白质-核酸相互作用;核酸-小分子相互作用;核酸-核酸相互作用;生物分子-细胞相互作用等。
从而获得亲和力以及相关热力学数据。
通过滴定操作和热量的测量,量热仪可以给出热量-摩尔比曲线:图像中曲线的突跃中点对应的化学计量比就是两种蛋白质相互作用的化学计量数N,突跃中点处曲线的斜率就是两种蛋白相互作用的结合常数KD。
决定曲线形状的主要参数是C值:C = 滴定池中的蛋白浓度/ KD = [M]t/ KD × NC值越大,曲线越陡;C值越小,曲线越平缓,没有明显的突跃。
一般C值在10-100之间实验效果最好。
配体溶液多次次注射到ITC池的蛋白溶液中。
每个注射峰下方的区域的面积与注射所释放的总热量相等。
ITC等温滴定量热法的操作说明
ITC等温滴定量热法的操作说明ITC等温滴定量热法的操作说明1:概述ITC(Isothermal Titration Calorimetry)等温滴定量热法是一种常用于测量化学反应热效应和热力学参数的实验技术。
本文档将详细介绍ITC等温滴定量热法的操作步骤,以及常见问题的解决方案。
2:实验前准备2.1 仪器准备- 确保ITC仪器处于良好的工作状态,并进行必要的校准和检修。
- 检查仪器和相关设备的供电和冷却系统,确保正常运行。
- 准备实验所需的试剂和溶液,确保其纯度和浓度符合要求。
2.2 样品准备- 准备待测样品,确保样品的纯度和浓度符合实验要求。
- 储存样品时,注意避免暴露在空气中,以免影响实验结果。
- 如有需要,进行样品的预处理或稀释,以适应实验要求。
3:实验操作3.1 基本操作步骤- 打开ITC仪器,并进行必要的初始化设置。
- 准备试样,通常包括两种液体:溶剂和待测样品。
- 启动实验程序,并按照程序指导添加试样。
- 进行实验过程中,根据实验需要,调整实验参数,如温度、压力、浓度等。
- 当实验结束后,关闭仪器,保存实验数据。
3.2 添加试样的注意事项- 添加试样时,应尽量避免形成气泡,以免影响测量结果。
- 在添加试样前,应将样品和溶剂在相同工作温度下达到热平衡。
- 添加样品时,应使用精确的加样装置,控制加样速度和时间。
4:数据分析4.1 数据处理与解读- 对实验数据进行处理和分析,包括热流曲线的积分和差分操作等。
- 利用数据做曲线拟合,计算反应热和其他热力学参数。
- 根据数据分析结果,解释实验现象和反应机制。
4.2 出现问题的解决方案- 如实验数据异常或与理论不符,可检查实验操作是否正确,并逐步排除可能的问题。
- 如仪器出现故障或异常,应及时联系厂家进行维修或咨询专业人员的意见。
5:附件本文档附带以下附件:- ITX仪器操作手册6:法律名词及注释本文档中涉及的法律名词及其注释如下:- 1:涉及附件: 本文档所附带的相关文件或资料。
等温滴定量热法
等温滴定量热法(I T C)的简易操作流程:①样品的准备,包括滴定物与被滴定物(如DNA滴定蛋白质)。
a.实验前的蛋白质样品需用缓冲溶液透析(注意透析袋的正确使用),透析时间一般为24小时,buffer体积为1L,且中途注意更换buffer,其目的是为了减少由于溶液组成不同而产生的滴定误差;b.样品的浓度要求,一般要求的浓度为微摩尔级,且滴定物(DNA)的浓度是被滴定物(蛋白质)的十倍左右为宜,且实验前需要再次确认所配样品的浓度是否符合要求;c.在进行滴定实验前,用于空白对照的缓冲液,蛋白样品以及DNA均需抽真空除气泡(15Mins左右为宜)。
②仪器的清洗。
a.在进行真空除气泡前,除气泡用容器均需用超纯水清洗三次左右,且清洗完毕后擦干内壁,防止由于残留缓冲液的稀释而导致样品浓度的改变;b.样品池(sample cell)的清洗,用超纯水清洗15次左右(每次2ml左右),清洗完毕后,一定要将残留的超纯水吸干净;c.注射器(syringe)的清洗,用超纯水清洗3次以上(专用注射器清洗,此时无需点击open,close和purge选项),清洗完毕后将注射器的头部擦干,之后清洗装DNA 的小试管,步骤同注射器的清洗。
③设置空白对照试验(DNA滴定缓冲液),将缓冲液置于小试管中(为了防止空气的进入,一般添加样品的量大于其实际所需的量),打开控制界面,点击open之后,用手动注射器缓慢拉动活塞,此时注射器管中的液面上升,然后点击close, 注射器会自动将小试管中的缓冲液吸入注射器中,当缓冲液完全吸入注射器之后点击pump键,除去气泡;在清洗样品池的同时就设置所需的实验温度(套管温度,一般较反应温度稍低),并输入样品的实际浓度以及实验数据文件名和储存路径等一系列参数(如注射时间,注射次数,注射间隔时间)。
④设置滴定实验,步骤同空白试验,只需将样品池中用于空白对照的缓冲液换成蛋白样品同时修改文件名(先准备样品池中的样品,后准备注射器中的样品)。
兰州等温滴定量热
兰州等温滴定量热
摘要:
1.兰州等温滴定量热法的背景和原理
2.兰州等温滴定量热法的实验装置和步骤
3.兰州等温滴定量热法的应用领域和优势
4.兰州等温滴定量热法的发展前景和挑战
正文:
兰州等温滴定量热法是一种在等温条件下,通过滴定热量来测定物质热性质的实验方法。
该方法基于热力学原理,利用热电偶等温度传感器和精密热力学测量仪器,在特定的温度和压力下,通过滴定热量,来测量物质的比热容、热导率、相变潜热等热物性参数。
兰州等温滴定量热法的实验装置主要包括温度控制系统、滴定系统、数据采集和处理系统等部分。
实验步骤主要包括:样品准备、温度设定、滴定过程、数据采集和处理等。
首先,需要将待测物质溶解在特定溶剂中,然后将溶液注入滴定系统。
通过精密热力学测量仪器,实时监测溶液温度变化,根据热力学原理计算出物质的比热容、热导率、相变潜热等热物性参数。
兰州等温滴定量热法广泛应用于化学、石油、材料、环境等领域,为科学研究和工程设计提供了重要的热物性数据。
该方法具有高精度、高灵敏度、快速响应等优势,对于研究物质的热性质和热行为具有重要意义。
然而,兰州等温滴定量热法在实际应用中还存在一些挑战,如测量误差、设备稳定性、样品制备复杂等问题。
为了进一步提高测量精度和效率,未来需
要在实验装置的改进、数据处理方法的优化、样品制备技术等方面进行深入研究。
总之,兰州等温滴定量热法作为一种重要的热物性测量方法,在我国相关领域的科学研究和工程应用中发挥了重要作用。