安德森-商务与经济统计习题答案(第8版,中文版)
商务与经济统计作业(仅供参考)
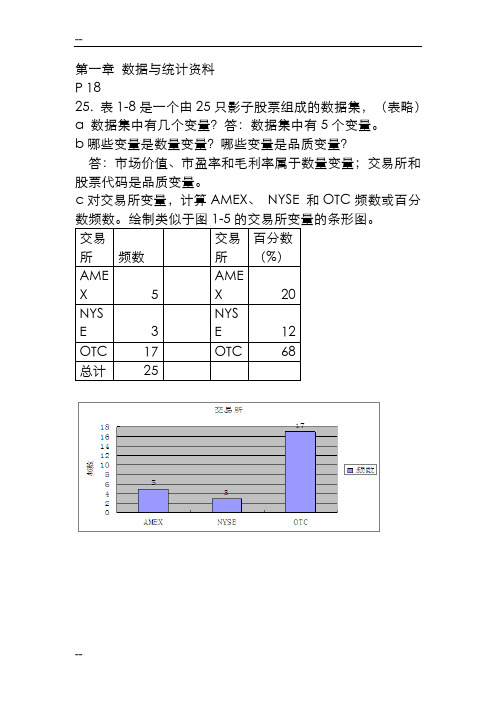
第一章数据与统计资料P 1825. 表1-8是一个由25只影子股票组成的数据集,(表略)a 数据集中有几个变量?答:数据集中有5个变量。
b哪些变量是数量变量?哪些变量是品质变量?答:市场价值、市盈率和毛利率属于数量变量;交易所和股票代码是品质变量。
c对交易所变量,计算AMEX、NYSE 和OTC频数或百分数频数。
绘制类似于图1-5的交易所变量的条形图。
e 平均市盈率是多少?答:利用EXCEL的求平均值功能得出平均市盈率是20.2第二章表格法和图形法P 235按字母顺序,美国最常见的6个姓氏为:布朗、戴维斯、约翰逊、琼斯、史密斯和威廉姆斯。
假设根据一个由50个人组成的样本,得到如下的姓氏数据(图略)a相对频数分布和百分数频数分布。
mstotal 50 b构建条形图c 构建饼形图d根据这些数据,最常见的3个姓氏是哪些?答:最常见的3个姓氏分别是史密斯、约翰逊和威廉姆斯。
P5051 表2-17 给出了50家《财富》500强公司的所有者权益、市场价值和利润数据。
(图略)a.构建所有者权益和利润变量的交叉分组表。
对利润数据以0-200,200-400,…,1000-1200分组,对所有者权益数据以0-1200,1200-2400,…,4800-6000分组。
b. 计算(a)中交叉分组表的行百分数。
P 5153. 参考表2-17中的数据集a. 绘出显示利润和所有者权益变量之间关系的散点图。
b. 评价这两个变量之间的关系。
答:二者呈正相关的关系,即所有者权益增加,利润也增加。
但因为所有点并不在一条直线上,所以这种关系不是完全的。
案例2-1 Pelican 商店1. 主要变量的百分数频数分布2. 条形图或饼形图,以显示因促销活动而使顾客购买的百分数。
3. 顾客类型(常规性或奖励性)与销售额的交叉分组表,并评价其相似性与差异性。
动取得了显著成效。
使用折扣赠券购买的奖励性顾客占全体顾客总数的70%,分布于各个销售额区域,尤其在销售额100内的范围里做出了突出贡献,尽管未使用折扣赠券的常规性顾客也主要集中在该销售额区域,但比重明显低于奖励性顾客,且在200以上的销售额区域则无常规性顾客,奖励性顾客的消费金额也扩大到300。
商务统计选择答案.doc

Part One: Multiple Choices:1.The probability that a continuous random variable takes any specific valuea.is equal to zerob.is at least 0.5c.depends on the probability density functiond.is very close to 1.02. A normal distribution with a mean of 0 and a standard deviation of 1 is calleda. a probability density functionb.an ordinary normal curvec. a standard normal distributiond.none of these alternatives is correct3. A negative value of Z indicates thata.the number of standard deviations of an observation is to the right of the meanb.the number of standard deviations of an observation is to the left of the meanc. a mistake has been made in computations, since Z cannot be negatived.the data has a negative mean4.For a continuous random variable x, the probability density function f(x) representsa.the probability at a given value of xb.the area under the curve at xc.the area under the curve to the right of xd.the height of the function at x5.For the standard normal probability distribution, the area to the left of the mean isa.-0.5b.0.5c.any value between 0 to 1d. 1rger values of the standard deviation result in a normal curve that isa.shifted to the rightb.shifted to the leftc.narrower and more peakedd.wider and flatter7. A continuous probability distribution that is useful in describing the time, or space,between occurrences of an event is a(n)a.normal probability distributionb.uniform probability distributionc.exponential probability distributiond.Poisson probability distribution8.Consider a binomial probability experiment with n = 3 and p = 0.1. Then, the probabilityof x = 0 isa.0.0000b.0.0001c.0.001d.0.7299. A continuous random variable may assumea.all values in an interval or collection of intervalsb.only integer values in an interval or collection of intervalsc.only fractional values in an interval or collection of intervalsd.all the positive integer values in an interval10.The highest point of a normal curve occurs ata.one standard deviation to the right of the meanb.two standard deviations to the right of the meanc.approximately three standard deviations to the right of the meand.the meanExhibit 1The assembly time for a product is uniformly distributed between 6 to 10 minutes.11.Refer to Exhibit 1. The probability density function has what value in the interval between 6 and 10?a.0.25b. 4.00c. 5.00d.zero12.Refer to Exhibit 1. The probability of assembling the product between 7 to 9 minutes isa.zerob.0.50c.0.20d. 113.Refer to Exhibit 1. The probability of assembling the product in less than 6 minutes isa.zerob.0.50c.0.15d. 114.Refer to Exhibit 1. The probability of assembling the product in 7 minutes or more isa.0.25b.0.75c.zerod. 115.Refer to Exhibit 1. The expected assembly time (in minutes) isa.16b. 2c.8d. 416.Refer to Exhibit 1. The standard deviation of assembly time (in minutes) is approximatelya. 1.3333b. 1.1547c.0.1111d.0.577317.Center of a normal curve isa.always equal to zerob.is the mean of the distributionc.cannot be negatived.is the standard deviation18.The uniform, normal, and exponential distributions area.all continuous probability distributionsb.all discrete probability distributionsc.can be either continuous or discrete, depending on the datad.all the same distributions19.Which of the following is not a characteristic of the normal probability distribution?a.The mean, median, and the mode are equalb.The mean of the distribution can be negative, zero, or positivec.The distribution is symmetricald.The standard deviation must be 120.In a standard normal distribution, the range of values of z is froma.minus infinity to infinityb.-1 to 1c.0 to 1d.-3.09 to 3.0921.Parameters area.numerical characteristics of a sampleb.numerical characteristics of a populationc.the averages taken from a sampled.numerical characteristics of either a sample or a population22.How many simple random samples of size 3 can be selected from a population of size 7?a.7b.21c.35d.34323. A population consists of 500 elements. We want to draw a simple random sample of 50 elements from this population. On the first selection, the probability of an element being selected isa.0.100b.0.010c.0.001d.0.00224.The closer the sample mean is to the population mean,a.the larger the sampling errorb.the smaller the sampling errorc.the sampling error equals 1d.None of these alternatives is correct.25.Since the sample size is always smaller than the size of the population, the sample meana.must always be smaller than the population meanb.must be larger than the population meanc.must be equal to the population meand.can be smaller, larger, or equal to the population mean26.As the sample size increases, thea.standard deviation of the population decreasesb.population mean increasesc.standard error of the mean decreasesd.standard error of the mean increases27. A simple random sample from an infinite population is a sample selected such thata.each element is selected independently and from the same populationb.each element has a 0.5 probability of being selectedc.each element has a probability of at least 0.5 of being selectedd.the probability of being selected changes28.In point estimationa.data from the population is used to estimate the population parameterb.data from the sample is used to estimate the population parameterc.data from the sample is used to estimate the sample statisticd.the mean of the population equals the mean of the sample29.The sample mean is the point estimator ofa.pib.Gc.xd.-P30.The expected value of the random variable x isa.the standard errorb.the sample sizec.the size of the populationd.None of these alternatives is correct.31.The standard deviation of all possible x values is called thea.standard error of proportionb.standard error of the meanc.mean deviationd.central variation32.Whenever the population has a normal probability distribution, the sampling distribution of x is a normal probability distribution fora.only large sample sizesb.only small sample sizesc.any sample sized.only samples of size thirty or greater33.The sampling error is thea.same as the standard error of the meanb.difference between the value of the sample mean and the value of the population meanc.error caused by selecting a bad sampled.standard deviation multiplied by the sample size34.Which of the following is(are) point estimator(s)?a. ab.p,c.sd.a35. A population characteristic, such as a population mean, is calleda. a statisticb. a parameterc. a sampled.the mean deviation36. A single numerical value used as an estimate of a population parameter is known asa. a parameterb. a population parameterc. a mean estimatord. a point estimate37.The purpose of statistical inference is to provide information about thea.sample based upon information contained in the populationb.population based upon information contained in the samplec.population based upon information contained in the populationd.mean of the sample based upon the mean of the population38.The number of random samples (without replacement) of size 3 that can be drawn from a population of size 5 isa.15b.10c.20d.12539.For a population with any distribution, the form of the sampling distribution of the sample mean isa.sometimes normal for all sample sizesb.sometimes normal for large sample sizesc.always normal for all sample sizesd.always normal for large sample sizes40. A simple random sample of 28 observations was taken from a large population. The sample mean equaled 50. Fifty is aa.population parameterb.biased estimate of the population meanc.sample parameterd.point estimate41.When s is used to estimate G, the margin of error is computed by usinga.normal distributionb.t distributionc.the mean of the sampled.the mean of the population42.From a population with a variance of 900, a sample of 225 items is selected. At 95% confidence, the margin of error isa.15b. 2c. 3.92d. 443.In order to determine an interval for the mean of a population with unknown standard deviation a sample of 61 items is selected. The mean of the sample is determined to be 23. The number of degrees of freedom for reading the t value isa.22b.23c.60d.6144.If we want to provide a 95% confidence interval for the mean of a population, the confidence coefficient isa.0.485b. 1.96c.0.95d. 1.64545.As the number of degrees of freedom for a t distribution increases, the difference between the t distribution and the standard normal distributiona.becomes largerb.becomes smallerc.stays the samed.None of these alternatives is correct.46.For the interval estimation of p, when o is known and the sample is large, the proper distribution to use isa.the normal distributionb.the t distribution with n degrees of freedomc.the t distribution with n + 1 degrees of freedomd.the t distribution with n + 2 degrees of freedom47.An estimate of a population parameter that provides an interval of values believed to contain the value of the parameter is known as thea.confidence levelb.interval estimatec.parameter valued.population estimate48.The value added and subtracted from a point estimate in order to develop an interval estimate of the population parameter is known as thea.confidence levelb.margin of errorc.parameter estimated.interval estimate49.If an interval estimate is said to be constructed at the 90% confidence level, the confidence coefficient would bea.0.1b.0.95c.0.9d.0.0550.Whenever the population standard deviation is unknown and the population has a normal or near-normal distribution, which distribution is used in developing an interval estimation?a.standard distributionb.z distributionc.alpha distributiond.t distribution51.In interval estimation, the t distribution is applicable only whena.the population has a mean of less than 30b.the sample standard deviation is used to estimate the population standard deviationc.the variance of the population is knownd.the standard deviation of the population is known52.In developing an interval estimate, if the population standard deviation is unknowna.it is impossible to develop an interval estimateb.the standard deviation is arrived at using the rangec.the sample standard deviation can be usedd.it is assumed that the population standard deviation is 153.In order to use the normal distribution for interval estimation of)i when cr is known and the sample is very small, the populationa.must be very largeb.must have a normal distributionc.can have any distributiond.must have a mean of at least 154.From a population that is not normally distributed and whose standard deviation is not known, a sample of 6 items is selected to develop an interval estimate for the mean of the population (y).a.The normal distribution can be used.b.The t distribution with 5 degrees of freedom must be used.c.The t distribution with 6 degrees of freedom must be used.d.The sample size must be increased.55.From a population that is normally distributed, a sample of 25 elements is selected and the standard deviation of the sample is computed. For the interval estimation of pi, the proper distribution to use is thea.normal distributionb.t distribution with 25 degrees of freedomc.t distribution with 26 degrees of freedomd.t distribution with 24 degrees of freedom56.As the sample size increases, the margin of errora.increasesb.decreasesc.stays the samed.increases or decreases depending on the size of the mean57. A 95% confidence interval for a population mean is determined to be 100 to 120. If the confidence coefficient is reduced to 0.90, the interval for(ia.becomes narrowerb.becomes widerc.does not changed.becomes 0.158.The ability of an interval estimate to contain the value of the population parameter is described by thea.confidence levelb.degrees of freedomc.precise value of the population mean p,d.degrees of freedom minus 159.An interval estimate is a range of values used to estimatea.the shape of the population's distributionb.the sampling distributionc. a sample statisticd. a population parameter60.In determining the sample size necessary to estimate a population proportion, which of the following information is not needed?a.the maximum margin of error that can be toleratedb.the confidence level requiredc. a preliminary estimate of the true population proportion Pd.the mean of the population61.What type of error occurs if you fail to reject H o when, in fact, it is not true?a.Type IIb.Type Ic.either Type I or Type II, depending on the level of significanced.either Type I or Type II, depending on whether the test is one tail or two tail62.An assumption made about the value of a population parameter is called aa.hypothesisb.conclusionc.confidenced.significance63.The probability of committing a Type I error when the null hypothesis is true isa.the confidence levelb.卩c.greater than 1d.the Level of Significance64.The p-value is a probability that measures the support (or lack of support) for thea.null hypothesisb.alternative hypothesisc.either the null or the alternative hypothesisd.sample statistic65.The p-valuea.is the same as the Z statisticb.measures the number of standard deviations from the meanc.is a distanced.is a probability66.In hypothesis testing if the null hypothesis is rejected,a.no conclusions can be drawn from the testb.the alternative hypothesis is truec.the data must have been accumulated incorrectlyd.the sample size has been too small67.The level of significance is thea.maximum allowable probability of Type II errorb.maximum allowable probability of Type I errorc.same as the confidence coefficientd.same as the p-value68. A Type II error is committed whena. a true alternative hypothesis is mistakenly rejectedb. a true null hypothesis is mistakenly rejectedc.the sample size has been too smalld.not enough information has been available69.The level of significancea.can be any positive valueb.can be any valuec.is (1 - confidence level)d.can be any value between -1.96 to 1.9670.When the following hypotheses are being tested at a level of significance of aH o: pi > 500H a: ]i < 500the null hypothesis will be rejected if the p-value isa.< aH a : ]i > 10.0%H a : |i > 10.0%H a : ]i < 10.0%d. Ho : pi > 10.0% H a : ]i < 10.0%a. Ho : pi < 85 H a : pi > 85b. Ho : pi < 85 H a : p, >c. Ho : pi > 85 H a : p, < 85d. Ho : pi > 85 H a : pi < 85 a. Ho :pi < 12 H a : pi < 12b. Ho : pi < 12 H a : p, >c. Ho: pi H 12H a : p, = 12b. > ac. > a/2d. < 1 - a/271. When the p-value is used for hypothesis testing, the null hypothesis is rejected if a. p-value < ab. a < p-valuec. p-value > ad. p-value = 1 - a72. In order to test the following hypotheses at an a level of significanceH o : pi < 800H a : ]i > 800the null hypothesis will be rejected if the test statistic Z isa. 巴 Z Qb. <Z ac. < -Z ad. = a73. Your investment executive claims that the average yearly rate of return on the stocks she recommends is more than 10.0%. You plan on taking a sample to test her claim. The correct setof hypotheses is a. H o : pi < 10.0% b. Ho : pi < 10.0%c. Ho : pi > 10.0%74. A weatherman stated that the average temperature during July in Chattanooga is less than 80 degrees. A sample of 32 Julys is taken. The correct set of hypotheses is a . H o : pi > 80 H a : p, <80 b . H o : pi < 80 H a : p, >80 c . H o : —80 H a : p, =80 d . H o : pi < 80 H a : p, >80 75. A student believes that the average grade on the final examination in statistics is at least85. She plans on taking a sample to test her belief. The correct set of hypotheses is76. A soft drink filling machine, when in perfect adjustment, fills the bottles with 12 ouncesof soft drink. Any over filling or under filling results in the shutdown and readjustment of the machine. To determine whether or not the machine is properly adjusted, the correct set ofhypotheses is d. Ho : p = 1277. A two-tailed test is performed at 95% confidence. The p-value is determined to be 0.09. The null hypothesisa.must be rejectedb.should not be rejectedc . could be rejected, depending on the sample sized . has been designed incorrectly7 8Exhibit 2n = 49 x = 54.8 s = 28 H o: pi < 50H a: p, > 50Refer to Exhibit 2. The test statistic isa . 0.1714b . 0.3849c . -1.2d . 1.27 9Refer to Exhibit 2. The p-value is betweena . 0.01 to 0.025b . 0.025 to 0.05c . .05 to 0.1d . 0.1 to 0.28 0Refer to Exhibit 2. If the test is done at the 5% level of significance, the null hypothesisshoulda . not be rejectedb . be rejectedc . Not enough information given to answer this question.d . None of these alternatives is correct.8 1If we are interested in testing whether themeanof population 1 is significantly largerthanthe mean of population 2, thea . null hypothesis should state 内-应 > 0b . null hypothesis should state 内-应巴0c . alternative hypothesis should state p,i - |i2 > 0d . alternative hypothesis should state pii -112 < 08 2If we are interested in testing whether themeanof population 1 is significantlydifferentfrom the mean of population 2, thea . null hypothesis should state 山-应=0b . null hypothesis should state 山-应巴0c . alternative hypothesis should state p,i - |i2 > 0d . alternative hypothesis should state pii -112 < 08 3When developing an interval estimate for the difference between two sample means, withsample sizes of m and n2,a . Ni must be equal to n2b . Ni must be smaller than n2c . Ni must be larger than n2d . Ni and n2 can be of different sizes,84.Independent simple random samples are taken to test the difference between the means of two populations whose variances are not known, but are assumed to be equal. The samplesizes are m = 32 and n2 = 40. The correct distribution to use is thea.t distribution with 73 degrees of freedomb.t distribution with 72 degrees of freedomc.t distribution with 71 degrees of freedomd.t distribution with 70 degrees of freedom85.If two independent large samples are taken from two populations, the sampling distribution of the difference between the two sample meansa.can be approximated by a Poisson distributionb.will have a variance of onec.can be approximated by a normal distributiond.will have a mean of one86.The standard error of x -x2 is thea.--variance of x 严Qb.--variance of the sampling distribution of 区厂乂?c.- ~standard deviation of the sampling distribution of x 严?d.difference between the two means87.In the analysis of variance procedure (ANOVA), ''factor'' refers toa.the dependent variableb.the independent variablec.different levels of a treatmentd.the critical value of F88.The ANOVA procedure is a statistical approach for determining whether or nota.the means of two samples are equalb.the means of two or more samples are equalc.the means of more than two samples are equald.the means of two or more populations are equal89.An experimental design where the experimental units are randomly assigned to the treatments is known asa.factor block designb.random factor designpletely randomized designd.None of these alternatives is correct.90.In an analysis of variance problem involving 3 treatments and 10 observations per treatment, SSE = 399.6. The MSE for this situation isa.133.2b.199.8c.14.8d.30.04 4 4 191.The F ratio in a completely randomized ANOVA is the ratio ofa.MSTR/MSEb.MST/MSEc.MSE/MSTRd.MSE/MST92.The critical F value with 6 numerator and 60 denominator degrees of freedom at a = .05 isa. 3.74b. 2.25c. 2.37d. 1.9693.An ANOVA procedure is applied to data obtained from 6 samples where each sample contains 20 observations. The degrees of freedom for the critical value of F area. 6 numerator and 20 denominator degrees of freedomb. 5 numerator and 20 denominator degrees of freedomc. 5 numerator and 114 denominator degrees of freedomd. 6 numerator and 20 denominator degrees of freedom94.In an analysis of variance problem if SST = 120 and SSTR = 80, then SSE isa.200b.40c.80d.12095.An ANOVA procedure is used for data that was obtained from four sample groups each comprised of five observations. The degrees of freedom for the critical value of F area. 3 and 20b. 3 and 16c. 4 and 17d. 3 and 1996.In ANOVA, which of the following is not affected by whether or not the population means are equal?a.xb.between-samples estimate of c>2c.within-samples estimate of c>2d.None of these alternatives is correct.97. A term that means the same as the term "variable" in an ANOVA procedure isa.factorb.treatmentc.replicationd.variance withinExhibit 3Salary information regarding male and female employees of a large company is shown below.Male FemaleSample Size 64 36Sample Mean Salary (in $1,000)Population Variance (cr2) 128 7298.Refer to Exhibit 3. The point estimate of the difference between the means of the two populations isa.-28b. 3c. 4d.-499.Refer to Exhibit 3. The standard error for the difference between the two means isa. 4b.7.46c. 4.24d. 2.0100.Refer to Exhibit 3. At 95% confidence, the margin of error isa. 1.96b. 1.645c. 3.920d. 2.000101.The coefficient of determinationa.cannot be negativeb.is the square root of the coefficient of correlationc.is the same as the coefficient of correlationd.can be negative or positive102.If the coefficient of determination is a positive value, then the coefficient of correlationa.must also be positiveb.must be zeroc.can be either negative or positived.must be larger than 1103.The mathematical equation relating the independent variable to the expected value of the dependent variable; that is, E(y) = P0 + 卩lx, is known asa.regression equationb.correlation equationc.estimated regression equationd.regression model104.The model developed from sample data that has the form of y = + ijX is known asa.regression equationb.correlation equationc.estimated regression equationd.regression model105.The interval estimate of the mean value of y for a given value of x isa.prediction interval estimateb.confidence interval estimatec.average regressiond.x versus y correlation interval106.The interval estimate of an individual value of y for a given value of x isa.prediction interval estimateb.confidence interval estimatec.average regressiond.x versus y correlation interval107.In a regression analysis the standard error is determined to be 4. In this situation the MSEa.is 2b.is 16c.depends on the sample sized.depends on the degrees of freedom108.In regression analysis, which of the following is not a required assumption about the error term £?a.The expected value of the error term is one.b.The variance of the error term is the same for all values of X.c.The values of the error term are independent.d.The error term is normally distributed.109.In a regression analysis, the coefficient of determination is 0.4225. The coefficient of correlation in this situation isa.0.65b.0.1785c.any positive valued.any value110.In a regression analysis, the coefficient of correlation is 0.16. The coefficient of determination in this situation isa.0.4000b.0.0256c. 4d. 2.56111.In a regression and correlation analysis if r2 = 1, thena.SSE must also be equal to oneb.SSE must be equal to zeroc.SSE can be any positive valued.SSE must be negative112.In a regression and correlation analysis if r2 = 1, thena.SSE = SSTb.SSE= 1c.SSR = SSEd.SSR = SST113.If the coefficient of correlation is a positive value, then the regression equationa.must have a positive slopeb.must have a negative slopec.could have either a positive or a negative sloped.must have a positive y intercept114.If the coefficient of correlation is 0.& the percentage of variation in the dependent variable explained by the variation in the independent variable isa.0.80%b.80%c.0.64%d.64%115.In regression and correlation analysis, if SSE and SST are known, then with this information thea.coefficient of determination can be computedb.slope of the line can be computedc.Y intercept can be computedd.x intercept can be computed116.In regression analysis, if the independent variable is measured in pounds, the dependent variablea.must also be in poundsb.must be in some unit of weightc.cannot be in poundsd.can be any units117.If the coefficient of correlation is -0.4, then the slope of the regression linea.must also be -0.4b.can be either negative or positivec.must be negatived.must be 0.16118.If the coefficient of correlation is a negative value, then the coefficient of determinationa.must also be negativeb.must be zeroc.can be either negative or positived.must be positive119.If a data set has SSR = 400 and SSE = 100, then the coefficient of determination isa.0.10b.0.25c.0.40d.0.80pared to the confidence interval estimate for a particular value of y (in a linear regression model), the interval estimate for an average value of y will bea.narrowerb.widerc.the samed.None of these alternatives is correct.。
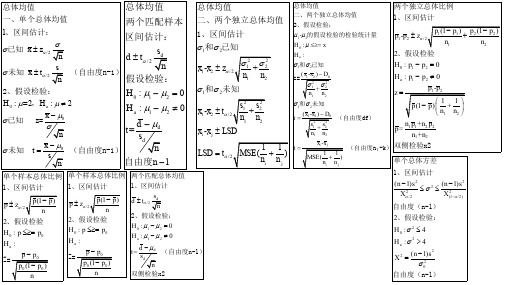
安德森-商务与经济统计公式汇总
d d (自由度n-1) sd n 双侧检验x2 t=
(n 1) s 2
02
自由度(n-1)
多项总体方差 1、拟合优度 H 0 : PA 0.3, PB 0.5, PC 0.2 ( fi ei ) 2 X = ei i 1
2 k
多项总体方差 3、方差分析 完全随机化单因子(随机无重复)
t
2 s12 s2 + n1 n2
2 1
n1 t
+
2Байду номын сангаас2
n2
p1 -p2
1和 2未知
( x1 -x2 ) D0
2 s12 s2 + n1 n2
已知 z =
d d n sd x 0 n 未知 t (自由度n-1) s 自由度n 1 n
单个样本总体比例 单个样本总体比例 两个匹配总体均值 1、区间估计 1、区间估计 1、区间估计 p (1 p ) p z /2 n 2、假设检验 H 0 : p p0 Ha : Z= p p0 p0 (1 p0 ) n
j 1 k
ei =总观察频数 各项假设比例 2、独立性 H 0 : 偏好与性别独立 H p : 偏好与性别不独立 X =
2 i
SSTR b (x j -x)
j 1
2
SST = ( xij x )
j 1 i 1 k
k
nj
2
SSBL k (xi -x)
i 1
b
2
两个独立总体比例 1、区间估计 p1 -p2 z /2 p1 (1 p1 ) p2 (1 p2 ) n1 n2
已知 x z /2 未知 x t /2
国际经济学第八版课后答案

国际经济学第八版课后答案国际经济学是当代世界上重要的一门学科,在全球经济不断发展的今天,在不同国家和地区间进行国际贸易和投资已成为一种常态,而这种现象的背后,正是国际经济学的基础理论支撑,因此学习国际经济学的重要性日益凸显。
而对于国际经济学这门学科来说,了解、掌握相关的知识点和要点,完成课后习题,是非常重要的。
国际经济学第八版通过对国际贸易、投资、汇率、国际收支等一系列问题进行系统讲述,对学生进行全方位的培养,涉及到的知识点也十分广泛,因此,在完成课后习题时,可能会遇到一定的问题,需要一定的帮助和指导才能完成。
因此,对于国际经济学第八版课后答案的研究也显得尤为重要。
在研究国际经济学第八版课后答案时,我们需要注意以下几点:1.仔细阅读教材,掌握理论基础课后习题的主要目的就是帮助学生巩固课堂上所学的知识点和理论基础,因此在完成课后习题时,学生需要仔细阅读教材,掌握理论基础。
只有对教材中所介绍的理论和分析方法有了充分的理解和把握,才能更好地完成课后习题,理解其中的思想和要点。
2.注重实践应用,锻炼思维能力国际经济学的学习需要注重实践应用,在完成课后习题时也应该如此,尤其是在解决实际问题的时候,需要更注重实践应用,并且要灵活运用学到的理论知识,通过对问题的分析、解答、讨论,锻炼自己的思维能力和创新意识。
3.积极参与交流讨论,锻炼合作能力课后习题的完成,不是个人的事情,而是需要学生之间相互交流、讨论、合作实现的,因此,在完成课后习题时,学生需要积极参与交流讨论,通过与同学之间的互动和交流,可以加深对问题的理解和认识,锻炼自己的合作能力。
4.注意答案的准确性和合理性在完成课后习题时,需要注意答案的准确性和合理性,只有在确认自己所得出的答案是准确的、合理的,才能对所学到的内容有充分的理解和掌握。
综上所述,国际经济学第八版课后答案对于学生的学习来说具有非常重要的作用,同时也需要注意一些问题。
最后,我们希望广大学生能够通过认真学习、积极思考、有效交流,掌握好国际经济学的相关知识点,为将来更好地服务国家和世界经济发展做出自己的贡献。
商务统计习题解答.doc
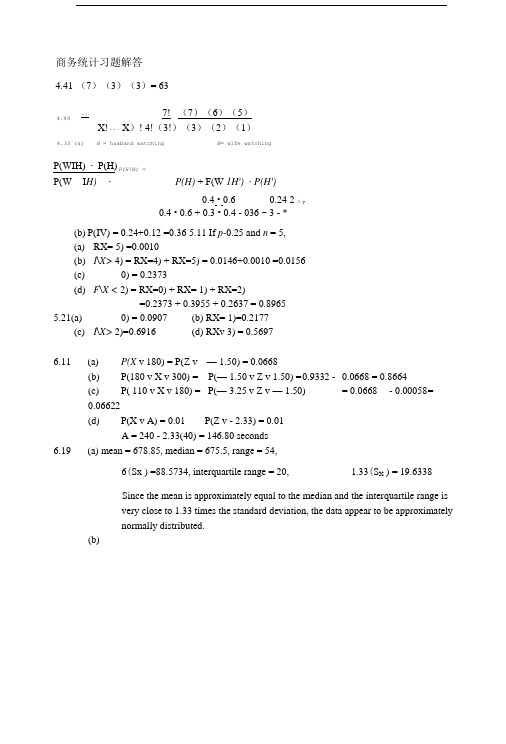
4.49 4.33 (a)H = husband watching W= wife watching P(H\W) =商务统计习题解答4.41 (7)(3)(3)= 63〃! _ 7! _(7)(6)(5)X!(〃一 X )! 4!(3!)(3)(2)(1)P(WIH)・P(H) P(W I H)・P(H) + F(W 1H')・P(H')0.4 • 0.6 0.24 2 八 y0.4 • 0.6 + 0.3 • 0.4 - 036 ~ 3 - *(b) P(IV) = 0.24+0.12 =0.36 5.11 If p-0.25 and n = 5,(a) RX= 5) =0.0010(b) I\X> 4) = RX=4) + RX=5) = 0.0146+0.0010 =0.0156(c) 0) = 0.2373(d) F\X < 2) = RX=0) + RX= 1) + RX=2)=0.2373 + 0.3955 + 0.2637 = 0.89655.21(a) 0) = 0.0907 (b) RX= 1)=0.2177(c) I\X> 2)=0.6916 (d) RXv 3) = 0.56976.11 (a) P(X v 180) = P(Z v — 1.50) = 0.0668(b) P(180 v X v 300) = P(— 1.50 v Z v 1.50) = 0.9332 - 0.0668 = 0.8664(c) P( 110 v X v 180) = P(— 3.25 v Z v — 1.50) = 0.0668 - 0.00058 =0.06622(d) P(X v A) = 0.01 P(Z v - 2.33) = 0.01A = 240 - 2.33(40) = 146.80 seconds6.19(a) mean = 678.85, median = 675.5, range = 54,6(Sx ) =88.5734, interquartile range = 20, 1.33(S X ) = 19.6338 Since the mean is approximately equal to the median and the interquartile range isvery close to 1.33 times the standard deviation, the data appear to be approximatelynormally distributed.(b)710X±Z- 350±1.96- 100V64 325.5 < 辱 374.50The normal probability plot suggests that the data appear to be approximately normally distributed. 7.9 (a)P(叉 < 0.75) = P(Z < -1.3693) = 0.0855 (b)P(0.70 <X < 0.90) = P(—2.7386 <Z<2.7386) = 0.9938 (c) P(A< X < B) = P(- L2816 < Z < 1.2816) = 0.80A =0.8-1.2816 (0.0365) = 0.7532 B= 0.8 +1.2816 (0.0365) = 0.8468(d) P(X <A) = P(Z< 1.2816) = 0.90 A = 0.8 +1.2816 (0.0365) = 0.8468Note: The above answers are obtained using PHStat. They may be slightly different whenTable E.2 is used.7.19 (a) P(0.15 vp v0.25) = P(- 1.25 <Z< 1.25)=0.7887(b) P(A<p<B) = P(- 1.6449 <Z< 1.6449) = 0.90A = 0.2 - 1.6449(0.04) = 0.1342B = 0.2 + 1.6449(0.04) = 0.2658(c) P(A v p v B) = P(- 1.960<Z< 1.960) = 0.95A =0.2 - 1.960(0.04) = 0.12160.2+ 1.96(0.04) = 0.27848.8 (a)(b) No. The manufacturer cannot support a claim that the bulbs last an average 400 hours.Based on the data from the sample, a mean of 400 hours would represent a distanceof 4 standard deviations above the sample mean of 350 hours.(c) No. Since is known and n = 64, from the Central Limit Theorem, we may assumethat the sampling distribution of X is approximately normal.(d) The confidence interval is narrower based on a process standard deviation of 80hours rather than the original assumption of 100 hours.Normal Probability Plot690 680670660700650 -2 -1.5 -1 -0.5 0 0.51 Z Value 1.5 2a loo sMp(a)8.18 (a) X±F・S “,c 八4.6024 -7= = 23 ±2.0739•― 4nV23 $21.01 <//< $24.99一cr80~F= = 350 ± 1.96 • —f=X ± Z ・4tr V64(b) Based on the smaller standard deviation, a mean of 400 hours would represent adistance of 5 standard deviations above the sample mean of 350 hours. No,the manufacturer cannot support a claim that the bulbs have a mean life of400 hours.(b) You can be 95% confident that the mean bounced check fee for the population issomewhere between $21.01 and $24.99.又◊又 (\n 77 . 7〔P(l ? P n77 . j QA /0.77(0.23)8.28 (a) p= 0.77 p ± Z • ------------------------- =().77 ±1.96」 ------------------------------\ n V 10000.74 <7t< 0.80(b)p = 0.77 p ± Z •、格王=0.77 ± 1,645/wWV n v 10000.75 <7T< 0.79(c)The 95% confidence interval is wider. The loss in precision reflected as a widerconfidence interval is the price you have to pay to achieve a higher level ofconfidence.Z2<T2 1.962 - 40028.38 (a) n =——=-------------- -—— =245.86 Use n = 246& 50~, Z2cr2 1.962 -4002八”八TT八睥(b) n = ——-— = --------------- ---- =983.41 Use n = 984& 2529.30 (a) Ho: " =375 hours. The mean life of the manufacturers light bulbs isequal to 375 hours.H\: // #375 hours. The mean life of the manufacturer9s light bulbs differs from375 hours.Decision rule: Reject 仇if Z v - 1.96 or Z > + 1.96.Test statistic: Z =与人笔尹=-2.00Decision: Since Z c^ = 一2.00 is below the critical bound of - 1.96, reject There isenough evidence to conclude that the mean life of the manufacturer's light bulbsdiffers from 375 hours.(b) ^-value = 2(0.0228) = 0.0456.Interpretation: The probability of getting a sample of 64 light bulbs that will yielda mean life that is farther away from the hypothesized population mean than thissample is 0.0456-(c)Test statistic: t = s 商 315.33/应y!n<64 (d) The results are the same. The confidence interval formed does not include thehypothesized value of 375 hours.9.58 (a) H Q : // < 400 The mean life of the batteries is not more than 400 hours. H 、: 〃> 400 The mean life of the batteries is more than 400 hours.X 一以 473.46-400 t “ --------------- 7= = 7= = 1 .230 / s/y/n 210.77/J13 Decision: Since t < 1.7823, do not reject H 。
《商务与经济统计课程》前三次作业参考答案
MS
F
兽医师间
0.03
4
0.0075 0.0065(ns)
奶牛间
0.65
4
0.1625
0.1404(ns)
试管间
0.19
4
0.0475
0.0410(ns)
Error
13.89
12
1.1575
Total
14.76
24
方差分析结果表明,兽医师间、奶牛间、试管间血色素的差异均不显著。
2.12 在下面变量中,哪些属于连续型变量?哪些属于离散型变量? (1)屠宰生畜头数量;(2)零件尺寸偏差;(3)飞机耗汽油;(4)报废的汽车数;(5)存 款余额;(6)洪水涨落尺度;(7)选民投票数;(8)车轮转速;(9)森林覆盖面积;(10) 价格。
1600
计数 4 4 7 10 9 6
组距 100 100 200 400 800 800
频数密度 0.040 0.040 0.035 0.025 0.011 0.008
3.10 试根据下表资料绘制曲线图,并指出该曲线图属于什么类型?
表 3-13
1900-1978 世界人口变化资料
单位:百万人
年份
补充: (1) 标准拉丁方阵、一般拉丁方阵以及拉丁方阵的一个定理
拉丁方阵是一种 n×n 的方阵,方阵中恰有 n 种不同的元素,每种元素恰有 n 个,并 且每种元素在一行和一列中恰好出现一次。当一个拉丁方阵的第一行与第一列的元素按顺序 排列时,即为拉丁方阵的标准型,称为"reduced Latin square, normalized Latin square, 或 Latin square in standard form"。一般拉丁方阵也就是区别于标准拉丁方阵且符合拉丁方阵条件的
商务统计期末试题及答案
商务统计期末试题及答案【注意:以下为示例文章格式,实际内容与题目无关】一、选择题(每题2分,共30分)1. 下面哪个选项是正确的?A. 1+1=2B. 1+1=3C. 1+1=4D. 1+1=5答案:A2. 给定数据集的平均值为5,标准差为2,那么方差为多少?A. 1B. 2C. 4D. 8答案:C二、判断题(每题2分,共20分)1. 描述性统计是通过样本数据推断总体特征的方法。
答案:正确2. 概率分布函数可以描述随机变量的所有可能取值的概率。
答案:正确三、计算题1. 一个班级有30名学生,其中男生有20名,女生有10名。
请计算男生人数占总人数的比例,并将结果四舍五入到小数点后两位。
答案:20 / 30 = 0.67,四舍五入为 0.672. 有一个餐厅,星期一到星期五的销售额分别为1000、1500、1200、800、2000元,请计算平均销售额。
答案:(1000 + 1500 + 1200 + 800 + 2000) / 5 = 1100元3. 一家公司销售了3种产品,产品A的销售额占总销售额的30%,产品B的销售额占总销售额的40%,产品C的销售额为2000元,求总销售额。
答案:产品C的销售额占总销售额的30% + 40% = 70%,则总销售额为2000元 / 70% = 2857.14元四、应用题某公司进行了一次市场调研,调查了1000名顾客的购买行为。
以下是调查结果:- 500人购买了产品A- 300人购买了产品B- 200人购买了产品C- 100人购买了产品A和产品B- 50人购买了产品B和产品C- 20人购买了产品A和产品C- 10人购买了三种产品请回答以下问题:1. 购买了产品A但未购买产品B的顾客有多少人?答案:购买了产品A的人数减去购买了产品A和产品B的人数:500 - 100 = 400人2. 购买了产品B且同时购买了产品C的顾客有多少人?答案:购买了产品B和产品C的人数:50人3. 购买了至少一种产品的顾客有多少人?答案:购买了产品A、B或C的人数加上购买了三种产品的人数:500 + 300 + 200 - 10 = 990人五、简答题1. 请解释什么是样本调查?答:样本调查是从总体中选取一部分样本,并对这些样本进行调查和研究,通过对样本的观察和分析来推断总体的特征和规律。
商务与经济统计前6章笔记
商务与经济统计前6章笔记下载温馨提示:该文档是我店铺精心编制而成,希望大家下载以后,能够帮助大家解决实际的问题。
文档下载后可定制随意修改,请根据实际需要进行相应的调整和使用,谢谢!并且,本店铺为大家提供各种各样类型的实用资料,如教育随笔、日记赏析、句子摘抄、古诗大全、经典美文、话题作文、工作总结、词语解析、文案摘录、其他资料等等,如想了解不同资料格式和写法,敬请关注!Download tips: This document is carefully compiled by the editor. I hope that after you download them, they can help you solve practical problems. The document can be customized and modified after downloading, please adjust and use it according to actual needs, thank you!In addition, our shop provides you with various types of practical materials, such as educational essays, diary appreciation, sentence excerpts, ancient poems, classic articles, topic composition, work summary, word parsing, copy excerpts, other materials and so on, want to know different data formats and writing methods, please pay attention!商务与经济统计前6章笔记第一章:商务与经济统计概述在当今全球化的商业环境中,商务与经济统计扮演着至关重要的角色。