HVOF sprayed Al–Cu–Cr quasicrystalline coatings from coarse feedstock powders
银柴胡多糖超声辅助提取工艺优化及抗氧化活性分析

王红,彭励,宋乐,等. 银柴胡多糖超声辅助提取工艺优化及抗氧化活性分析[J]. 食品工业科技,2024,45(1):185−191. doi:10.13386/j.issn1002-0306.2023030025WANG Hong, PENG Li, SONG Le, et al. Optimization of Ultrasonic-assisted Extraction Process and Analysis of Antioxidant Activity of Polysaccharide from Stellariae Radix[J]. Science and Technology of Food Industry, 2024, 45(1): 185−191. (in Chinese with English abstract). doi: 10.13386/j.issn1002-0306.2023030025· 工艺技术 ·银柴胡多糖超声辅助提取工艺优化及抗氧化活性分析王 红1,彭 励1,2, *,宋 乐1,冯 璐1,李振凯1,李彦青1,高 跳1(1.宁夏大学生命科学学院,宁夏银川 750021;2.宁夏天然药物工程技术研究中心,宁夏银川 750021)摘 要:目的:为了提高银柴胡多糖得率,对银柴胡多糖提取工艺参数进行优化,并评价其体外抗氧化活性。
方法:采用超声辅助提取银柴胡多糖,在单因素实验基础上结合响应面法(Box–Behnken Response Surface )对提取工艺参数进行优化,并采用Sevag 法除蛋白得银柴胡粗多糖,进一步对其抗氧化活性进行分析。
结果:优化后银柴胡多糖最佳提取工艺参数为超声温度50 ℃、时间3.20 h 、提取次数2 次,在此条件下多糖得率最高,为28.24%±0.10%,多糖含量为59.13%;体外抗氧化测定结果显示,银柴胡粗多糖清除DPPH 自由基、OH 自由基、ABTS +自由基的IC 50分别是5.47、2.40和1.44 mg/mL ,表明其具有一定的抗氧化能力。
Appl. Environ. Microbiol.-2012-Sun-2025-33

Published Ahead of Print 13 January 2012. 10.1128/AEM.05755-11.2012, 78(6):2025. DOI:Appl. Environ. Microbiol. Hongbin LiuMing-Ming Sun, Jin Sun, Jian-Wen Qiu, Hongmei Jing andAlkaline Phosphatase ActivityPhosphate Limitation-Specific Protein with Nitrogen-Limiting Conditions and of Its lagunensis under Phosphate- andof the Brown Tide Alga Aureoumbra Characterization of the Proteomic Profiles /content/78/6/2025Updated information and services can be found at: These include:SUPPLEMENTAL MATERIALSupplemental material REFERENCES/content/78/6/2025#ref-list-1at: This article cites 50 articles, 10 of which can be accessed free CONTENT ALERTSmore»articles cite this article), Receive: RSS Feeds, eTOCs, free email alerts (when new /site/misc/reprints.xhtml Information about commercial reprint orders: /site/subscriptions/To subscribe to to another ASM Journal go to: on June 2, 2013 by Xiamen University/Downloaded fromCharacterization of the Proteomic Profiles of the Brown Tide Alga Aureoumbra lagunensis under Phosphate-and Nitrogen-Limiting Conditions and of Its Phosphate Limitation-Specific Protein with Alkaline Phosphatase ActivityMing-Ming Sun,a Jin Sun,b Jian-Wen Qiu,b Hongmei Jing,a and Hongbin Liu aDivision of Life Science,the Hong Kong University of Science and Technology,Clear Water Bay,Hong Kong,China,a and Department of Biology,Hong Kong Baptist University,Hong Kong,China bThe persistent bloom of the brown tide alga Aureoumbra lagunensis has been reported in coastal embayments along southern Texas,but the molecular mechanisms that sustain such algal bloom are unknown.We compared the proteome and physiological parameters of gunensis grown in phosphate(P)-depleted,P-and nitrogen(N)-depleted,and nutrient-replete cultures.For the proteomic analysis,samples from three conditions were subjected to two-dimensional electrophoresis and tandem mass spectrometry analysis.Because of the paucity of genomic resources in this species,a de novo cross-species protein search was used to identify the differentially expressed proteins,which revealed their involvement in several key biological processes,such as chlorophyll synthesis,antioxidative protection,and protein degradation,suggesting that gunensis may adopt intracellu-lar nutrient compensation,extracellular organic nutrient regeneration,and damage protection to thrive in P-depleted environ-ments.A highly abundant P limitation-specific protein,tentatively identified as a putative alkaline phosphatase,was further characterized by enzyme activity assay on nondenaturing gel and confocal microscopy,which confirmed that this protein has alkaline phosphatase activity,is a cytoplasmic protein,and is closely associated with the cell membrane.The abundance,loca-tion,and functional expression of this alkaline phosphatase all indicate the importance of organic P utilization for gunensis under P limitation and the possible role of this alkaline phosphatase in regenerating phosphate from extra-or intracellular or-ganic phosphorus.A ureoumbra lagunensis(Pelagophyceae),the so-called Texasbrown tide alga,is a small single-celled pelagophyte that had formed a persistent bloom in several coastal embayments along southern Texas from1989to1997(12).This was the longest con-tinuous harmful algal bloom ever documented in history and caused great damage to the pelagic and benthic ecosystems(37). As algal blooms require environmental inorganic nutrients to sus-tain,this case has raised questions about the relationship between algal bloom and nutrient supply.Afield survey revealed a highly significant inverse relationship between ambient phosphate level and gunensis cell density during the bloom(40).Laboratory batch culture(49)and chemostate(29)experiments confirmed the extremely high tolerance of gunensis to phosphate(P) limitation(critical nitrogen[N]:PϾ174).Thesefield and labora-tory studies indicated that gunensis is well adapted to low-phosphate environments.Different from many algal species which bloom when phos-phorus input is high(2),the pelagophytes gunensis and Au-reococcus anophagefferens and the coccolithophore Emiliania hux-leyi bloom at low dissolved inorganic phosphorus(DIP) concentrations.Studies indicated that A.anophagefferens and E. huxleyi employ two main strategies to cope with P deficiency:pro-ducing either more or new phosphate transporters(10,17,51)and regenerating P from dissolved organic phosphorus(DOP),a sig-nificant part of the marine total dissolved P pool(6,24).Alkaline phosphatases(APs)are the key enzymes that marine planktonic microbes produce to hydrolyze orthophosphate from phosphorus ester,the dominant high-molecular-weight DOP class(13,15, 16).Though DIP is the most significant bioavailable P form for living organism in oceans,previous studies have shown that DOP can support the growth of gunensis as the sole P source(34). Nevertheless,the mechanisms of P acquisition in gunensis are largely unknown,and no studies have been conducted to examine the relationship among P acquisition,algal growth,and protein expression in this species.Proteomics,a molecular tool that detects the global protein expression,is suitable for investigating the molecular mechanism of adaption to specific environmental conditions.In marine algae, proteomics has been applied to understand the mechanisms of adaptation to salinity(26,28)and copper(11,42).Successful application of identification-based proteomics heavily depends on a database of gene or protein sequences for homology search. This reliance on the existing genomic database has limited the application of proteomics in many nonmodel marine algae with few genomic resources.However,the recently developed de novo cross-species protein identification strategy has made it possible to conduct proteomic studies in nonmodel species with limited genomic resources(46).This strategy has been successfully ap-plied to a variety of eukaryotic life forms(e.g.,pine[4],gastropod Received6June2011Accepted7January2012Published ahead of print13January2012Address correspondence to Hongbin Liu,liuhb@ust.hk.Supplemental material for this article may be found at /.Copyright©2012,American Society for Microbiology.All Rights Reserved.doi:10.1128/AEM.05755-110099-2240/12/$12.00Applied and Environmental Microbiology p.2025–2025 on June 2, 2013 by Xiamen University / Downloaded from[48],and fungi[9]),but to our knowledge it has been applied to only one eukaryotic alga,Dunaliella salina,before extensive genomic resources were available for this species(28),and in the salinity tolerance study of D.salina,de novo cross-species protein identification strategy resulted in the identification of more than twice as many proteins as the MASCOT method and with higher confidence.Here,we reported a proteomic study of the responses of the ma-rine alga Aureoumbra lagunensis to P-and P-and N-deficient ing de novo cross-species identification,we identified the differentially expressed proteins under P-and N-deficiency.Mean-while,several physiological parameters associated with algal growth under the different nutrient treatments were also measured to pro-vide a better link between algal physiology and proteomics.Enzyme activity assay on gel,ELF-97labeling,and confocal microscopy were employed to characterize a highly abundant,P limitation-specific protein discovered by the proteomic analysis.MATERIALS AND METHODSAlgal culture.Aureoumbra lagunensis was cultured at25°C under coolwhitefluorescent light(140mol quanta mϪ2sϪ1)with a14h:10h light:dark cycle.Three modified f/2media(without silicate and replacingnitrate by ammonium)with autoclavedfiltered seawater pumped fromClear Water Bay,Hong Kong,were used in experiments:(i)ϩNϩP me-dium(200M extra NH4ϩ,20M extra PO43Ϫ);(ii)ϩNϪP medium (200M extra NH4ϩ,no extra PO43Ϫ);and(iii)ϪNϪP medium(40M extra NH4ϩ,no extra PO43Ϫ).TheϩNϩP andϩNϪP treatments repre-sented the nutrient-replete control and the P-depleted condition,respec-tively.To compare the responses between N and P limitation and theeffect of N limitation on P depletion,we added theϪNϪP treatment.Algal cells were collected by centrifugation for10min at4,000ϫg from3liters of culture(ϩNϩP medium)at late exponential phase.After beingwashed with autoclaved seawater,algal cells were resuspended in auto-claved seawater,and the same volume of cell suspension was added intoquadruplicate2-liter glass Erlenmeyerflasks containing1.5liters of ϩNϩP medium,ϩNϪP medium,andϪNϪP medium.Subcultures were taken daily at the same time point for10days and were diluted to105to106cells per ml for cell density measurement by using a Coulter counter(Beckman,California).Algal culture physiology.Intracellular phosphate concentration wasmeasured before the inoculation(initial)and on thefirst5days(exceptfor day2).A subsample of10ml algae was collected from each cultureflask,filtered onto a precombusted Waterman GF/C glassfiberfilter(25mm),and stored atϪ80°C until analysis.The intracellular phosphateconcentration was determined using the method described by Solorzanoand Sharp(47).Thefinal results were normalized by cell volume derivedfrom Coulter counter readings.Phosphate concentrations in algal culturewere also monitored daily by using the Molybdate Blue method(21).Cellular chlorophyll a(Chl a)concentration was determined daily onthefirst5days(except for day2)(8).Briefly,a10-ml subsample from eachflask wasfiltered onto GF/C.Chlorophyll on thefilters was extracted in90%acetone by sonication and overnight incubation atϪ20°C in thedark.In vitrofluorescence of Chl a was determined using a Turner Designsmodel7200fluorometer and calculated and normalized to cellular Chl aconcentration according to a standard curve and cell number.APA.Cellular and soluble alkaline phosphatase activity(APA)wasmeasured daily on thefirst5days(except for day2).For cellular APAmeasurement,a10-ml algal suspension wasfiltered onto a1-m-pore-size polycarbonatefilter(25mm in diameter).Thefilter was immersed in 1ml AP buffer(50ml0.5M CaCl2,100ml0.5M Tris[pH8.0],800ml autoclaved seawater,0.5mM4-methylumberlliferyl phosphate[MUP]) and then incubated at25°C under vibration.To determine the time-dependent changes influorescent product hydrolyzed from MUP by al-kaline phosphatase,50l AP buffer was removed from the mixture at 15-min intervals within1h.After200l0.2M Na2CO3was added and after centrifugation,theflorescence of the supernatant was measured at a 360-nm excitation/460-nm emission immediately with a Wallac Victor3 multilabel counter(Perkin Elmer).For soluble APA measurement,0.5ml of0.22-m-pore-size-filtered algal suspension was added into0.5ml of AP buffer(1mM MUP),and the following measurement was the same as for cellular APA.Cellular APA was determined by measuring the linear increase influorescence versus time,and the enzyme activity was normal-ized to cell number,whereas soluble APA was expressed on a volume basis.Algal protein preparation.Algal cells in1liter of culture were col-lected by centrifugation at4,000ϫg for10min from four biological replicates for three treatments at the late exponential phase(on day5). The algal pellets were washed twice with autoclaved seawater and resus-pended immediately in200l of lysis buffer containing7M urea,2M thiurea,4%CHAPS(3-[(3-cholamidopropyl)-dimethylammonio]-1-propanesulfonate),20mM dithiothreitol(DTT),and2%Bio-Lyte3/10 ampholyte.Samples were frozen in liquid nitrogen and then immediately transferred into a37°C water bath to break the algal cells.After sonication and centrifugation at13,000rpm for20min,the protein in supernatant was purified using a two-dimensional(2D)cleanup kit(Bio-Rad,Hercu-les,CA)and then dissolved in150l of rehydration buffer(7M urea,2M thiourea,2%CHAPS,40mM DTT,0.2%Bio-Lyte3/10ampholyte).2D electrophoresis.Proteins in the purified samples were separated by2D electrophoresis as described by Sun et al.(48).Briefly,0.8mg protein from each biological sample was loaded onto a17-cm immobi-lized pH gradient(IPG)strip(Bio-Rad,Hercules,CA),pH4to7(linear), to allow for a16-h active rehydration,followed by isoelectric focusing (IEF)in a Protean IEF cell at20°C.IPG strips,pH4to7,were used, because a preliminary experiment with pH3to10IPG strips showed that most protein spots were resolved in this pH range.The electrophoresis was run at250V for20min,followed by a linear increase from250to 8,500V in2.5h,and at8,500V for a total of60,000volt hours(Vh).Prior to the second dimensional run,the strips were equilibrated for15min in equilibration buffer I(6M urea,2%SDS,0.05M Tris-HCl,50%glycerol, and2%[wt/vol]DTT)followed by15min in equilibration buffer II(the same buffer as equilibration buffer I but containing2.5%iodoacetamide instead of DTT).The IPG strips were placed on the top of12.5%SDS-PAGE gels(18cm by18cm)and sealed with0.5%[wt/vol]agarose.The second dimension separation was performed with a constant current of16 mA per gel for12h.The gels were stained with colloidal Coomassie G250 solution.Gel image analysis.The2D gels were scanned with a calibrated trans-parency densitometer(GS-800;Bio-Rad,Hercules,CA).Gel images were analyzed using PDQuest version8.0(Bio-Rad,Hercules,CA)and visually confirmed.Total spot densities were normalized across gels.For quanti-tative analysis,spots showing at least a2-fold difference and that had a P value ofϽ0.01in Student’s t test were considered up-or downregulated, and only spots presented in at least3replicates were analyzed.For quali-tative analysis,spots showing at least20-fold changes were considered absent or present.The comparisons were conducted betweenϩNϩP treatment andϩNϪP treatment and between theϩNϪP treatment and ϪNϪP treatment tofind the differentially expressed protein under P and N depletion,respectively.Electrospray ionization(ESI)QqTOF analysis.The most abundant up-or downregulated protein spots were subjected to mass spectrometry analyses.Protein spots were cut from the gels and digested as described by Shevchenko et al.(46).Briefly,the gel pieces were destained with50mM NH4HCO3in50%methanol,washed with Milli-Q water,and then dried with100%acetonitrile(ACN)followed by rehydration with100mM NH4HCO3twice.After adding15l of12.5ng/l sequencing-grade tryp-sin(Promega,Madison,WI)in10mM NH4HCO3and10%ACN,the gel pieces were incubated at37°C overnight.Formic acid(FA;5%)in50% ACN was used to extract peptides from the gel pieces.Extracts were dried with SpeedVac(Thermo Electron,Waltham,MA),dissolved in5%FA,Sun et al. Applied and Environmental Microbiology on June 2, 2013 by Xiamen University / Downloaded fromdesalted with C18ZipTip,and analyzed by using a quadrupole time of flight(QqTOF)mass spectrometer(QSTARXL;Applied Biosystems/ Sciex,Ontario,Canada)equipped with a nanoelectrospray ion source. Peptides withϩ2toϩ3charge states were selected for tandem mass spectrometry(MS/MS).Mass spectrum interpretation.The data were submitted through on-line MASCOT to the NCBI nonredundant database with taxon restriction in Viridiplantae(green plants).Tolerances for precursor and fragment masses were set at0.3Da and0.5Da,respectively.The following param-eters were used in database searching:fixed modification,carbamidom-ethyl(cysteine);variable modification,oxidation(methionine).Up to one missed trypsin cleavage was allowed.Hits were considered significant when at least three peptides of a protein showed MASCOT scores of over 50simultaneously.For the samples that cannot be identified by using MASCOT,auto-mated de novo peptide sequencing was performed using PepNovo as de-scribed by Waridel et al.(50).After manual interpretation of the candidate sequences deduced from PepNovo with the help of the Analyst1.1soft-ware(Applied Biosystems),the peptide sequences from one protein spot were merged and submitted to MS-BLAST at /msblast/(4)for searching against the NCBI nonredundant da-tabase(nrdb95).Hits with a total BLAST score above100or with at least one high-scoring segment pair above60were considered positive.The molecular weight and pI of the matched proteins were deduced by using the ExPASy Proteomics Server().Nondenaturing electrophoresis and APA in gel assay.Whole-cell protein was extracted from the late-exponential culture using a nondena-turing extraction buffer(0.02M Tris[pH8.0],1mM DTT,0.4%Triton X-100).After centrifugation at16,000ϫg for30min,the supernatant was run on a12.5%nondenaturing gel.APA in gel assay was performed with ELF-97(the endogenous phosphatase detection kit;Molecular Probes), which can generatefluorescent precipitation(excitation/emission:345/ 530nm)after AP hydrolysis.Briefly,each gel was soaked in AP buffer (0.02M Tris[pH8.0],0.01M CaCl2,0.1M NaCl)and incubated in20ϫdiluted ELF-97in the dark.After30min,AP buffer was added to stop the reaction.ELF-97fluorescence of the gel was examined with350nm UV excitation,and the emissionfiltered by EtBrfilter was collected.To sepa-rate the subunits of native-labeled protein complex and determine the molecular weight of each subunit,the band labeled by ELF-97was excised and soaked in1%SDS and1%mercaptoethanol for2h.After being rinsed with Milli-Q water,the gel band was loaded on the top of the SDS-PAGE gel and the second dimensional electrophoresis was run.To determine the metal dependence of the AP in gunensis,after running the nondena-turing gel,the gel lanes were sliced and incubated separately in buffers containing metal ions of different concentrations(Ca2ϩ[10mM to0.01 mM],Mg2ϩ[10mM to0.01mM],Zn2ϩ[0.1mM to0.1M],and Co2ϩ[10mM to1M])instead of0.01M CaCl2.Confocal microscopy.The localization of AP in cells was determined under a confocal microscope after labeling with ELF-97.Cells grown un-derϪP conditions andϩP conditions were labeled with ELF-97as de-scribed by González-Gil et al.(20),except for shortening the70%ethanol fixing step to5min.Microscopic slides prepared with5l of labeled cell seawater suspension and5l of mounting medium were observed by using a Leica TCS-SP5spectral laser scanning confocal microscope.To detect theflorescence of ELF-97,a510-to600-nm emission was collected with a DPSS405-nm laser excitation.Images were obtained with aϫ100 magnification,1.4-numerical-aperture oil objective.Correlation between P limitation-specific protein and cellular APA. To confirm the relationship between the appearance of a P limitation-specific protein band on nondenaturing gel and cellular alkaline phospha-tase,gunensis was cultured under P-depleted conditions for5days. Cellular APA and the percentage of ELF-97-labeled cells were measured daily.Algal cells with green ELF-97signal were identified using an Olym-pus BX51microscope with a DAPI(4=,6-diamidino-2-phenylindole) long-passfilter set.At least5views were randomly chosen for each sample,and the numbers of total and ELF-97-labeled cells were both counted. Protein was extracted from algal cells harvested from150ml of culture every day,and the same amount of protein was loaded on a nondenatur-ing gel.RESULTSAlgal growth.Among the three treatments,the two P-depleted treatments(i.e.,ϩNϪP andϪNϪP treatment)showed very sim-ilar growth tendencies with a shorter lag phase and faster growth than the P-replete treatment(i.e.,ϩNϩP treatment)in thefirst2 days.But the P-replete treatment reached to a higherfinal cell concentration than the P-depleted treatments at the stationary phase(Fig.1A).Cellular phosphate concentration.Cellular P concentration in theϩNϩP treatment increased abruptly1day after inoculation to approximatelyfive times the initial cellular P concentration and then gradually decreased to the initial level during the following4 days.For the two P-depleted cultures,the initial DIP of the culture medium was about0.05M and then became undetectable from day1to day5.Cellular P concentration decreased to approxi-mately2/3of the initial level on thefirst day and decreased further for the rest of the experimental period to reach only10%of the initial value in theϪNϪP treatment and7%in theϩNϪP treat-ment on day5(Fig.1B).For each day,one-way analysis of vari-ance(ANOVA)revealed significant treatment effects(PϽ0.01), and the Duncan’s test showed that the P-replete(ϩNϩP)treat-ment had significantly higher cellular P levels than two P-depleted (ϩNϪP andϪNϪP)treatments from day1to day5.Cellular Chl a.Cellular Chl a content in theϩNϩP and ϩNϪP treatments did not show a significant change from day1to day5,but it declined progressively with time in theϪNϪP treat-ment(Fig.1C).One-way ANOVA followed by Duncan’s test showed that the cellular Chl a levels of N-depleted(ϪNϪP)treat-ment were significantly lower than those of the control(ϩNϩP) and P-depleted(ϩNϪP)treatments on day5,which indicated that chlorosis occurred only in the N-depleted treatment.APA.Both cellular and soluble APAs were measured,but sol-uble APA was undetectable throughout the experiment.Cellular APA of the three treatments did not differ significantly in thefirst 3days,and the cellular APA level in theϩNϩP treatment was very low throughout the whole experiment(Fig.1D).On days4and5, the cellular levels of APA in theϩNϪP andϪNϪP treatments were significantly higher than that of theϩNϩP treatment;and on day5,theϩNϪP treatment had significantly higher cellular APA than theϪNϪP treatment(one-way ANOVA,Duncan’s test,PϽ0.01),which indicated a reverse effect of persistent N depletion on APA when P is limited.2D electrophoresis pattern.The2D electrophoresis resolved 262to326spots in each gel(Fig.2).When using theϩNϩP treatment(Fig.2A)as the background,theϩNϪP treatment(Fig. 2B)resulted in18downregulated spots,7upregulated spots,9 absent spots,and9novel spots.When using theϩNϪP treatment as the background,theϪNϪP treatment resulted in5downregu-lated spots,18upregulated spots,7absent spots,and9novel spots.MS analysis and protein identification.Of the38most abun-dant and differentially expressed spots subjected to ESI QqTOF, 22were successfully identified(labeled in Fig.2),of which5were identified by using MASCOT directly and17by de novo sequenc-ing and MS-BLAST similarity database search(see Tables S1and S2in the supplemental material).The differentially expressed pro-Proteomic Profile of gunensis and AP Characterizing2027 on June 2, 2013 by Xiamen University / Downloaded fromteins between theϩNϩP andϩNϪP treatments belonged to six functional assemblages:nucleotide metabolism,amino acid me-tabolism,cellular signaling,oxidative stress defense,utilization of organic phosphorus,and hypothetical protein.The differentially expressed proteins between theϩNϪP andϪNϪP treatments fell intofive functional groups:chlorophyll synthesis,amino acid metabolism,carbohydrate metabolism,oxidative stress defense, stress response,and other functions.Nondenaturing electrophoresis and APA in gel assay.The APA in gel assay revealed a protein band with APA only in theϪPFIG1Changes in physiological parameters of gunensis under three different treatments during experiments.(A)Algal density(cells mlϪ1).Graphs includes positive control(ϩNϩP)( ),P-depleted(ϩNϪP)(Œ),and N-and P-depleted(ϪNϪP)(’)cultures;(B)cellular P content(fmol cellϪ1);(C)cellular Chl aconcentration(pg cellϪ1);(D)cellular alkaline phosphatase activity(APA)(fmol Pi minϪ1cellϪ1).Bars in panels B,C,and D represent positive-control(ϩNϩP) (black bars),P-depleted(ϩNϪP)(white bars),and N-and P-depleted(ϪNϪP)(gray bars)cultures and initial cellular P content at day0(hatched bars). FIG2Representative2D electrophoresis gel images of gunensis under the three nutrient treatments.The successfully identified differentially expressed proteins are labeled on the images.Sun et al. Applied and Environmental Microbiology on June 2, 2013 by Xiamen University / Downloaded fromtreatment(Fig.3A,arrow).This band was excised,and SDS-PAGE was performed without(Fig.3B,ϪP Non)or with(Fig.3B,ϪPD) equilibration in denaturing buffer.The same position of this band in theϩP treatment was also included in Fig.3B(ϩPD)to show the background of the nondenaturing gel.After SDS-PAGE,a pro-tein band of200kDa appeared in theϪP Non lane and a proteinband of approximately100kDa appeared in theϪPD lane(Fig.3B),and100kDa corresponded to the position of the identifiedputative AP on the2D gel.This P limitation-specific band on the ϪPD lane(Fig.3B)was also subjected to the ESI QqTOF.From the MS profile,two peptides with the same peptide mass as spot10(Fig.2)were found.The same peptide sequence derived from denovo sequencing(Fig.4)further confirmed that this P limitation-specific protein band with APA on denaturing gel and spot10(Fig.2)of the2D gel were the same protein.The APA assay in thenondenaturing gel using buffer containing Ca2ϩ,Mg2ϩ,Zn2ϩ,orCo2ϩshowed that this gunensis AP was activated only by Ca2ϩ(Fig.5).Localization of alkaline phosphatase.To further determinethe location of AP,we labeled it with ELF-97and detected thefluorescence of ELF-97by using confocal microscopy.WhenELF-97labeling was applied to gunensis,the detectable punc-tuatefluorescence was specific toϪP-treated algal cells(see Fig.S1in the supplemental material).Confocal images with differentdepths(Fig.6)showed that the labeled AP was cytoplasmic andadjacent to the inner cell membrane.Correlation between P limitation-specific protein and cellu-lar APA.Under P-depleted conditions,cellular APA increasedgradually from day1to day4and reached a plateau afterward,butELF-97-labeled algal cells were detected from day2,with values of59%in day2and65to83%in days3to5.The P limitation-specific protein band also appeared from day2(Fig.7,arrow),corresponding to the increases in the percentage of ELF-labeledcells in the gunensis culture and1day later than the appear-ance of cellular APA.DISCUSSIONOur direct submission of the MS/MS from the38differentiallyexpressed protein spots resulted in the identification of only 5FIG3Characterization of P limitation-specific in gunensis.(A)Nondena-turing gels stained by Coomassie blue and ELF-97.The whole-cell protein samples for nondenaturing electrophoresis came from P-replete culture(ϩP)and P-depleted culture(ϪP).Arrow indicates position of the band used in SDS-PAGE.(B)SDS-PAGE using the band cut from the position indicated by arrow in panel A on the nondenaturing ne M,protein standard;laneϪP Non,band inϪP treatment without equilibration in denaturing buffer(1%SDS,1%mercaptoeth-anol);laneϩPD,band inϩP treatment with equilibration in denaturing buffer; laneϪPD,band inϪP treatment with equilibration in denaturing buffer.FIG4MS/MS spectrum of one peptide from spot10on the2D gel.The peptide sequence FLAFSGGPYLR is derived from de novo peptide sequencing.Peaks corresponding to the y and b ions from this peptide are labeled on the spectrum.This peptide was also found in the MS result of ELF-labeled protein on the nondenaturing gel.Proteomic Profile of gunensis and AP Characterizing 2029 on June 2, 2013 by Xiamen University / Downloaded fromproteins (13%),whereas de novo cross-species identification helped to identify another 17proteins,raising this ratio to 22of 38(58%).The much higher rate of identification demonstrates the usefulness of de novo sequencing and the MS-BLAST similarity database search in proteomic studies of nonmodel marine phyto-plankton.Proteomic profile changes.To understand the differential ef-fects of N and P limitation on algal cell,and the interplay between P and N limitation,we examined the differences between control and nutrient-deficient treatments.Under N-and P-colimited condition (ϪN ϪP treatment),besides the proteins related to the general metabolism,several enzymes evolved in Chl a synthesis (see Table S2in the supplemental material)were downregulated,and an endopeptidase (spot 19)that might play an important role in cellular N recycling through protein decomposition was up-regulated.Specifically,as photosynthetic pigments and protein-rich chloroplast have a high N:P ratio and are a good N storage source in algal cells (1,3),the degradation of chloroplast proteins and a decline in cellular pigment content has been observed widely in N-limited marine algae (5,18,51).As damaging the photosyn-thetic system and interrupting the function of the electron trans-port chain will increase the amount of electrons accepted by O 2(35),the decomposing of pigments and photosynthesis proteins under N-deficient conditions may lead to an increase in reactive oxygen species (ROS).Though under both ϩN ϪP and ϪN ϪP treatments typical antioxidative enzymes,such as manganese su-peroxide dismutase (SOD)(spot 7),glutathione S -transferase (GST)(spot 6),and mutator mutT related to repairing oxidatively damaged DNA (31),were upregulated (see Tables S1and S2in the supplemental material),the upregulation level of SOD was much higher in ϪN ϪP treatment than in ϩN ϪP treatment.In addi-tion,ATP synthase gamma subunit (spot 21)and beta subunit (spot 22)were only greatly upregulated in the ϪN ϪP treatment.Since superoxide anion radical has been reported to greatly dam-age ATP synthase (7),the increase in ATP synthase indicated that algal cells may accumulate more ROS in ϪN ϪP treatment than in ϩN ϪP treatment.The overexpression of antioxidative enzymes may endow gunensis cells with the ability to limit oxidative damage,protect the photosynthesis apparatus,and adjust the cel-lular redox state (36).In the proteomic profile of the ϩN ϪP treatment,40S ribo-somal protein-like protein (spot 1)was downregulated 2.3-fold,and a protein identified as a putative alkaline phosphatase (AP)(spot 10)was novel compared to the nutrient-replete control.Ri-bosomal protein was reported to respond to P depletion under the control of the P metabolic regulation system (PhoBR)in the ma-rine cyanobacteria Synechococcus (38),and the downregulation of ribosomal protein on transcriptional level in ϪP treatment was also reported in a study of the coccolithophore E.huxleyi (17).As P-rich ribosome is a significant intracellular P reservoir inside the cell (3),the downregulation of ribosomal protein in the ϩN ϪP treatment might facilitate the intracellular P recycling in -gunensis .Besides the intracellular nutrient retrieval migration strategy,enzymes such as AP might provide a means to access the extracellular DOP pool to increase P availability in gunensis .Studies at the RNA level (17,51)and protein level (53)confirmed that the DOP scavenging enzymes can be induced under P limita-tion in marine eukaryotic algae.In our study,one putative alkaline phosphatase was identified,and its upregulation in gunensis under P limitation was also confirmed by the cellularalkalineFIG 5Cofactor characterization of AP.APA assay on nondenaturing gel with buffer containing Ca 2ϩ,Mg 2ϩ,Zn 2ϩ,and Co 2ϩof different concentrations and buffer containing 10mM Ca 2ϩ,0.1mM Mg 2ϩ,0.7M Zn 2ϩ,and 0.1M Co 2ϩas the control (ϩ).FIG 6Confocal images with depths,showing intracellular labeling of AP with ELF-97.Images were taken with an interval of 1.09m along the z axis.The upper series of images show the green florescence emitted by ELF-97,and the bottom series of images show the shape of algal cell.Sun et al. Applied and Environmental Microbiologyon June 2, 2013 by Xiamen University/Downloaded from。
Metal Corrosion
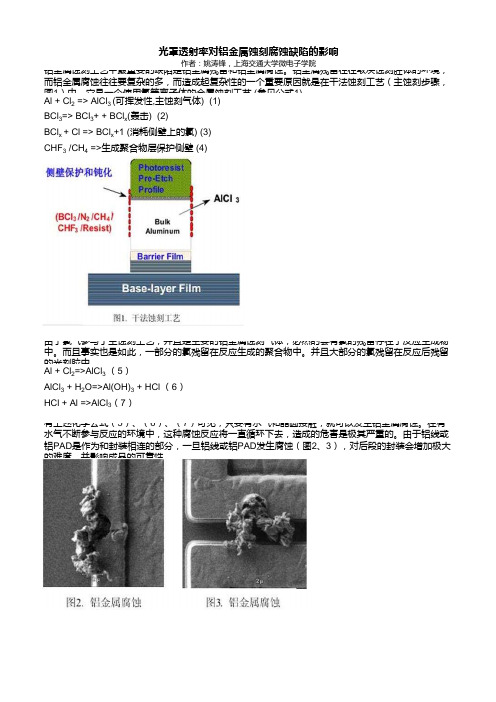
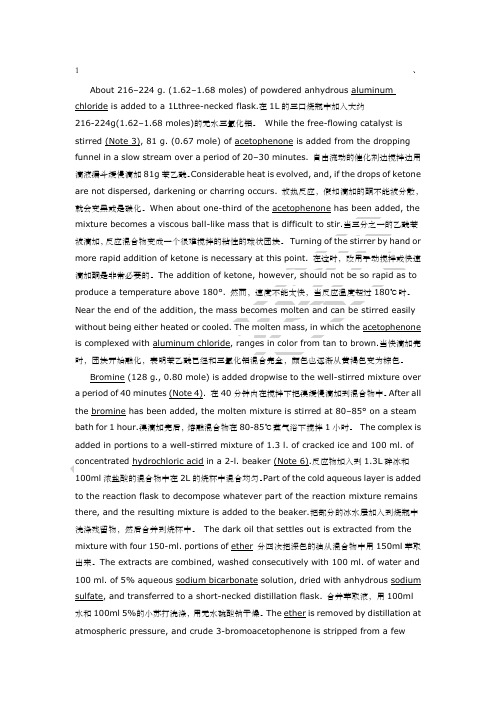
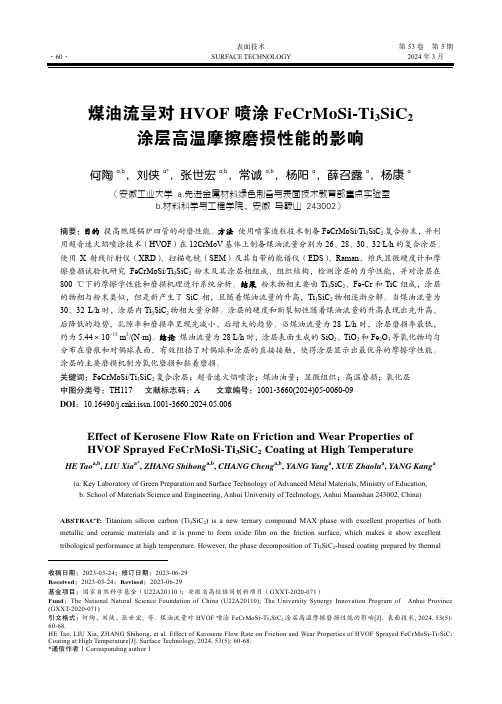
光罩透射率对铝金属蚀刻腐蚀缺陷的影响 铝金属蚀刻工艺中最重要的缺陷是作铝者金:属姚残涛锋留,和上铝海金交属通大腐学蚀微。电铝子学金院属残留往往取决蚀刻腔体的环境, 而铝金属腐蚀往往要复杂的多,而造成起复杂性的一个重要原因就是在干法蚀刻工艺(主蚀刻步骤, 图1)中,它是一个使用氯等离子体的金属蚀刻工艺 (参见公式1) 。 Al + Cl2 => AlCl3 (可挥发性,主蚀刻气体) (1) BCl3=> BCl3+ + BClx(轰击) (2) BClx + Cl => BClx+1 (消耗侧壁上的氯) (3) CHF3 /CH4 =>生成聚合物层保护侧壁 (4)
药物合成反应闻韧_第三版课后翻译
1、About 216–224 g. (1.62–1.68 moles) of powdered anhydrous aluminum chloride is added to a 1Lthree-necked flask.在1L的三口烧瓶中加入大约216-224g(1.62–1.68 moles)的无水三氯化铝。
While the free-flowing catalyst is stirred (Note 3), 81 g. (0.67 mole) of acetophenone is added from the dropping funnel in a slow stream over a period of 20–30 minutes. 自由流动的催化剂边搅拌边用滴液漏斗缓慢滴加81g苯乙酰。
Considerable heat is evolved, and, if the drops of ketone are not dispersed, darkening or charring occurs. 放热反应,假如滴加的酮不能被分散,就会变黑或是碳化。
When about one-third of the acetophenone has been added, the mixture becomes a viscous ball-like mass that is difficult to stir.当三分之一的乙酰苯被滴加,反应混合物变成一个很难搅拌的粘性的球状团块。
Turning of the stirrer by hand or more rapid addition of ketone is necessary at this point. 在这时,改用手动搅拌或快速滴加酮是非常必要的。
The addition of ketone, however, should not be so rapid as to produce a temperature above 180°. 然而,速度不能太快,当反应温度超过180℃时。
cyp2e1固有活性与二乙基亚硝胺所致大鼠肝纤维化的相关性

CYP2E1固有活性与二乙基亚硝胺所致大鼠肝纤维化的相关性研究生:王钊导师:乔海灵河南郑州 450001摘要肝纤维化是肝脏纤维结缔组织异常增殖和积累的病理状况,是慢性肝病发展到肝癌的必经阶段。
肝癌是一种常见的恶性肿瘤,严重威胁着人类的生命安全。
肝癌形成过程复杂,流行病学研究表明亚硝胺、乙肝病毒、黄曲霉毒素、酒精损伤、家族遗传病等都是诱发肝癌的因素。
二乙基亚硝胺是亚硝胺家族的典型代表,对人与动物都具有致癌作用。
二乙基亚硝胺是前致癌物,经CYP2E1代谢产生乙醛与烷基化产物,产物与DNA 加合诱导基因突变,造成肝脏损伤。
本研究室前期研究发现,肝癌患者肝纤维化组织CYP2E1活性显著升高。
推测CYP2E1活性升高可能与肝纤维化的形成有关,这在已有的研究中未见报道,故我们希望通过建立肝纤维化大鼠模型来探究CYP2E1活性与大鼠肝纤维化的关系。
本研究拟建立肝纤维化大鼠模型,通过分析二乙基亚硝胺在大鼠体内的毒代动力学参数与肝纤维化评分及肝纤维化程度指标的相关性,以探明CYP2E1固有活性与二乙基亚硝胺所致大鼠肝纤维化的相关性。
1 方法1.1 建立大鼠肝纤维化模型1.1.1 实验动物取约六周龄,体重170±10 g的健康雄性SD大鼠30只,饲养一周,以适应新环境。
将大鼠随机分组,空白对照组10只、模型组20只。
1.1.2 给药方案前4周大鼠腹腔注射二乙基亚硝胺50 mg/kg,每周2次,5~12周改为每周1次,对照组大鼠注射相同体积的生理盐水,在12周处死全部大鼠。
1.1.3 肝纤维化相关指标的测定采用试剂盒测定大鼠血浆中谷草转氨酶,谷丙转氨酶的含量,采用免疫组化的方法测定增殖细胞核抗原阳性率,抗原Ki67阳性率以及胎盘型谷胱甘肽硫转移酶光密度值。
1.1.4 肝纤维化评分采用HE和Masson染色法对肝脏切片进行染色,根据Ishak评分法对病理结果进行评分,将肝纤维化严重程度分为0~6分。
1.2 大鼠二乙基亚硝胺毒代动力学大鼠腹腔注射50 mg/kg二乙基亚硝胺前采空白血样,注射后于1、4、10、25 min及1、2.5、4.5、7、10、24 h眼眶采血,分离血浆保存待测,血样中二乙基亚硝胺浓度采用HPLC-UV法进行检测。
小学上册第十四次英语第一单元测验卷

小学上册英语第一单元测验卷英语试题一、综合题(本题有100小题,每小题1分,共100分.每小题不选、错误,均不给分)1.What do we call the device used to measure time?A. ClockB. CalendarC. TimerD. StopwatchA2.The animals are ______ in the zoo. (playing)3.My favorite game is ________ (拼图).4.What is the main diet of omnivores?A. PlantsB. MeatC. Both plants and meatD. FruitsC5.The __________ (印刷术) was invented by Johannes Gutenberg in the 15th century.6. A _____ (小鸭) has fluffy yellow feathers.7.Which gas do plants absorb from the atmosphere?A. OxygenB. HydrogenC. Carbon DioxideD. Nitrogen8.The butterfly flutters _______ (轻盈) through the air.9.She has a _____ backpack. (red)10.How many legs does an insect have?A. 4B. 6C. 8D. 10答案:B11.The __________ is the center of the earth.12.What do you call the process of a caterpillar becoming a butterfly?A. MetamorphosisB. EvolutionC. AdaptationD. Transformation13.The __________ (古巴) missile crisis occurred in 1962.14.The Earth’s rotation affects ocean ______ and weather patterns.15.What is the capital of Thailand?A. BangkokB. JakartaC. Kuala LumpurD. ManilaA16.What is the name of the famous American author who wrote "The Great Gatsby"?A. F. Scott FitzgeraldB. Ernest HemingwayC. Mark TwainD. John SteinbeckA17.I see a __ in the park. (cat)18.__________ are used in the manufacture of plastics.19.What is the color of the sky on a clear day?A. BlueB. GreenC. RedD. Yellow20. A sloth moves very _______ (慢), hanging from trees.21.The fire is _____ (hot/cold).22.What is the color of a typical snowman?A. WhiteB. BlueC. GreenD. PinkA23.Certain plants provide ______ (天然栖息地) for wildlife.24.What do you call the area of land that has trees and wildlife?A. ForestB. ParkC. ReservationD. JungleA25.What do you call a collection of books?A. LibraryB. ShelfC. GalleryD. Office26.I enjoy going to the ______ (咖啡馆) with my friends to chat and relax. It’s a cozy place.27. A fish can breathe underwater with its ______ (鳃).28.I love to visit ______ (自然保护区) to learn about wildlife and conservation efforts. It’s important to protect our planet.29.What is the capital of the Netherlands?A. AmsterdamB. RotterdamC. UtrechtD. The HagueA30.What do we call a young goat?A. CalfB. KidC. LambD. FoalB31.The dog is ________ in the yard.32.The ______ (老虎) is fierce and majestic.33.We can _______ (一起学习) for the exam.34.n Wall fell in ________. The Berl35. A force can change the _______ of an object.36.The chemical formula for hydrogen peroxide is _____.37.小海豚) plays with the waves. The ___38.Which fruit is red?A. BananaB. CherryC. OrangeD. Kiwi39.I can _____ (dance/sing) very well.40. A _______ is a chemical process that produces nutrients.41.What is the color of a bluebird?A. RedB. GreenC. BlueD. YellowC42.Photosynthesis converts sunlight into ______ energy.43.I like to ride my ______ (自行车) through the neighborhood with my friends.44. A ______ is a type of energy associated with moving objects.45.She wears a __________ to school.46. A starfish has five ______ (手臂).47. D.TwelveWhich animal is known as "man's best friend"?A. CatB. DogC. Rabbit48. A ________ (壁虎) can climb walls and is often found in houses.49.My friend is always __________ (支持我的).50.I wear a ___ (hat/scarf) in winter.51.The process of breaking down food into simpler substances is called _______.52.The chemical formula for zinc oxide is __________.53.The goldfinch is a small, yellow _________ (鸟).54.What do we call the process of a caterpillar turning into a butterfly?A. MetamorphosisB. EvolutionC. TransformationD. DevelopmentA55.I love to make __________ when it snows. (雪人)56.What do you call an animal that eats only plants?A. CarnivoreB. HerbivoreC. OmnivoreD. InsectivoreB57.carbon capture technology) helps reduce emissions. The ____58. A ________ (植物分布) varies by region.59.My favorite vegetable is a _______ (我最喜欢的蔬菜是_______).60.What do you call the sound made by a sheep?A. MooB. BaaC. QuackD. Bark61.The capital of the Netherlands is __________.62.Which animal says "meow"?A. DogB. CatC. CowD. PigB63.I like to spend time in the ______ (图书馆) because it’s quiet and filled with amazing books.64.The owl can turn its head _________. (很远)65.I love to ___ (draw/write) pictures.66.The puppy is _____ in the yard. (playing)67. A hedgehog rolls into a ball for ______.68.What do we call a scientist who studies marine life?A. Marine biologistB. OceanographerC. Aquatic ecologistD. IchthyologistA69.What is the largest organ in the human body?A. HeartB. LiverC. SkinD. LungsC70.The capital of Malaysia is ________ (吉隆坡).71. A black hole is formed when a massive star ______.72.Penguins are birds that cannot ______.73.What is the capital of Antigua and Barbuda?A. St. John'sB. BarbudaC. FalmouthD. English HarbourA74.I want to ___ a story. (tell)75.The Earth's surface is shaped by both natural and ______ influences.76.The chemical formula for potassium phosphate is __________.77.The athlete is very _____ (勤奋) and practices every day.78.It is _______ to be kind to others.79. A saturated solution can be made by adding more ______.80.The _______ (小漁) glides through the water.81.The _____ (海鸥) flies over the beach, looking for fish. 海鸥在海滩上空飞翔,寻找鱼。
最新沙林、维埃克斯、塔崩、梭曼

沙林(Sarin)、维埃克斯(VX)、塔崩(T abun)、梭曼(Soman)沙林(Sarin)学名:甲氟膦酸异丙酯化学式:(CH3)2CHOOPF(CH3)常温状态:纯品为无色水样液体。
颜色:工业品呈淡黄或黄棕色。
气味:纯的沙林无味,含杂质的沙林有苹果香味。
溶解度:可与水及多种有机溶剂互溶。
水解作用:慢,生成HF和无毒残留物,加碱和煮沸加快水解。
战争使用状态:蒸气态或气液滴态。
其他性状:易挥发,靠自然蒸发就可以达到战斗浓度;150℃以上会明显分解。
化学合成:甲基氧二氯化磷与氟化氢反应,得甲基氧二氟化磷,与甲基氧二氯化磷及异丙醇反应,即得沙林甲基氧二氯化磷(三氯化磷与甲醇反应,得亚磷酸二甲酯,加热,得甲磷酸一甲酯,与三氯化磷及氯气反应得)甲醇可以轻松买到.三氯化磷(过量的磷与氯气反应,可得液态三氯化磷,2P+3Cl2(少量)=2PCl3,避免与水接触.因为三氯化磷遇水强烈水解,PCl3+3H2O=H3PO3+3HCl )氟化氢(用氟化钙加浓硫酸加热,生成氟化氢。
CaF2+H2SO4(浓)====CaSO4+2HF(g) 反应在铜容器中进行,用铅容器接收。
)异丙醇(先用 90 ~ 95% 硫酸吸收丙烯 CH3CHCH2( 从热裂石油气分出 ) ,继加水分解异丙基硫酸,再用蒸馏法蒸出异丙醇。
)还是做氯气方便点儿,把84消毒液和洁厕灵混合在一起,几分钟就搞定反应的化学方程式为:2HCl+NaClO==NaCl+Cl2+H2O背景:1938年,德国的施拉德、安布罗斯、吕第格、范·德尔·林德首次研制成功,那时沙林仅是生产杀虫剂的副产品,这种毒剂就是以上述4个人的姓中的5个字母命名为“沙林”(Sarin)。
德国人很快发现这种毒气的军事价值,并投入生产,但是二战期间并未使用。
在1944年帝国黄昏时,戈培尔等人极力鼓动元首对盟军军队使用沙林毒气。
但幸好帝国的大多数高官头脑还很清醒,他们明白盟军生产沙林的能力远远大过己方,于是直到二战结束,背了6年防毒面具到投降的德军士兵都没有使用过沙林毒气。
煤油流量对HVOF_喷涂FeCrMoSi-Ti3SiC2_涂层高温摩擦磨损性能的影响
表面技术第53卷第5期煤油流量对HVOF喷涂FeCrMoSi-Ti3SiC2涂层高温摩擦磨损性能的影响何陶a,b,刘侠a*,张世宏a,b,常诚a,b,杨阳a,薛召露a,杨康a(安徽工业大学 a.先进金属材料绿色制备与表面技术教育部重点实验室b.材料科学与工程学院,安徽 马鞍山 243002)摘要:目的提高燃煤锅炉四管的耐磨性能。
方法使用喷雾造粒技术制备FeCrMoSi/Ti3SiC2复合粉末,并利用超音速火焰喷涂技术(HVOF)在12CrMoV基体上制备煤油流量分别为26、28、30、32 L/h的复合涂层。
使用X射线衍射仪(XRD)、扫描电镜(SEM)及其自带的能谱仪(EDS)、Raman、维氏显微硬度计和摩擦磨损试验机研究FeCrMoSi/Ti3SiC2粉末及其涂层相组成、组织结构,检测涂层的力学性能,并对涂层在800 ℃下的摩擦学性能和磨损机理进行系统分析。
结果粉末物相主要由Ti3SiC2、Fe-Cr和TiC组成,涂层的物相与粉末类似,但是新产生了SiC相,且随着煤油流量的升高,Ti3SiC2物相逐渐分解。
当煤油流量为30、32 L/h时,涂层内Ti3SiC2物相大量分解。
涂层的硬度和断裂韧性随着煤油流量的升高表现出先升高、后降低的趋势,孔隙率和磨损率呈现先减小、后增大的趋势。
当煤油流量为28 L/h时,涂层磨损率最低,约为5.44 ⨯ 10-15 m3/(N·m)。
结论煤油流量为28 L/h时,涂层表面生成的SiO2、TiO2和Fe2O3等氧化物均匀分布在磨痕和对偶球表面,有效阻挡了对偶球和涂层的直接接触,使得涂层显示出最优异的摩擦学性能。
涂层的主要磨损机制为氧化磨损和黏着磨损。
关键词:FeCrMoSi/Ti3SiC2复合涂层;超音速火焰喷涂;煤油油量;显微组织;高温磨损;氧化层中图分类号:TH117 文献标志码:A 文章编号:1001-3660(2024)05-0060-09DOI:10.16490/ki.issn.1001-3660.2024.05.006Effect of Kerosene Flow Rate on Friction and Wear Properties ofHVOF Sprayed FeCrMoSi-Ti3SiC2 Coating at High Temperature HE Tao a,b, LIU Xia a*, ZHANG Shihong a,b, CHANG Cheng a,b, YANG Yang a, XUE Zhaolu a, YANG Kang a(a. Key Laboratory of Green Preparation and Surface Technology of Advanced Metal Materials, Ministry of Education,b. School of Materials Science and Engineering, Anhui University of Technology, Anhui Maanshan 243002, China)ABSTRACT: Titanium silicon carbon (Ti3SiC2) is a new ternary compound MAX phase with excellent properties of both metallic and ceramic materials and it is prone to form oxide film on the friction surface, which makes it show excellent tribological performance at high temperature. However, the phase decomposition of Ti3SiC2-based coating prepared by thermal收稿日期:2023-03-24;修订日期:2023-06-29Received:2023-03-24;Revised:2023-06-29基金项目:国家自然科学基金(U22A20110);安徽省高校协同创新项目(GXXT-2020-071)Fund:The National Natural Science Foundation of China (U22A20110); The University Synergy Innovation Program of Anhui Province (GXXT-2020-071)引文格式:何陶,刘侠,张世宏, 等. 煤油流量对HVOF喷涂FeCrMoSi-Ti3SiC2涂层高温摩擦磨损性能的影响[J]. 表面技术, 2024, 53(5): 60-68.HE Tao, LIU Xia, ZHANG Shihong, et al. Effect of Kerosene Flow Rate on Friction and Wear Properties of HVOF Sprayed FeCrMoSi-Ti3SiC2 Coating at High Temperature[J]. Surface Technology, 2024, 53(5): 60-68.*通信作者(Corresponding author)第53卷第5期何陶,等:煤油流量对HVOF喷涂FeCrMoSi-Ti3SiC2涂层高温摩擦磨损性能的影响·61·spraying technology is easy to occur, which affects its performance and restricts its wide application in high temperature protection filed. The work aims to individually granulate Ti3SiC2 powder by spray granulation technique, and then investigate the effect of different kerosene flow rates on the coating phase structure and tribological properties at high temperature.Ti3SiC2 particles were ground by a vertical planetary ball mill and mixed with quantitative deionized water and binder to obtain Ti3SiC2 water-based slurry, and then spherical Ti3SiC2 powder was prepared by spray granulation technique. The 12CrMoV matrix square sample with the size of 20 mm × 20 mm × 5 mm was prepared by electric discharge wire cutting mechanism. Before spraying experiment, the matrix sample was roughened by sand blasting and cleaned by ultrasonic with alcohol. The composite coatings with kerosene flow rates of 26 L/h, 28 L/h, 30 L/h and 32 L/h were prepared on 12CrMoV matrix by supersonic flame spraying (HVOF) technology. The phase composition, microstructure of powder and coating were investigated with X-ray diffractometer (XRD), scanning electron microscope (SEM), energy spectrometer (EDS) and Raman spectrum. Vickers microhardness tester and high temperature friction wear testing machine were applied to test the mechanical properties and the tribological properties. Finally, the wear mechanism of the coating at 800 ℃ was analyzed.The results indicated that the powder phase was mainly composed of Ti3SiC2, Fe-Cr and TiC. The coating phase was similar to that of the powder, but a new SiC phase appeared. With the increase of kerosene flow, the Ti3SiC2 phase was gradually decomposed. When the kerosene flow was 30 L/h and 32 L/h, the Ti3SiC2 phase in the coating was decomposed a lot. The average microhardness of K-26, K-28, K-30 and K-32 coatings was 359HV0.3, 528HV0.3, 548HV0.3 and 485HV0.3, the fracture toughness was 3.75, 3.94, 4.65 and 3.95 MPa·m1/2, and the mean friction coefficient was 0.48, 0.45, 0.59 and 0.52, respectively. The hardness, fracture toughness and average friction coefficient of the four coatings all increased firstly and then decreased with the increase of kerosene flow. The porosity of coatings K-26, K-28, K-30 and K-32 was 1.03, 0.44, 0.31 and1.62, and the wear rates was 6.17⨯10-15, 5.44⨯10-15, 8.62⨯10-15 and 6.79⨯10-15 m3/(N·m), respectively. The porosity and wearrate of the four coatings decreased firstly and then increased with the increase of kerosene flow. In summary, when the kerosene flow rate was 28 L/h, the coating had higher MAX content, higher hardness and lower porosity, which ultimately resulted in the lowest coefficient of friction and wear rate.The K-28 coating retains a high content of MAX phase, and the oxides such as SiO2, TiO2 and Fe2O3 generated on the surface are evenly distributed on the surface of the wear scars and dual ball, effectively blocking the direct contact between the dual ball and the coating, which makes the coating show the most excellent tribological performance.KEY WORDS: FeCrMoSi/Ti3SiC2 composite coating; supersonic flame spraying; kerosene flow rate; microstructure; high temperature friction and wear; oxide layer目前我国发电方式仍以火力发电为主,但电站燃煤锅炉的高温防护问题一直是长期困扰行业的技术难题。
- 1、下载文档前请自行甄别文档内容的完整性,平台不提供额外的编辑、内容补充、找答案等附加服务。
- 2、"仅部分预览"的文档,不可在线预览部分如存在完整性等问题,可反馈申请退款(可完整预览的文档不适用该条件!)。
- 3、如文档侵犯您的权益,请联系客服反馈,我们会尽快为您处理(人工客服工作时间:9:00-18:30)。
HVOF sprayed Al –Cu –Cr quasicrystalline coatings from coarse feedstock powdersYingqing Fu ⁎,Tianxiang Peng,Deming Yang,Chengqi Sun,Yuzhen Chen,Yang GaoDepartment of Materials Science and Engineering,Dalian Maritime University,Dalian 116026,Chinaa b s t r a c ta r t i c l e i n f o Article history:Received 25October 2013Accepted in revised form 5May 2014Available online 10May 2014Keywords:HVOF thermal spray QuasicrystalParticle breakage MicrostructureAl –Cu –Cr quasicrystalline (QC)coatings were prepared from coarse feedstock powders by a high velocity oxy-fuel (HVOF)system DJ2700.The contrast experiments were performed by low power atmospheric plasma spray (LPAPS)using the same Al 65Cu 20Cr 15QC powders,and by HVOF spraying Cu180powders with the size of 44–61μm.The phase composition,microstructure and microhardness properties of the QC coatings were investigated.XRD results showed that the feedstock and coatings contained a predominant phase,icosahedral quasicrystal (IQC)I-Al 65Cu 24Cr 11,and three minor crystalline phases:α-Al 69Cu 18Cr 13,θ-Al 13Cr 2(i.e.Al 83Cu 4Cr 13)and ε-Al 2Cu 3.A qualitative analysis on the XRD patterns indicated that,a HVOF-sprayed coating contained more IQC and fewer crystalline phases in the one deposited by LPAPS.Moreover,the higher the input heat energy,the fewer IQC and the more crystalline phase the coating contained,for not only HVOF but also LPAPS.As con firmed by experimental results,when the HVOF-sprayed QC particle impacted onto the substrate surface,the unmelted solid part of particle broke up,and the previously deposited coating portion was deformed and densi fied and even cracked by impingement of the in-flight particles with high velocity;which mini fied splats and densi fied the as-sprayed coating.Thus,the HVOF-sprayed coatings from such coarse (61–74μm)QC powders had much smaller splats and much denser microstructures with lower porosity and higher microhardness,compared with those deposited by LPAPS using the same feedstock,although the preferential particle size of feedstock powders for HVOF spraying is conventionally 5–45μm.Furthermore,based on the contrast experimental results,the necessary and suf ficient conditions for occurrence of the particle impact breakage behavior in the thermal spray process are:(1)the high brittleness of feedstock and (2)the high velocity and low melting degree of spray particles,respectively.©2014Elsevier B.V.All rights reserved.1.IntroductionSince being firstly reported in 1984[1,2],quasicrystalline (QC)materials have become the subject of intense study due to their excep-tional structure and properties [3–9].After 30years of quasicrystal studies,the focus of research is currently shifting closer to the reality;much interest is nowadays concentrated on finding practical production techniques and applications for these materials.The established technology of aluminum fabrication makes the Al-based QC alloys more attractive than many other quasicrystalline alloys [10].However,because quasicrystals are brittle in bulk at ambient temperature,most proposed applications employ QC films/coatings [4–6].Depositing QC coatings onto metallic substrates allows the advantages of QC alloys,such as their surface properties,to be emphasized,while their dis-advantages,such as room-temperature brittleness,can be compensated for by the substrate materials.Various techniques are available for QC coating production,such as magnetron sputtering [11],simultaneous vapor deposition [12],laserablation [13],ion-beam mixing [14],ion implantation [15],and thermal spraying [16–21].Compared with the other techniques,thermal spraying is more versatile in industrialized QC coating production,with a more extensive adaptability;and the coating fabricated by these techniques is more robust [22]and wear-resistant than the one by the others.Moreover,a commercial application of QC coating has emerged,and the product is a cookware surface coating named Cybernox®,deposited by thermal spraying techniques [20].Thermal spraying techniques are divided,according to the way the energy or heat is provided to melt the material or give it enough plasticity,to allow the formation of the coatings [23].They usually include flame spraying,high velocity oxy-fuel (HVOF)spraying,deto-nation spraying,wire arc spraying,plasma spraying and so on.Widely used for many industrial applications,HVOF spraying is probably the best among the thermal spray techniques for some speci fic needs [24].It has been well understood that the highest particle velocity can be achieved by spray particles with heat source of the highest velocity;and the highest particle temperature is associated with heat source of the highest temperature [25,26].Because the maximum temperature of plasma jet reaches over 10,000K [27],spray particles can be heated to a high temperature by plasma jet with a medium velocity.AlthoughSurface &Coatings Technology 252(2014)29–34⁎Corresponding author.Tel.:+8641184723586;fax:+8641184729611.E-mail addresses:yingqing_fu@ ,fuyingqing@ (Y.Fu)./10.1016/j.surfcoat.2014.05.0030257-8972/©2014Elsevier B.V.All rightsreserved.Contents lists available at ScienceDirectSurface &Coatings Technologyj ou r n a l h o m e p a ge :w ww.e l s e v i e r.c o m /l oc a t e /s u r f c oa tHVOF is characterized by high velocity and low flame temperature [27],the flame temperature is signi ficantly in fluenced by the type of fuel gas and flame conditions.As shown in [28],the HVOF flame temperature using propane as fuel could reach to over 3100K,and the spray particle velocity in it ranged from 300to 1200m/s [29].HVOF-sprayed coatings are commonly thick and dense with less oxidation [25,26],and typically with reduced changes in phase composition,compared with atmospheric plasma-sprayed ones [30].Due to the above-mentioned features,HVOF spraying is advantageous for the fabrication of QC coatings,and develop-ing HVOF-sprayed QC coatings for industrial applications may be inter-esting and valuable.It can be recognized that the heating and accelerating rates of spray particles increase with decreasing particle size [31].It has also been found that the oxygen content in HVOF-sprayed alloy coatings increases in an exponential fashion with the decrease of spray particle size,and the oxidation of spray alloy particles becomes remarkably severe when the particle size is smaller than 45μm [32].Thus,in the current study,the Al 65Cu 20Cr 15QC powders with a size distribution ranged from 61to 74μm,were chosen as feedstock,although the preferentialparticle size of feedstock powders for HVOF spraying is conventionally 5–45μm [26].Such coarse powders,which reduced the vaporization of aluminum and oxidation of spray particles to facilitate the formation of Al-based QC phases,were HVOF and low power atmospheric plasma [33–37]sprayed respectively.Another finer feedstock,the Cu180powder with the size of 44–61μm,was HVOF-sprayed using identical process parameters.Based on the contrast experiments,the breakage behavior of HVOF-sprayed QC particles after impacting onto the AISI 1045steel substrate was examined.The in fluences of spray particle impact breakage on the coating microstructure,the necessary and suf ficient conditions for its occurrence in the thermal spray process,were clari fied respectively in this paper (which is extremely different from the previous paper [36]).Furthermore,no study on the impact breakage of HVOF-sprayed QC particles has been reported.2.Experimental details2.1.Spraying materials and processScanning electron microscope (SEM)micrographs of the feedstock powders are shown in Fig.1.The spherical QC powders (Fig.1a),pro-duced by gas atomization of a liquid melt with a nominal composition of Al 65Cu 20Cr 15[36–38],had the size ranged from 61to 74μm.Another water atomized feedstock,Cu180powders (Fig.1b)for the contrast experiment with the size of 44–61μm,had a nominal composition of Cu –5wt.%Ni –10wt.%Al.Both the feedstocks were thermally sprayed onto the previously grit-blasted AISI 1045steel substrates respectively,with an oxygen –propane HVOF torch DJ2700(Diamond Jet 2700-hybrid,Sulzer Metco,Westbury,NY,USA),and the HVOF spray para-meters are presented in Table 1.The low power atmospheric plasma spray (LPAPS)parameters of the same Al 65Cu 20Cr 15QC powders have been reported in a previous paper [36].The reaction equation of the complete combustion of propane is as follows:C 3H 8þ5O 2¼4H 2O þ3CO 2:ð1ÞAccording to this equation,the stoichiometric propane –oxygen ratio is 1/5=0.2,where the flame enthalpy is maximum.Two spray condi-tions,reducing (R)and oxidizing (O),were used.Reducing condition was propane rich and oxidizing was oxygen rich.Since 20%oxygen is present in the high-pressure air used to transport the feedstock pow-ders,the fuel-oxygen ratios of the reducing and oxidizing flame were set at 0.204and 0.196respectively,as listed in Table 1.The thickness of the as-sprayed coatings ranged from 200to 900μposition and structure examinationX-ray diffraction (XRD)was done using an X-ray diffractometer (Rigaku D/MAX-Ultima+/PC)with a Cu anode (λ=0.15406nm).A Philips XL30scanning electron microscope (SEM)was used to charac-terize the topographic morphologies of the feedstock and coatings,and the Al and O contents in the coatings were estimated by its energy dispersive X-ray spectroscopy (EDS).The coating cross sections were observed and photographed by an Olympus GX51F computerized light microscope,whose Olycia M3software was used to evaluate the coating porosity.A MH-6hardness tester was used to measuretheFig.1.SEM micrographs of Al 65Cu 20Cr 15QC (a)and Cu180(b)feedstock powders.Table 1High velocity oxy-fuel spray parameters.Coating code Powder Particle size (μm)Feed rate (g/min)Compressed air flow (L/min)Propane flow (L/min)Oxygen flow (L/min)Fuel –oxygen ratio Spray distance (mm)HF1(R)Al 65Cu 20Cr 1561–7410256532080.204180HF2(O)Al 65Cu 20Cr 1561–7410262582430.196180HF3(O)Cu18044–6132262582430.19618030Y.Fu et al./Surface &Coatings Technology 252(2014)29–34microhardness at a load of100g and a dwell time of5s,and Vickers in-dentation marks were performed on10different locations for each sample.3.Results and discussion3.1.Phase compositionThere are two types of QC phases in Al–Cu–Cr system,icosahedral quasicrystal(IQC)and decagonal quasicrystal(DQC).IQC forms in rapidly solidified alloys with a nominal composition of Al65Cu20Cr15 [38–40].Simple cubic Al65Cu24Cr11IQC and face-centered cubic Al69 Cu21Cr10IQC were observed in[38].DQCs with two different perio-dicities along the tenfold axis,1.24and3.72nm were found in rapidly solidified Al67Cu18Cr15[41].The DQC composition in[42,43]varies in the range of71–73at.%Al,11–12at.%Cu and15–18at.%Cr,and differs from that in Al70.5Cu18Cr11.5[44],Al71.4Cu19.2Cr9.4[45]and Al78Cu10Cr12 [38].Friedel[46]pointed out that the QC and approximant phases are Hume-Rothery phases,so they arise preferentially in the characteristic ranges of the valence concentration e/a,known as the Hume-Rothery rule[44–46].Although the DQCs mentioned above form over a wide compositional range,they exist on or near to a line at constant valence concentration e/a=2.09,called the“decagonal QC line”in the Al–Cu–Cr composition–structure diagram[38,39].Similarly,Al–Cu–Cr IQCs are formed by conforming to the“icosahedral QC line”with e/a= 1.86[38,39].As mentioned in Section2.1,the spraying feedstock was fabricated by gas atomization,and had a nominal composition of Al65Cu20Cr15 [36–38],which determined that the QC phase in the feedstock and thermal sprayed coatings should be Al65Cu24Cr11IQC,instead of a DQC.Besides this main phase I-Al65Cu24Cr11(I),three minor phases are also found in the phase assemblage.As the approximants of Al65-Cu24Cr11IQC,α-Al69Cu18Cr13[38]andε-Al2Cu3[47]are1/1-type and B2-based respectively.θ-Al13Cr2(i.e.Al83Cu4Cr13)has a monoclinic structure with lattice parameter a=2.52nm,b=0.76nm,c= 1.09nm,andβ=128.7°[38,39].Imitating the previous paper[36],XRD peak intensity ratios(PIRs)of α/I,ε/I andθ/I[48,49],as shown in Table2and Fig.2were calculated, based upon a qualitative analysis of XRD patterns of the Al65Cu20Cr15 QC feedstock and as-sprayed coatings.And the value of PIR had been confirmed to roughly equal the volume fraction of each crystalline phase in the sample[48,49].In the present work,the formation of IQC follows two mechanisms expatiated in[36],which are unnecessary to repeat pared with the LPAPS jet[36],the HVOFflame has a relatively low tempera-ture[27],which decreases the vaporization of aluminum,and facilitates the formation of IQC rather than any crystalline phase(α,θorε). Furthermore,the feedstock particles accelerated to a much higher speed[27]by the HVOFflame in the nozzle inside,resides a much briefer time in the nozzle outside to expose in the oxidizing atmosphere, so the oxidation of particles decreases.Consequently,the HVOF-sprayed coatings contained more IQC and fewer crystalline phases(α,θandε), compared with the ones deposited by LPAPS(except PS1),as shown in Table2and Fig.2.Even though the same thermal spray technique (HVOF or LPAPS)was used,the energy increase of the heat source caused a rapid growth of heat transfer to in-flight particles,promoted the vaporization of aluminum and oxidation of particles(Fig.3), reduced the formation of IQC,and made cooling rate of droplets or splats so“slow”that some crystalline phases were prone to form. So the higher the input energy was,the fewer the IQC and the more crystalline phase(α,θorε)the coating contained.3.2.MicrostructureThe coating cross-sectional SEM micrographs are shown in Fig.4. PS3and PS4comprised layers of deformed particles,in which porosities, cracks and remains of semi-molten particles were observed and regarded as typical features of plasma sprayed coatings,as shown in Fig.4(a)and(b).The microstructure characteristics of the coating deposited by LPAPS and its changes with increasing heat source energy have been discussed in the previous paper[36].As shown in Fig.4(c) and(d),porosities,microcracks and partially-melted particles were also detected in the HVOF-sprayed coatings,but these microstructures were much smaller-sized than those of the coatings deposited by LPAPS[36].Generally,the density of thermal spray coating depends not only on the state parameters of the feedstock particles,including structure,size, velocity and temperature before impinging on a substrate,but also on the subsequentflattening and solidification of liquid or partially lique-fied droplets after collision onto a substrate;and ultimately affects the coating microstructures and properties[50,51].In the present experiments,because the feedstock QC powders for HVOF and LPAPS were the same,the structure and size of the feedstock particles could be regarded as identical,and their influences could be neglected.The microstructural difference of the as-sprayed coatings should be determined by the velocity and temperature of in-flight par-ticles,as well as theflattening and solidification of liquid or partially liq-uefied droplets after impact onto the pared with the Al65Cu20Cr15QC particles in LPAPS process[36],those in HVOF spraying had a much higher average velocity and a much lower average temper-ature[27],leading to insufficient melting of the particles,as confirmed by the SEM micrographs of the coating surface morphologies shown in Fig.5.The molten fraction of spray material plays an important roleTable2XRD peak intensity ratio ofα/I,ε/I andθ/I in the Al65Cu20Cr15QC feedstock and as-sprayed coatings[36].Coating code PS1PS2PS3PS4PS5HF1HF2Feedstock Thermal spray technique LPAPS LPAPS LPAPS LPAPS LPAPS HVOF HVOFθ/I peak intensity ratio(%)49.556.561.766.873.547.348.846.8α/I peak intensity ratio(%)25.128.731.034.638.520.522.618.7ε/I peak intensity ratio(%)13.114.816.016.918.313.914.612.8Fig.2.XRD peak intensity ratio ofα/I,ε/I andθ/I in the feedstock and as-sprayed coatings.31Y.Fu et al./Surface&Coatings Technology252(2014)29–34on producing a high density coating [52],so the low melting degree of HVOF-sprayed Al 65Cu 20Cr 15QC particles facilitates a low coating densi-ty.However,a higher coating density than that of LPAPS could be ob-tained using the same QC powders (Fig.4),because the in-flight velocity of Al 65Cu 20Cr 15QC particle reached to 400–700m/s by the DJ2700HVOF system,in comparison to 200–400m/s by LPAPS [36],which were estimated from [27,52].In the present cases,pores in the coatings were originated not only from insuf ficient filling of droplet ma-terials into the cavities of previously deposited coating surface,but also from insuf ficient densi fication through the deformation of unmelted particle fractions [52].High particle velocities of HVOF bene fited the de-crease of apparent pores of the resultant coating [53],overwhelmed the disadvantage of low melting degree and induced a high coating density.In addition,when HVOF-sprayed Al 65Cu 20Cr 15QC particles impacted onto the substrate or previously deposited coating surface,the unmelted particle part broke up due to the inherent brittleness ofquasicrystals;and the previously deposited portion was deformed,den-si fied and even cracked by high-velocity-particle impingements.The particle breakages and deformations of particles and the previously deposited coating upon high-velocity-particle impacts,as shown in Fig.5(a),mini fied splats,facilitated suf ficient filling of droplet materials into the surface cavities and densi fied the coating.3.3.Particle impact breakage behaviorThe impact breakage behavior of HVOF-sprayed Al 65Cu 20Cr 15QC particles signi ficantly affects the microstructure and properties of the resultant coating.It is valuable and essential to clarify the occurrence conditions for this behavior.Hence,the contrast experiments were performed by LPAPS [36]with the same feedstock,and by HVOF spraying Cu180powders.Three typical coatings —HF2,HF3(as shown in Table 1)and PS4(as shown in Table 2and [36])were chosen for comparison.Their SEM surface morphologies and cross-sectional light microscopy images are shown in Fig.5and Fig.6,respectively,and their cross sections were etched with 10wt.%NaOH –water solution after polishing treatment,to make the splats and microstructure in them more visible.Under otherwise identical conditions,the feedstock for HF3has the smaller-sized powders,much higher thermal conductivity and tough-ness than that for HF2,so the microstructure of HF3conventionally may be finer and denser than that of HF2.On the contrary,HF2presents a much finer microstructure with much smaller splats compared with HF3,as shown in Fig.6(a)and (b).Why?It positively attributes to the particle breakages (“A ”in Fig.5(a))and deformations of particles (“B ”in Fig.5(a))and the previously-deposited coating portion (“C ”in Fig.5(a))upon high-velocity-particle impacts.This particle breakage phenomenon can be clearly con firmed in Fig.5(a),but nearly impercep-tible in Fig.5(b).Based on the results mentioned above,the high brittle-ness of feedstock powders (e.g.quasicrystal)should be the necessary condition for occurrence of the particle impact breakage in thermal spray process.In other words,no high-brittleness feedstock,no visible particle breakage in thermalspraying.Fig.3.Effect of aluminum and oxygen mean content in as-sprayed coatings on the loss of IQC (based on EDSanalyses).Fig.4.Cross-sectional SEM micrographs of as-sprayed Al –Cu –Cr QC coatings:(a)PS3,(b)PS4,(c)HF1,and (d)HF2.32Y.Fu et al./Surface &Coatings Technology 252(2014)29–34HF2also gives a much finer microstructure than PS4,as shown in Figs.4(b)and (d)and 6(a)and (c),although they were fabricated with the same feedstock.The finer microstructure of HF2directly relates to the characteristics of HVOF-sprayed particles.As mentioned above,HVOF-sprayed QC particles had a much higher average velocity and melting degree than those of LPAPS.Moreover,Al 65Cu 20Cr 15QC pow-ders have such coarse particles with a very low thermal conductivity (≤1/5that of AISI 304stainless steel)[39],which can aggravate insuf fi-cient melting.Therefore,most in-flight QC particles (N 80%)[54]in HVOF were the solid –liquid two-phase particles similar to those report-ed by Li et al.[51,52,55,56],where unmelted cores and completely melted surface layers were at solid and liquid states,respectively.How-ever,most QC particles of LPAPS [36]melted more suf ficiently than those in HVOF,and some small-sized particles even completely melted into single-phase liquid droplets.The great difference of particle melting degree can be con firmed in Fig.5(a)and (c),but the particle-breakage phenomenon mentioned above cannot be perceptible in Fig.5(c),which indicates that the high melting degree and low velocity of in-flight particles of LPAPS signi ficantly suppressed the particle breakage.Hence,the suf ficient condition for occurrence of thermal spray particle impact breakage may be the high velocity and low melting degree of spray particles (e.g.HVOF-sprayed low thermal conductivity powders).3.4.Porosity and microhardnessThe porosity and Vickers microhardness (HV 0.1)of as-sprayed QC coatings are shown in Table 3.In order to decrease the negative effects of porosity on the accuracy of hardness examination,the microhardness value in Table 3is an average of 10different locations on each sample.Gas porosity and shrinkage porosity,the 2main types of porosities in thermal sprayed coatings,as well as their formation mechanism,had been discussed before [36,57,58],and should not be repeated here.Sig-ni ficant phase assemblage and atomic volume differences between QC and crystalline phases facilitate the formation of porosity [59,60].There-fore,the QC coatings in the present study may have higherporosities,Fig.5.SEM micrographs of coating surface morphologies:(a)HF2,(b)HF3,and (c)PS4.Fig.6.Cross-sectional light microscopy images of coatings:(a)HF2,(b)HF3,and (c)PS4.33Y.Fu et al./Surface &Coatings Technology 252(2014)29–34than the Al–Cu–Cr crystalline coatings thermally sprayed by the same technique,despite having similar elemental compositions.The HVOF-sprayed QC coatings had a much lower porosity compared with those by LPAPS[36],which related to thefiner and denser coating microstruc-tures resulted from the particle impact breakage mentioned above.The rise in HVOF energy promoted the oxidation of particles and vaporiza-tion of aluminum,as illustrated in Fig.3,thus inducing the pores.How-ever,the growth of particle velocity facilitated the particle impact breakage,minified splats,increased splatflattening ratio and adhesion among splats to suppress interlamellar shrinkage porosity formation, and consequently,diminished the coating porosity.Under the present experimental conditions,the latter effect may overwhelm the former, thereby causing the coating porosity to decrease with increasing the HVOF energy,so HF2had a lower porosity than HF1.The coating micro-hardness depended on the coating phase composition and microstruc-ture,and increased with the coating porosity decrease in the present study,which agreed well with the experimental results of E.Fleury et al.[61].As a result,HF2had a higher microhardness than HF1,though HF1contained more IQC that contributes to hardness(Fig.3).4.ConclusionsAl–Cu–Cr QC coatings were prepared by a HVOF DJ2700system.The influences of heat source energy and particle impact breakage on the phase constituent,microstructure and hardness properties of the coat-ings were investigated.The results are summarized as follows:pared with the one deposited by LPAPS using the same Al65Cu20Cr15QC feedstock,(1)the HVOF-sprayed coating contained more IQC,due to the less oxidation and vaporization of the feedstock;and(2)presented a lower porosity and higher hardness with a much denser microstructure,which resulted from the particle impact breakage behavior.2.With increasing the HVOF energy,(1)the volume fraction of suchcrystalline phases asε,αandθin the coating increased,but that of the IQC decreased,because the higher energy reduced the cooling rate and increased the particle oxidation and vaporization of alumi-num;(2)the coating porosity decreased while its microhardness increased due to the increase of the splatflattening ratio and the adhesion among minified splats.3.The particle impact breakage behavior can minify splats,deform anddensify the coating.The necessary and sufficient conditions for its occurrence in the thermal spray process are:(1)the high brittleness of feedstock and(2)the high velocity and low melting degree of spray particles,respectively.AcknowledgementThe authors are grateful for thefinancial support by the National Natural Science Foundation of China(50805012,51172033and21276 036)and the Fundamental Research Funds for the Central Universities (3132013056and3132013311).References[1] D.Shechtman,I.Blech,D.Gratias,J.W.Cahn,Phys.Rev.Lett.53(1984)1951.[2]L.Swartzendruber,D.Shechtman,L.Bendersky,J.Cahn,Phys.Rev.B32(1985)1383.[3]T.Klein,A.Gozlan,C.Berger,F.Cyrot-Lackmann,Y.Calvayrac,A.Quivy,Europhys.Lett.13(1990)129.[4]M.Sales,A.Merstallinger,tinov,S.Polishchuk,T.Melnichenko,Surf.Coat.Technol.201(2007)6206.[5]W.Yuan,T.Shao,E.Fleury,D.Chen,Surf.Coat.Technol.185(2004)99.[6]J.-M.Dubois,World Scientific,2005,p.305.[7] D.J.Sordelet,J.Dubois,MRS Bull.22(1997)34.[8]J.Kong,C.Zhou,S.Gong,H.Xu,Surf.Coat.Technol.165(2003)281.[9] C.Zhou,R.Cai,S.Gong,H.Xu,Surf.Coat.Technol.201(2006)1718.[10] E.Huttunen-Saarivirta,J.Alloys Compd.363(2004)150.[11]S.Olsson,F.Eriksson,J.Birch,L.Hultman,Thin Solid Films526(2012)74.[12]R.Anton,P.Kreutzer,J.Alloys Compd.342(2002)464.[13]R.Teghil,L.d'Alessio,A.Santagata,M.Zaccagnino,D.Ferro,D.Sordelet,Appl.Surf.Sci.210(2003)307.[14] A.Traverse,E.Belin-Ferré,Z.Dankházi,L.Mendoza-Zélis,borde,R.Portier,J.Phys.Condens.Matter8(1996)3843.[15]L.Chen,L.Wang,Appl.Phys.Lett.70(1997)1825.[16]M.Besser,T.Eisenhammer,MRS Bull.22(1997)59.[17] E.Fleury,Y.-C.Kim,J.-S.Kim,H.-S.Ahn,S.-M.Lee,W.-T.Kim,D.-H.Kim,J.Mater.Res.17(2002)492.[18] D.Sordelet,M.Besser,J.Logsdon,Mater.Sci.Eng.A255(1998)54.[19] E.Fleury,Y.-C.Kim,J.-S.Kim,D.-H.Kim,W.Kim,H.-S.Ahn,S.-M.Lee,J.AlloysCompd.342(2002)321.[20] D.Sordelet,S.Widener,Y.Tang,M.Besser,Mater.Sci.Eng.A294(2000)834.[21]S.De Palo,mani,S.Sampath,D.Sordelet,M.Besser,Proceedings of the1st Unit-ed Thermal Spray Conference,ASM International,Indianapolis,USA,1997,p.135.[22] C.Zhang,Y.Wu,L.Liu,Appl.Phys.Lett.101(2012)121603.[23]P.L.Fauchais,J.V.Heberlein,M.I.Boulos,Thermal Spray Fundamentals,Springer,2014,p.4.[24]V.V.V.Sobolev,J.Nutting,J.Guilemany,High Velocity Oxy-Fuel Spraying,ManeyPub,2004.30.[25]J.R.Davis,Handbook of Thermal Spray Technology,ASM international,2004,p.43.[26]L.Pawlowski,The Science and Engineering of Thermal Spray Coatings,John Wiley&Sons,2008,p.89.[27]X.Liu,P.K.Chu,C.Ding,Mater.Sci.Eng.R47(2004)49.[28]S.Kamnis,S.Gu,Chem.Eng.Process.45(2006)246.[29]M.Verdian,K.Raeissi,M.Salehi,Appl.Surf.Sci.273(2013)426.[30] B.Irving,R.Knight,R.W.Smith,Weld.J.72(1993)25.[31]M.Li,P.D.Christofides,Chem.Eng.Sci.61(2006)6540.[32] C.-J.Li,W.-Y.Li,Surf.Coat.Technol.162(2003)31.[33]M.Morks,Y.Gao,Y.Fu,Surf.Coat.Technol.199(2005)66.[34]L.An,Y.Gao,T.Zhang,J.Therm.Spray Technol.16(2007)967.[35]Y.Gao,X.Xu,Z.Yan,G.Xin,Surf.Coat.Technol.154(2002)189.[36]Y.Fu,L.An,F.Zhou,Y.Zhao,D.Yang,Y.Gao,Surf.Coat.Technol.202(2008)4964.[37]Y.Q.Fu,F.Zhou,D.M.Yang,N.X.Li,Y.Gao,Mater.Sci.Forum610–613(2009)641.[38]Y.Qi,Z.Zhang,Z.Hei,C.Dong,J.Alloys Compd.285(1999)221.[39] C.Dong,Quasicrystal Materials,China National Defence Industry Press,1998,p.52.[40] A.-P.Tsai,A.Inoue,T.Masumoto,J.Mater.Sci.Lett.7(1988)322.[41]J.Wu,Philos.Mag.Lett.73(1996)163.[42]T.Okabe,J.-I.Furihata,K.Morishita,H.Fujimori,Philos.Mag.Lett.66(1992)259.[43]J.-I.Furihata,T.Okabe,J.Electron Microsc.48(1999)761.[44] A.Shevchukov,T.Sviridova,S.Kaloshkin,V.Tcherdyntsev,M.Gorshenkov,M.Churyukanova,D.Zhang,Z.Li,J.Alloys Compd.586(2014)S391.[45]T.Sviridova,A.Shevchukov,E.Shelekhov,D.Diakonov,V.Tcherdyntsev,S.Kaloshkin,J.Alloys Compd.509(2011)S299.[46]J.Friedel,F.Denoyer,Sciences de la Terre C.R.Acad.Sci.II Mécanique Phys.Chim.Sci.de l'univers Sci.Terre305(1987)171.[47] C.Dong,Q.Zhang,D.Wang,Y.Wang,Eur.Phys.J.B6(1998)25.[48] D.Sordelet,M.Kramer,O.Unal,J.Therm.Spray Technol.4(1995)235.[49] D.Sordelet,M.Besser,I.Anderson,J.Therm.Spray Technol.5(1996)161.[50]R.McPherson,Surf.Coat.Technol.39(1989)173.[51] C.-J.Li,A.Ohmori,Y.Harada,J.Mater.Sci.31(1996)785.[52] C.-J.Li,G.-J.Yang,Int.J.Refract.Met.Hard Mater.39(2013)2.[53]H.de Villiers Lovelock,J.Therm.Spray Technol.7(1998)357.[54]Y.Q.Fu,PhD Thesis,Dalian Maritime University,China(2010).[55] C.-J.Li,Y.-Y.Wang,G.-J.Yang,A.Ohmori,K.Khor,Mater.Sci.Technol.20(2004)1087.[56] C.-J.Li,Y.-Y.Wang,T.Wu,G.-C.Ji,A.Ohmori,Surf.Coat.Technol.145(2001)113.[57]V.Sobolev,J.Guilemany,J.Mater.Process.Technol.58(1996)227.[58] C.C.Berndt,W.Brindley,A.Goland,H.Herman,D.Houck,K.Jones,ler,R.Neiser,W.Riggs,S.Sampath,J.Therm.Spray Technol.1(1992)341.[59]V.Tcherdyntsev,S.Kaloshkin,A.Salimon,E.Leonova,I.Tomilin,J.Eckert,F.Schurack,V.Rogozin,S.Pisarev,Y.P.Trykov,Mater.Manuf.Process.17(2002)825.[60]M.Suarez,I.Figueroa,G.Gonzalez,ra-Rodriguez,O.Novelo-Peralta,I.Alfonso,I.Calvo,J.Alloys Compd.585(2014)318.[61] E.Fleury,S.Lee,W.Kim,D.Kim,J.Non-Cryst.Solids278(2000)194.Table3Cross-sectional porosity and microhardness HV0.1of as-sprayed Al–Cu–Cr QC coatings[36].Coating code PS1PS2PS3PS4PS5HF1HF2Porosity(%)13±312±210±28±215±48±36±2 Microhardness HV0.1(GPa) 4.58±0.58 4.64±0.78 4.84±0.50 4.98±0.70 4.75±0.66 5.16±0.45 5.62±0.36 34Y.Fu et al./Surface&Coatings Technology252(2014)29–34。