Late-Time X-ray Flares during GRB Afterglows Extended Internal Engine Activity
X-ray bursts at extreme mass accretion rates from GX 17+2

a r X i v :a s t r o -p h /0105386v 2 23 N o v 2001Astronomy &Astrophysics manuscript no.(will be inserted by hand later)X-ray bursts at extreme mass accretion rates from GX 17+2E.Kuulkers 1,2,J.Homan 3,⋆,M.van der Klis 3,W.H.G.Lewin 4,and M.M´e ndez 11SRON National Institute for Space Research,Sorbonnelaan 2,3584CA Utrecht,The Netherlands e-mail:E.Kuulkers@sron.nl,M.Mendez@sron.nl2Astronomical Institute,Utrecht University,P.O.Box 80000,3508TA Utrecht,The Netherlands3Astronomical Institute “Anton Pannekoek”,University of Amsterdam,and Center for High Energy Astrophysics,Kruislaan 403,1098SJ Amsterdam,The Netherlands e-mail:homan@merate.mi.astro.it,michiel@astro.uva.nl4Department of Physics and Center for Space Research,Massachusetts Institute of Technology,Cambridge,MA 02138,USAe-mail:lewin@Received –;accepted –Abstract.We report on ten type I X-ray bursts originating from GX 17+2in data obtained with the RXTE/PCA in 1996–2000.Three bursts were short in duration (∼10s),whereas the others lasted for ∼6–25min.All bursts showed spectral softening during their decay.There is no evidence for high-frequency (>100Hz)oscillations at any phase of the bursts.We see no correlations of the burst properties with respect to the persistent X-ray spectral properties,suggesting that in GX 17+2the properties of the bursts do not correlate with inferred mass accretion rate.The presence of short bursts in GX 17+2(and similar bright X-ray sources)is not accounted for in the current X-ray bursts theories at the high mass accretion rates encountered in this source.We obtain satisfactory results if we model the burst emission with a black body,after subtraction of the persistent pre-burst emission.The two-component spectral model does not fit the total burst emission whenever there is a black-body component present in the persistent emission.We conclude that in those cases the black-body contribution from the persistent emission is also present during the burst.This implies that,contrary to previous suggestions,the burst emission does not arise from the same site as the persistent black-body emission.The black-body component of the persistent emission is consistent with being produced in an expanded boundary layer,as indicated by recent theoretical work.Five of the long bursts showed evidence of radius expansion of the neutron star photosphere (independent of the spectral analysis method used),presumably due to the burst luminosity reaching the Eddington value.When the burst luminosity is close to the Eddington value,slight deviations from pure black-body radiation are seen at energies below ≃10keV.Similar deviations have been seen during (long)X-ray bursts from other sources;they can not be explained by spectral hardening models.The total persistent flux just before and after the radius expansion bursts is inferred to be up to a factor of 2higher than the net peak flux of the burst.If both the burst and persistent emission are radiated isotropically,this would imply that the persistent emission is up to a factor of 2higher than the Eddington luminosity.This is unlikely and we suggest that the persistent luminosity is close to the Eddington luminosity and that the burst emission is (highly)anisotropic (ξ∼2).Assuming that the net burst peak fluxes equal the Eddington limit,applying standard burst parameters (1.4M ⊙neutron star,cosmic composition,electron scattering opacity appropriate for high temperatures),and taking into account gravitational redshift and spectral hardening,we derive a distance to GX 17+2of ∼8kpc,with an uncertainty of up to ∼30%.Key words.accretion,accretion disks —binaries:close —stars:individual (GX 17+2)—stars:neutron —X-rays:bursts2 E.Kuulkers et al.:X-ray bursts in GX17+2(Woosley&Taam1976;Maraschi&Cavaliere1977).Another kind of X-ray bursts was found(together withthe above type of bursts)from MXB1730−355(later re-ferred to as the Rapid Burster),which were suggested tobe due to accretion instabilities.The former and latter kind of bursts were then dubbed type I and type II,re-spectively(Hoffman et al.1978a).The main characteristics of type I bursts(for a review see Lewin et al.1993)are:sudden and short(≃1s)increasein the X-rayflux,exponential decay light curve,durationof the order of seconds to minutes,softening during the decay(attributed to cooling of the neutron star surface),(net)burst spectra reasonably well described by black-body emission from a compact object with≃10km radiusand temperature of≃1–2keV,and total energies rangingfrom≃1039to1040erg.When the luminosity during the burst reaches the Eddington limit(i.e.,when the pressureforce due to radiation balances the gravitational force),theneutron star photosphere expands.Since L b∝R2T eff4, when the radius of the photosphere,R,expands,the ef-fective temperature,T eff,drops,with the burst luminosity, L b,being constant(modulo gravitational redshift effectswith changing R)at the Eddington limit,L Edd.Burstsduring their radius expansion/contraction phase are there-fore recognizable by an increase in the inferred radius with a simultaneous decrease in the observed tempera-ture,while the observedflux stays relatively constant.The emission from a(hot)neutron star is not expectedto be perfectly Planckian,however(van Paradijs1982; London et al.1984,1986;see also Titarchuk1994;Madej 1997,and references therein).This is mainly due to the effects of electron scattering in the neutron star atmo-sphere,deforming the original X-ray spectrum.This re-sults in a systematic difference between the effective tem-perature(as would be measured on Earth),T eff,∞,and the temperature as obtained from the spectralfits,T bb (also referred to as‘colour’temperature,see e.g.Lewin et al.1993).In general,the deviations from a Planckian distribution will depend on several parameters,such as temperature,elemental abundance,neutron star mass and radius.The hardening factor,T bb/T eff,∞,has been deter-mined through numerical calculations by various people and its value is typically around1.7.When the burst lu-minosity approaches the Eddington limit the deviations from a black-body become larger,and so does the spec-tral hardening(T bb/T eff,∞∼2,Babul&Paczy´n ski1987; Titarchuk1988).During extreme radius expansion phases, however,this trend may break down and T bb/T eff,∞<1 (Titarchuk1994).Attempts have been made to determine the spectral hardening from the observed cooling tracks, but conclusions are still rather uncertain(e.g.Penninx et al.1989;Smale2001).As a result,the interpretation of X-ray bursts spectra has remained uncertain and constraints on the mass-radius relationship for neutron stars elusive.Type I X-ray burst theory predicts three differentregimes in mass accretion rate(˙M)for unstable burn-ing(Fujimoto et al.1981,Fushiki&Lamb1987;see also Bildsten1998,2000,Schatz et al.1999,and references therein;note that values of critical˙M depend on metal-licity,and on assumed core temperature and mass of the neutron star):1)low accretion rates;10−14M⊙yr−1∼<˙M∼<2×10⁻¹⁰M⊙yr−1:mixed H/He burning triggered by thermally unstable H ignition2)intermediate accretion rates;2×10⁻¹⁰M⊙yr−1∼<˙M∼<4–11×10−10M⊙yr−1:pure He shell ignition after steady H burning3)high accretion rates;4–11×10−10M⊙yr−1∼<˙M∼< 2×10⁻⁸M⊙yr−1:mixed H/He burning triggered by thermally unstable He ignitionH and He are burning stably in a mixed H/He environ-ment for very low and very high values of˙M,i.e.˙M be-low∼10−14M⊙yr−1and above∼2×10⁻⁸M⊙yr−1(close to the critical Eddington˙M).During pure heliumflashes the fuel is burned rapidly,and such bursts therefore last only5–10s.This gives rise to a large energy release in a short time,which causes the bursts often to reach the Eddington limit,leading to photospheric radius expan-sion.Bursts with unstable mixed H/He burning release their energies on a longer,10–100s,timescale,due to the long series ofβdecays in the rp-process(see e.g.Bildsten 1998,2000).The Z sources(Hasinger&van der Klis1989)are a group of sources inferred to persistently accrete near the Eddington limit.In a colour-colour diagram they trace out a Z-like shape,with the three limbs of the Z(his-torically)referred to as the horizontal branch(HB),nor-mal branch(NB)andflaring branch(FB),from top to bottom.˙M is inferred to increase from sub-Eddington at the HB,near-Eddington at the NB to super-Eddington at the FB(e.g.Hasinger1987;Lamb1989;Hasinger et al. 1990).According to the burning regimes outlined above these sources should exhibit long(∼>10–100s)type I X-ray bursts,at least on the HB and NB.However,of the Z sources,only GX17+2and Cyg X-2show(infre-quent)bursts(Kahn&Grindlay1984;Tawara et al.1984c; Sztajno et al.1986;Kuulkers et al.1995,1997;Wijnands et al.1997;Smale1998),indicating that most of the ma-terial is burning stably.This is in contrast to the above theoretical expectations for high˙M.Moreover,the bursts in Cyg X-2are short(≃5s),whereas GX17+2shows both short(≃10s)and long(∼>100s)bursts.One of the bursts of Cyg X-2showed a radius expansion phase(Smale1998); this burst clearly bears all the characteristics of a Heflash (regime2),whereas the neutron star is inferred to ac-crete at near-Eddington rates.The short duration bursts in GX17+2also hint to a Heflash origin,whereas the long duration bursts hint to unstable mixed H/He burn-ing(regime3;see also van Paradijs et al.1988).A study of X-ray bursts from Cyg X-2and GX17+2observed by EXOSAT showed no correlation of the burst properties with position in the Z,although the number of bursts observed from GX17+2was small(Kuulkers et al.1995, 1997).E.Kuulkers et al.:X-ray bursts in GX17+23The Proportional Counter Array(PCA)onboard theRossi X-ray Timing Explorer(RXTE)combines highthroughput using a large collecting area(maximum of≃6500cm2)with the ability to label photons down to atime resolution ofµs.This is ideal to study short eventslike X-ray bursts,especially during the start of the burst.Such studies may provide more insight in the propertiesof X-ray bursts which occur at these extreme mass accre-tion rates.Analysis of X-ray bursts in persistent sourcesat(relatively)high inferred mass accretion rates(typi-cally∼>0.2˙M Edd)observed with the RXTE/PCA were pre-sented for one burst seen with Cyg X-2(Smale1998)andone seen in GX3+1(Kuulkers&van der Klis2000).Inthis paper we present thefirst account of ten X-ray burstsfrom GX17+2observed by the RXTE/PCA during the period1996–2000.For a description of the correlated X-ray timing and spectral properties of GX17+2using the same data set we refer to Homan et al.(2001).2.Observations and AnalysisThe PCA(2–60keV;Bradt et al.1993)onboard RXTE observed GX17+2various times during the mission.Up to now a total of657ksec of useful data has been obtained.A log of these observations is given in Table1.During the observations in1996–1998allfive proportional counter units(PCUs)were active,whereas in1999and2000only three units were active.The high voltage settings of the PCUs have been altered three times during the mission (so-called gain changes),which modified the response of the detectors.These changes therefore mark four periods, called gain epochs.The observations were done in two standard modes:one with relatively high spectral resolu-tion(129energy channels covering the whole PCA energy band)every16sec,the Standard2mode,the other hav-ing no spectral information providing the intensity in the whole PCA energy band at a moderate time resolution of 0.125s,the Standard1mode.Additionally,data were recorded in various high time resolution(≤2ms)modes that ran in parallel to the Standard modes,and that recorded photons within a specific energy band with ei-ther low spectral resolution(B-modes or E-modes)or no spectral resolution(SB-modes).The B-,E-and SB-modes used here combined the information from all layers of all active PCUs together.During the1996observations a B-and E-mode were available,giving16and64energy bands, covering channels0–49and50–249,at2ms and125µs,re-spectively.For most of the observations in1997four SB modes covering the total PCA energy range were available. In the1998,1999,and2000observations two SB-modes covering channels0–13and14–17at125µs,and an E-mode giving64energy bands covering channels18–249at 16µs time resolution were available.For the spectral analysis of the persistent emission we used the Standard2data.We accumulated data stretches of96s just before the burst,combining the PCUs which were operating at that time.In order to study the spectral properties of the bursts we used twoapproaches.Fig.1.Standard1light curve of the GX17+2observa-tions during October10,1999,at a time resolution of5s. Time zero corresponds to05:39:27(UTC).No correctionsfor background and dead-time have been applied.Clearly,the source varies on the same time scale(and faster)as the burst which started at T=12680s.The source was in theFB and the lower part of the NB during the observations. Spectra during the bursts were determined every0.25secfor thefirst≃20s of the burst.For the short bursts this means the whole duration of the burst.For the long burstswe also used the Standard2data to create spectra at16s intervals,for evaluating the remainder of these bursts. Since no high time resolution spectral data were available during the1997observations(only4SB-modes),only the Standard2data were used to study the spectral prop-erties of the burst from this observation.All spectra were corrected for background and dead-time using the proce-dures supplied by the RXTE Guest Observer Facility1.A systematic uncertainty of1%in the count rate spectra was taken into account.For our spectralfits we confined ourselves to the energy range of3–20keV,which is best calibrated.The hydrogen column density,N H,towardsGX17+2wasfixed to that found by the Einstein SSS and MPC measurements(2×10²²atoms cm−2,Christian&Swank1997;see also Di Salvo et al.2000).In all caseswe included a Gaussian line(see Di Salvo et al.2000)fixedat6.7keV,with afixed line width of0.1keV.One sigma confidence errors were determined using∆χ2=1.Large amplitude,high coherence brightness oscilla-tions have been observed during various type I X-ray bursts in other low-mass X-ray binaries(LMXBs;see e.g. Strohmayer1998,2001).We searched all the bursts fromGX17+2for such ing the high time res-olution modes we performed Fast Fourier Transforms tobook.html.4 E.Kuulkers et al.:X-ray bursts in GX17+2 Table1.RXTE observation log of GX17+2a1996feb0713:27feb0900:025811997feb0219:13feb2703:345911997apr0119:13apr0423:263501997jul2702:13jul2800:334301998aug0706:40aug0823:407111998nov1806:42nov2013:318621999oct0302:43oct1207:0529852000mar3112:15mar3116:31702T90is defined as the time it takes to observe90%of the total background-subtracted counts in an event,starting and the longer events,since the persistent emission varies on the same time scale(or even fatser)as the event itself,see e.g.Fig.1.The rise time of the events was determined as follows.We constructed light curves in the full PCA en-ergy band with a time resolution of1/32sec.We defined t rise as the time for the event to increase from25%to90% of the net peak event rate(see e.g.Muno et al.2000;van Straaten et al.2001).A detailed look at the light curves revealed that the onset of events b1–b4,b8,b10,and f2 consisted of a rapid rise phase and a subsequent slower rise to maximum.In the events b5–b7,b9,f1,and f3the count rate rapidly increased to maximum,with no sub-sequent slower rise.We therefore alsofitted the pre-event phase,fast rise phase(and slow rise phase)with a constant level and one(or two)linear functions,respectively,using the Standard1light curves.Wefind that the total du-ration of the fast rise phase,t fr,is between0.1and0.6sec for events b1–b10and0.4–1s for f1–f4(Table2).In the fits to the decay portion of the light curves for the short events we used the Standard1light curves at0.125sec time resolution,while for the longer events we rebinned these light curves to a time resolution of5sec.For some of the events an exponential does not describe the decay very well;this is probably due to the short term variations in the persistent emission.For these events wefitted only the initial decay(first few seconds for f2and f3,andfirst few100s for burst b9and b10).In Fig.2we show the light curves of the four events f1–f4,at low(∼<7keV)and high(∼>7keV)energies,with the corresponding hardness(ratio of the count rates in the high and low energy band)curves,all at a time resolution of0.125s.Although they have a fast rise and a longer decay(see also Table2),they show small or no variations in hardness.Time-resolved spectral analysis(like done in Sect.3.2.3)confirmed this;no clear cooling during the decay can be discerned.We can therefore not classify these events as type I bursts.Since all of the four events occurred in the FB,we conclude that they must beflares,of which the light curves happen to resemble those of X-ray bursts (such as b1,b3and b5).We will not discuss these fourE.Kuulkers et al.:X-ray bursts in GX17+25 Table2.Bursts and burst-like events(flares)in GX17+2b11996feb0816:17:121510 1.220.35±0.05 1.83±0.08 1.1/130mNB b21997feb0802:36:3435>360 1.190.34±0.08248+4−9 2.5/49mNB b31998aug0713:15:5035100.530.27±0.09 2.55±0.24 1.0/131lNB b41998nov1808:51:26351000 1.340.61±0.04197±2 3.7/147SV b51998nov1814:37:3035100.410.54±0.04 2.06±0.13 1.1/85mNB b61999oct0315:36:3243(0,2,3)16000.410.19±0.04274±3 2.0/242lHB b71999oct0523:41:4343(0,2,4)5000.560.30±0.0377.3±1.2 1.9/104uNB b81999oct0611:10:3343(0,2,3)500 1.660.13±0.0270.2±1.4 1.2/57lHB b91999oct0912:34:2443(0,2,3)5000.130.16±0.0276.4±1.5 3.1/66uNB b101999oct1009:10:4743(0,2,3)7000.720.20±0.04115±3 3.7/57lNB f11996feb0703:39:111510 1.03 1.12±0.07 2.98±0.49 1.3/88mFB f21998nov1914:38:2435100.410.33±0.04 1.72±0.35 1.1/28uFB f31998nov2000:44:4335100.750.45±0.06 1.85±0.25 1.1/55uFB f41999oct1108:55:3043(0,2,3)10 5.0 1.06±0.20 2.18±0.22 1.1/148lFB6 E.Kuulkers et al.:X-ray bursts in GX17+2Fig.3.Same as Fig.2,but for the three short X-ray bursts b1,b3,and b5.The low and high energy ranges are 1–7.2keV and 7.2–19.7keV,respectively,for b1,whereas they are 1.9–6.2keV and 6.2–19.6keV,respectively,for b3and b5.events further in the paper and denote the remainder of the ten events as bursts,since we will show below that they are genuine type I X-ray bursts.In Fig.3we show the light curves of the three short bursts b1,b3and b5,at low and high energies,with the corresponding hardness curves,all at a time resolution of 0.125s.All three bursts show a fast rise (typically less than 0.5s)and an exponential decay with a decay time of ≃2s (see Table 2).During the rise the emission hardens;as the bursts decay,the emission becomes softer.The main difference between the three bursts is the fact that the peak of burst b3is about 25%lower than the other two bursts;it looks like a ‘failed’burst.It also has two peaks,as if some new unstable burning occurred,≃5s after the start of the burst.In Figs.4and 5we show the light curves of the long bursts b2,b4,and b6–b10,at low and high energies,with the corresponding hardness curves,all at a time resolu-tion of 2s.In Figs.6and 7we focus on the start of these bursts,all at a time resolution of 0.125s.Again the rise times are very short (also typically less than 0.5s),but the decay times are much longer,with decay times in the range ≃70–280s (see Table 2).Apart from the fact that the hard burst emission decays faster than the soft burst emission (i.e.spectral softening),there are more pronounced differ-ences between the light curves in the two energy bands.In Figs.4and 5one sees that all the low energy light curves show a kind of spike at the start of the decay.These spikes last for a few seconds in most cases;however,for burst b6it seems to last ≃15s (with an exponential de-cay time of 9±2s).At high energies no such spikes occur(except for burst b10);instead the bursts have more flat-topped peaks,with durations ranging from tens of seconds to ≃200s.Burst b6is the nicest example of this.Zooming in on the start of these long bursts,it becomes clear that the rise is somewhat slower at high energies with respect to low energies (causing the hardening of the emission dur-ing the early phase of the burst).Also,in bursts b4and b6–b9very short (<0.5s)spikes occur during the rise in the high energy light curve,which again are especially ev-ident in burst b6(two spikes!).This causes the hardness to drop on the same time scale in some of these ter we will show that this corresponds to fast radius expansion/contraction episodes.3.2.Spectral behaviour3.2.1.Persistent emission before the burstsThe persistent emission just before the bursts b6and b7can be satisfactorily (χ2red =0.7and 1.2,respectively,for 35degrees of freedom,dof)described by an absorbed cut-offpower-law component plus a Gaussian line.For the per-sistent emission before the remainder of the bursts this is not a satisfactory model (χ2red ranges from 1.4with 35dof for b8to 5.5with 42dof for b3).An additional compo-nent is necessary to improve the fits.We used the F-test to calculate whether the additional component was indeed significant.For the additional component we chose a black body,as is generally used when modeling the X-ray spec-tra of bright LMXBs (e.g.White et al.1986;Christian &Swank 1997;Church &Ba l uci´n ska-Church 2001).Note that more complicated models are necessary to describeE.Kuulkers et al.:X-ray bursts in GX17+27Fig.4.Same as Fig.3,but at a time resolution of2s,for the long bursts b2,b4and b6.Note that b2was interrupted by a South Atlantic Anomaly(SAA)passage as can be seen by the sudden decrease in count rate.The low and high energy ranges are1.9–6.2keV and6.2–≃60keV,respectively,for b2,1.9–6.2keV and6.2–19.6keV,respectively,for b4, and2.1–7.1keV and7.1–19.9keV,respectively,for b6.Table3.Persistent emission spectral parameters ab1 2.0±0.3 1.15±0.0614.1±1.5 1.0±0.1 4.5±0.2 3.8±0.40.013±0.0020.89/47165×10−10b2 2.2±0.5 1.10±0.0322.1±2.20.4±0.2 3.8±0.2 1.5±0.40.008±0.0020.56/40294×10−18b3 1.9±0.3 1.13±0.0319.2±1.50.9±0.1 4.2±0.2 2.6±0.40.013±0.0020.58/40291×10−18b4 2.0±0.3 1.10±0.0420.3±1.80.7±0.1 4.0±0.2 2.3±0.40.014±0.0020.85/40286×10−15b5 2.3±0.3 1.16±0.0517.5±1.70.9±0.1 4.5±0.2 3.2±0.40.010±0.0020.59/40235×10−15b6 2.5±0.1—— 1.03±0.03 5.1±0.1 4.8±0.10.012±0.0020.71/35<7i8b7 2.5±0.1—— 1.17±0.03 4.6±0.17.0±0.20.015±0.002 1.22/35<2i30b8 2.4±0.5 1.08±0.1311.0±4.3 1.0±0.1 5.3±0.3 3.8±0.50.011±0.002 1.13/3361b9 2.4±0.4 1.26±0.0811.6±1.5 1.0±0.1 4.9±0.3 4.3±0.40.010±0.0030.87/33138×10−5b10 1.9±0.3 1.18±0.0515.1±1.4 1.1±0.1 4.5±0.3 3.7±0.50.011±0.002 1.16/33225×10−78 E.Kuulkers et al.:X-ray bursts in GX17+2Fig.5.Same as Fig.4,for the last four long bursts observed in 1999Oct (b7–b10).The low and high energy ranges are 1.9–7.1keV and 7.1–19.9keV,respectively.Fig.6.Same as Fig.4,but 5s before and 10s after the start of the bursts b2,b4and b6,at a time resolution of 0.125s.b7we determined single parameter 95%confidence up-per limits (using ∆χ2=2.71)on the black-body contribu-tion,by including a black-body component in the spec-tral fits,and fixing the temperature to its mean value de-rived for the persistent spectra of the other bursts,i.e.kT bb =1.14keV.The black-body component contributionto the persistent emission varied between less than 2%(burst b7)up to 29%(bursts b2,b3)in the 2–20keV band (Table 3).3.2.2.Persistent emission during the bursts?3.2.2.1Previous EXOSAT resultsUsually it is assumed that the persistent emission is not influenced by the burst and that one can,therefore,study the burst by subtracting the persistent emission from the total source emission.This is referred to as the ‘stan-dard’burst spectral analysis (see e.g.Sztajno et al.1986).However,if the neutron star photosphere contributes sig-nificantly to the persistent emission,this approach is not correct,if the burst emission originates from the same region (van Paradijs &Lewin 1986).In this case the spec-tral fits to the net burst spectra yield a systematically larger black-body temperature,T bb ,and smaller appar-ent black-body radius,R bb ,especially near the end of the burst when the net burst flux is low.In fact,in this case of incorrect subtraction of the persistent emission,the net burst spectrum is not a black-body.Van Paradijs &Lewin (1986)proposed to fit the total source spectrum with a two-component model,a black-body component and a non-black-body component.During the burst the non black-body component is fixed to what is found in the persistent emission,and the black-body component is left free.The black-body component should include all emission from the neutron star photosphere.The underly-ing idea is that the non black-body component arises fromE.Kuulkers et al.:X-ray bursts in GX17+29Fig.7.Same as Fig.5,but5s before and10s after the start of the last four bursts observed in1999Oct(b7–b10),at a time resolution of0.125s.Fig.8.Leftmost panel:Two-component spectralfit results for the total burst emission of burst b4plotted on a logarithmic time scale.Thefilled circles and open squares represent thefit results of the0.25s and16s spectra, respectively.The data have been logarithmically rebinned in time for clarity.The values for the persistent black-body component have been indicated by a dotted line.Right panels:Two-component spectralfit results for the0.25s spectra of the total burst emission of burst b1,b4and b6,see text.The values for the persistent black-body component have been indicated by a dotted line for burst b1and b4.Both panels:from top to bottom:bolometric black-bodyflux,F bb, in10−8erg s−1cm−2,black-body temperature,kT bb,apparent black-body radius,R bb,10,at10kpc,and goodness of fit expressed inχ2red.For bursts b1,b4and b6the number of dof is22,18and16,respectively,for the0.25s spectral fits.For burst b4the number of dof is44for the16s spectralfits.Note the difference in scales ofχ2red in the leftmost panel with respect to the other panels.10 E.Kuulkers et al.:X-ray bursts in GX17+2Fig.9.a :At the top the first 16s spectrum observed after the start of burst b2is displayed.A two-component fit is shown,i.e.a single black-body and cut-offpower-law plus Gaussian line (subjected to interstellar absorption).The parameters of the cut-offpower-law component plus Gaussian line are fixed to the values derived for the persistent emission.At the bottom the residuals after subtracting the best model from the observed spectrum is displayed.The fit is clearly bad (χ2red /dof=24.2/44).b :At the top the same first 16s spectrum at the beginning of burst b2is displayed.Now a three-component fit is shown,i.e.two black-body components and one cut-offpower-law component (subjected to interstellar absorption).The cut-offpower-law and one black-body component parameters are fixed to the values derived for the persistent emission.At the bottom the residuals after subtracting the best model from the observed spectrum is displayed.The fit has clearly improved (χ2red /dof=1.8/44).the accretion process,and is not influenced by the X-ray burst.GX 17+2is a bright X-ray source,and presumably the neutron star contributes significantly to the persistent emission (Van Paradijs &Lewin 1986;Sztajno et al.1986).Since the source is bright,compared to most other burst sources the net flux at the peak of the burst relative to the persistent flux is rather low.Sztajno et al.(1986)found that the black-body component contributed ≃40%to the persistent emission just before the two bursts observed by ing the ‘standard’burst spectral analysis Sztajno et al.(1986)found relatively high black-body tem-peratures (kT bb ≃2–3keV)and relatively small apparent black body radii at a distance of 10kpc (R bb ,10≃3–5km,for isotropic emission)for the short (≃10s)burst.For the long (>5min)burst,kT bb only showed a small change from ≃2.1keV at the peak of the burst to ≃1.7keV near the end of the burst,with R bb ,10decreasing from ≃7km to ≃4km.Their fits were,however,satisfactory,with χ2red of 0.6–ing the two-component model,Sztajno et al.(1986)found that during the short burst the values for T bb were in the range normally seen in type I X-ray bursts,and that the systematic decrease in R bb had disap-peared.The χ2red values for the two-component model fits ranged between 0.6and 1.3,except for one fit,for which χ2red =1.6,i.e.slightly worse than the ‘standard’spectral analysis.They attributed this to the smaller relative er-ror in the total burst data than in the net-burst data,for which the persistent emission was subtracted.Note that in this case Sztajno et al.(1986)found a slight increasein R bb ,10,apparently anti-correlated with T bb ,which they argue was due to the non-Planckian shape of the spectrum of a hot neutron star (van Paradijs 1982;see Titarchuk 1994;Madej 1997,and references therein;see,however,Sect.5.2).3.2.2.2Our RXTE resultsGuided by the results of Sztajno et al.(1986)discussed in Sect.3.2.2.1,we first fitted the total burst data using a black body and a cut-offpower law plus a Gaussian line.The parameters of the absorbed cut-offpower law and Gaussian line were fixed to the values found for the persistent emission before the burst (Table 3).Using this model we obtained good fits to the 16s spectra of bursts b6and b7,for which the persistent emission did not con-tain a significant black-body contribution (χ2red of ≃1for 37dof).However,the 16s spectral fits were bad when-ever the persistent emission spectra contained a black-body component;the fits became worse as the persis-tent black-body contribution became stronger (for the first ∼100s of the burst:χ2red /dof ≃1.5–3/37[burst b8],χ2red /dof ≃2.5–8/37[burst b9],χ2red /dof ≃5–10/37[burstb10],χ2red /dof ≃20–24/44[burst b4],χ2red /dof ≃22–25/44[burst b2]).The worst χ2red occurred near the peak of the bursts.For instance,Fig.8shows the best-fit parameters and χ2red for burst b4,for which the persistent emission had a black-body contribution of ≃28%(2–20keV).An example of a burst spectrum and the result of the two-component fit is shown in Fig.9a for burst b2.The χ2red。
粒子特效中英文
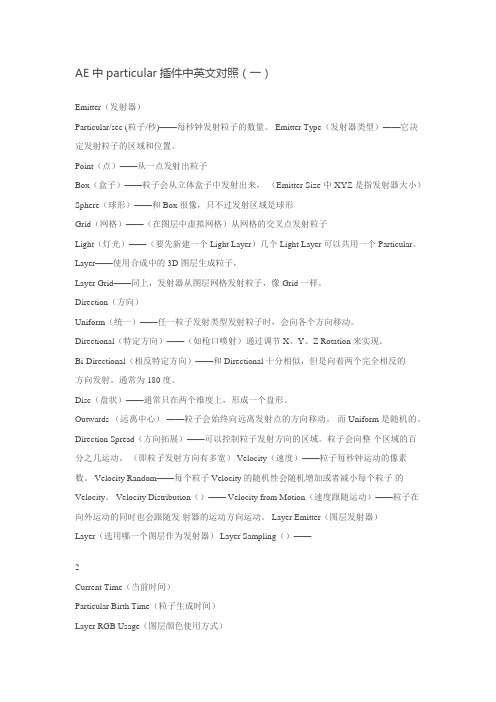
AE中particular插件中英文对照(一)Emitter(发射器)Particular/sec (粒子/秒)——每秒钟发射粒子的数量。
Emitter Type(发射器类型)——它决定发射粒子的区域和位置。
Point(点)——从一点发射出粒子Box(盒子)——粒子会从立体盒子中发射出来,(Emitter Size中XYZ是指发射器大小)Sphere(球形)——和Box很像,只不过发射区域是球形Grid(网格)——(在图层中虚拟网格)从网格的交叉点发射粒子Light(灯光)——(要先新建一个Light Layer)几个Light Layer可以共用一个Particular。
Layer——使用合成中的3D图层生成粒子,Layer Grid——同上,发射器从图层网格发射粒子,像Grid一样。
Direction(方向)Uniform(统一)——任一粒子发射类型发射粒子时,会向各个方向移动。
Directional(特定方向)——(如枪口喷射)通过调节X、Y、Z Rotation来实现。
Bi-Directional(相反特定方向)——和Directional十分相似,但是向着两个完全相反的方向发射。
通常为180度。
Disc(盘状)——通常只在两个维度上,形成一个盘形。
Outwards (远离中心)——粒子会始终向远离发射点的方向移动。
而Uniform是随机的。
Direction Spread(方向拓展)——可以控制粒子发射方向的区域。
粒子会向整个区域的百分之几运动。
(即粒子发射方向有多宽) Velocity(速度)——粒子每秒钟运动的像素数。
Velocity Random——每个粒子Veloc ity的随机性会随机增加或者减小每个粒子的Velocity。
Velocity Distribution()—— Velocity from Motion(速度跟随运动)——粒子在向外运动的同时也会跟随发射器的运动方向运动。
vig_tutorial_2008

Units per year
~ 3 x 10⁹
Unit price, typical
~$1 ($0.1 to 3,000)
Worldwide market, $/year
~$4B
1-2
J.Vig@
Approved for public release. Distribution is unlimited
NOTICES
Disclaimer
The citation of trade names and names of manufacturers in this report is not to be construed as official Government endorsement or consent or approval of commercial products or services referenced herein.
Why This Tutorial?
“Everything should be made as simple as possible - but not simpler,” said Einstein. The main goal of this “tutorial” is to assist with presenting the most frequently encountered concepts in frequency control and timing, as simply as possible. I have often been called upon to brief visitors, management, and potential users of precision oscillators, and have also been invited to present seminars, tutorials, and review papers before university, IEEE, and other professional groups. In the beginning, I spent a great deal of time preparing these presentations. Much of the time was spent on preparing the slides. As I accumulated more and more slides, it became easier and easier to prepare successive presentations. I was frequently asked for “hard-copies” of the slides, so I started organizing, adding some text, and filling the gaps in the slide collection. As the collection grew, I began receiving favorable comments and requests for additional copies. Apparently, others, too, found this collection to be useful. Eventually, I assembled this document, the “Tutorial”. This is a work in progress. I plan to include additional material, including additional notes. Comments, corrections, and suggestions for future revisions will be welcome.
Dec(J2000)2639319

Swift Observations of GRB 060926S.T. Holland (GSFC/USRA), S.D. Barthelmy (GSFC), R. Starling (U.Leicester), L.M. Barbier (GSFC), M. Perri (ASDC), M. Capalbi (ASDC), P. Roming (PSU), K. Page (U.Leicester),J. Nousek (PSU), N. Gehrels (GSFC)for the Swift Team0. REVISIONSCorrected the mistake about which UVOT detections were retracted. In version 1 it was erroneously stated that both the UVW1- and V-band detections were retracted. This is wrong. Only the UVW1-band data point was retracted; the V-band detection still stands. Changed conversion factor in Fig 2 caption.1. INTRODUCTIONBAT triggered on GRB 060926 at 16:48:41 UT (Trigger=231231) (Holland, et al., GCN Circ. 5612). This was a 1.024-sec rate trigger. Swift slewed immediately to this burst, and the XRT & UVOT began making follow-up observations. Our best position is the UVOT location: RA,Dec(J2000)=263.9319,+13.0385 with a 1-sigma error radius of 0.5arcsec. The initial UVOT UVW1-band detection of an afterglow was later retracted. This burst has a spectroscopic redshift of 3.208 by the MISTICI collaboration using the VLT (V. D'Elia et al., GCN Circ 5637).2. BAT OBSERVATION AND ANALYSISUsing the data set from T-119 to T+183 sec, we report further analysis of GRB 060926 (Holland, et al., GCN Circ. 5612). The BAT ground-calculated position is RA,Dec(J2000) = 263.925, 13.039 deg {17h35m 41.9s, 13d 2' 21.5"} ± 1.4 arcmin, (radius, sys+stat, 90% containment). The partial coding was 94% (the bore sight angle was 9.1 deg).The mask-weighted lightcurve (Fig 1) shows a single FRED peak starting at T-1 sec, peaking at T+1 sec, and ending at ~T+10 sec. T90 (15-350 keV) is 8.0 ± 0.1 sec (estimated error including systematics).The time-averaged spectrum from T-0.1 to T+8.6 sec is best fit by a simple power-law model. The power law index of the time-averaged spectrum is 2.54 ± 0.23. The fluence in the 15-150 keV band is 2.2±0.3 x 10⁻⁷ erg/cm2. The 1-sec peak photon flux measured from T+0.38 sec in the 15-150 keV band is 1.1±0.1ph/cm2/sec. All the quoted errors are at the 90% confidence level.3. XRT OBSERVATION AND ANALYSISXRT began follow-up observations at T+60 s.We have analyzed the whole XRT data set on the GRB 060926 (Holland, et al., GCN Circ. 5612). A 4.7 ks Photon Counting mode image provides a refined XRT position: RA,Dec(J2000) = 17h 35m 43.93s, +13d 02' 18.4" with an uncertainty of 5.9" (90% containment, including bore sight uncertainties). This is 29.8" away from the center of the BAT refined position (Cummings et al., GCN Circ. 5621). This localization lies 11.3" from the initial XRT position.The 0.3-10 keV X-ray light curve (Fig 2) during the first orbit shows a flare at T+430s. From the second orbit a power-law decline with a temporal index of -1.4±0.3 is observed.The X-ray spectrum covering the time period from T+67s to T+878s is well fit by an absorbed power-law with a photon index of 2.1(±0.3) and column density of (2.2±0.9)e21 cm-2. We note the Galactic column density in the direction of the source is 7.3e20 cm-2.4. UVOT OBSERVATION AND ANALYSISThe UVOT began observing GRB 060926 57 seconds after the BAT trigger (Holland et al., GCN Circ 5612). A source was detected at the 4.8-sigma level in the V filter, located at RA(J2000) = 17:35:43.66 = 263.9319deg, DEC(J2000) = +13:02:18.6 = 13.0385deg, with a 1-sigma error radius of 0.5 arc sec. The source has a magnitude of 19.0+/-0.2 as determined by the Swift analysis tool, uvotsource, (Roming & Holland, GCN Circ 5625). The initial 4.3-sigma level detection of a source in the UVW1 filter was later retracted (Roming & Holland, GCN Circ 5645).No optical afterglow is detected at the 3-sigma level in individual or coadded exposures in the UVOT UVW1-, UVW2-, UVM2-, U-, or B-filters. The 3-sigma limiting magnitudes for the coadded images of the UVOT filters are listed below:Filter T_range(s) Exp(s) Upper Limit (3-sigma)UVW1 487-11748 1337 20.4UVW2 551-6405 432 20.1UVM2 463-10840 1366 20.4U 511-12283 968 20.8B 535-6199 422 20.6where T_range is the start and end times of the coadded exposures. No correction has been made for Galactic reddening along the line of sight (E(B-V) = 0.16).No images were taken in the White-filter by the UVOT since bright stars were in the field-of-view.Fig.1: BAT Lightcurve. The mask-weighted light curve in the 4 individual plus total energy bands. The units are counts/sec/illuminated_detector (note illum_det = 0.16 cm2) and T_zero is 16:48:41 UT.Fig. 2:XRT Lightcurve. There is a flare at T+430 sec. From the second orbit a power-law decline witha temporal index of -1.4±0.3 is observed. The conversion factor from count rate to observed (unabsorbed)0.3-10 keV flux is approximately 1 cnt/s = 4.2x10⁻¹¹ (6.5x10⁻¹¹) erg/cm2s.。
optical flares 英文版

optical flares 英文版Optical flares are a visual phenomenon caused by the interaction of light with the camera lens. They are often used in photography and videography to add a sense of realism or artistic effect. The term "optical flare" refers to the patterns of light that appear when a light source is scattered or diffracted within the lens system of a camera. This effect can be seen in everyday life when looking at bright lights, but it is particularly pronounced and sought after in visual media for its dramatic impact.The creation of an optical flare involves several physical processes. When light enters a camera lens, it passes through various elements and coatings designed to focus and direct the light onto the camera's sensor. However, imperfections in the lens elements, such as dust or scratches, as well as the inherent design of the lens, can cause some of the light to scatter. This scattered light creates the streaks and halos characteristic of an optical flare.In addition to natural occurrences, optical flares can be artificially created using software. Visual effects artists often use computer-generated imagery (CGI) to add flares in post-production. This allows for greater control over the appearance and intensity of the flare, enabling artists to match the flare to the mood and style of the scene.One of the most popular tools for creating and customizing optical flares in post-production is the Optical Flares plugin for Adobe After Effects. Developed by Video Copilot, this plugin provides a wide range of options for simulating realistic lens flares. Users can choose from a library of preset flares or create their own custom flares by adjusting various parameters such as brightness, color, position, and complexity.The use of optical flares in film and video can serve multiple purposes. They can be used to simulate the natural reaction of a camera to bright lights, which can help to ground computer-generated elements in reality. Flares can also be used to draw the viewer's attention to a particular part of the frame or to convey a character's point of view. In some cases, flares are used purely for their aesthetic value, adding a sense of dynamism and energy to a shot.While optical flares can enhance the visual appeal of a scene, they must be used judiciously. Excessive or inappropriate use of flares can distract from the narrative and reduce the overall impact of the scene. Therefore, filmmakers and visual effects artists must carefully consider when and how to incorporate flares into their work.In conclusion, optical flares are a powerful tool in the visual artist's toolkit. Whether occurring naturally or crafted in post-production, they can add depth, emotion, and realism to a scene. As technology advances, the ability to create and manipulate optical flares becomes increasingly sophisticated, offering endless possibilities for enhancing visual storytelling. The key to effective use of optical flares lies in the balance between artistic expression and narrative clarity, ensuring that each flare serves a purpose and contributes to the overall vision of the project. 。
浩瀚电子 KDL-46NX700 46英寸 BRAVIA NX700系列 HDTV 产品说明书

Key FeaturesFull HD 1080p ResolutionEdge LED Backlighting with Monolithic Design Motionflow™ 120Hz Technology for Smooth Motion Built-in Wi-Fi®1BRAVIA® Internet Video & Widgets 2BRAVIA Engine™ 3 fully digital video processorLightSensor™ adjusts backlight with room light USB port for photos, music & video playback 3 Energy Saving Switch eliminates standby power Key TechnologiesFull HD 1080p Resolution Experience Full HD 1080p picture quality, the highest at-home resolution,and take full advantage of HD sources like a Blu-ray Disc™ Player or PlayStation®3 gaming console via the 16:9 wide screen panel (1920 x 1080).Edge LED backlight Enjoy a slim design plus amazing dynamic contrast with an Edge LED backlight.Motionflow™ 120Hz Technology Experience smooth motion detail and clarity with Motionflow™120Hz technology. Motionflow™ 120Hz technology doubles the frame rate from the standard 60frames per second and applies Image Blur Reduction technology to deliver a crisp, fluid and realistic viewing experience during fast-action scenes.Built-In Wi-Fi® Enjoy the convenience of built-in wireless connectivity to your home entertainment network and make accessing your online entertainment - including movies, photos, music, videos and more - even easier!1 BRAVIA® Internet Video Instantly stream a wide variety of movies, TV episodes, videos and musicfrom a large selection of entertainment apps including: Netflix®, YouTube™, Slacker® - the list goes on and on.2 BRAVIA® Internet Widgets Personalize your viewing experience by adding information apps toyour screen so you can instantly access the latest local news, weather, sports headlines and Twitter® updates.2 BRAVIA Engine™3 Enjoy Sony's most advanced processing system for superior image detail,exceptionally vibrant, life-like images, reduced noise and optimized contrast and color with the BRAVIA Engine™ 3 fully digital processor.LightSensor™ Technology Automatically increase or decrease the level of brightness of your TV'sbacklight based on a room's lighting conditions with the integrated LightSensor™ technology. Dim the lights to watch a movie and the sensor dims the backlight, which also helps reduce unnecessary power consumption.USB Input Share your photos on the big screen or listen to your favorite music. Simply connectyour digital camera, USB-enabled MP3 player, or USB storage device directly to your HDTV's USB input.3 Energy Saving Switch Eliminate standby power consumption without having to unplug your TV.Simply turn the Energy Saving Switch to off position and the TV no longer draws energy from the power source.Sony Electronics Inc. • 16530 Via Esprillo • S an Diego, CA 92127 • 1.800.222.7669 • w Last Updated: 02/22/2010Please visit the Dealer Network for currentinformation at /dnFeaturesGeneralClosed Captions (CC): Analog, Digital Illuminated Sony Logo: Yes Finish (Surface Color): Black XMB: YesAudio Return Channel: Yes HDMI™ InstaPort: YesDisplayBacklight Type: LED Display Device: LCD Deep Black Panel: YesVideoVideo Processing: BRAVIA Engine 3™ TechnologyCineMotion® Reverse 3:2 Pulldown Technology: Yes Wide Mode: Normal, Zoom, Wide Zoom, Full (Full1-2 for PC), H Stretch Deep Color: Yes 3D Comb Filter: YesPhotoTV HD: YesMPEG Noise Reduction: Yes Auto Wide: Yes 4:3 Default: Yes24p True Cinema™ Technology: YesPicture Mode: Vivid, Standard, Custom, Cinema, Game-Standard, Game-Original, Graphics, Sports, Photo-Vivid, Photo-Standard, Photo-Original, Photo-Custom Advanced Contrast Enhancer (ACE): Yes Motionflow™ Technology: 120Hz Cinema Mode: YesLive Color™ Technology: YesAudioAuto SAP: 20FM/10AMAuto Mute (on no signal): YesSteady Sound® Automatic Volume Control: Yes Audio Out: Variable/Fixed Sony Original Surround: Yes Stereo System: MTS Dolby®: Dolby® DigitalAlternate Audio (Digital): yesSurround Effect: Cinema, Music, Live Sports, Game5.1 Channel Audio Out: YesSound Mode: Dynamic, Standard, Clear Voice, Custom5.1ch Through Out (Handycam): Yes Sound Enhancer: YesClear Voice: YesInvisible Speaker (w/Sound Elevation): YesConvenienceChannel Jump: YesMultiple Language Display: English, French, Spanish Info Banner: TV Guide on Screen, PSIP, XDS Sleep Timer: YesInput Skip: Automatic Channel Surf: YesChannel Block (with password): Yes Edit Channel Labels: Yes Label Inputs: YesOn/Off Timer: YesUSB Application(s): Photo Viewer (jpeg), Photo Viewer (RAW), Music Player (mp3), Video Player (AVCHD), Video Player (AVC), Video Player (MPEG4) Theatre Mode (Theatre Button): YesShow/Hide Channels: YesAuto Shut-off: YesBRAVIA® Sync™: Yes Parental Control: YesBRAVIA® Sync™ Menu Button: Yes (on Remote Control)On-Screen Display for External Input: Yes PIP (Picture in Picture): PC Input(HDMI)/TV Channel&CVBS Channel Labels: YesAuto Photo Mode: via HDMI, via DLNA, via USB On-Screen Clock: YesPicture Adjustments Lock: Yes White Balance: RGB Gain/BiasAuto Picture Setting w/HDMI™: Cinema, Sport, Music, Photo, Graphics, Game Internet Radio: YesScene Select: Auto, Cinema, Sports, Photo, Music, Game, Graphics, OFFTheatre Mode with Cinema Surround: Yes TV Guide On-Screen: YesStand Tilt: YesStand Tilt Range: 2position 0°/ Back 6° On-Screen Operating Instructions: Yes Favorites: YesPicture Frame Mode: Yes Quick Start: YesStand Swivel: YesStand Swivel Range: Left 20°/Right 20° Start Up Sony Logo Display: Yes USB Player: YesWireless LAN: Integrated Upward Style: YesNetworkDLNA: YesBRAVIA® Internet Video: Ready BRAVIA® Internet Widgets: Yes Photo MAP: YesSpecificationsDisplayViewing Angle (Right/Left): 178(89/89) Viewing Angle (Up/Down): 178(89/89) Dynamic Contrast Ratio: InfiniteScreen Size (measured diagonally): 46"Display Resolution: Full HD 1080(1920x1080) Aspect Ratio: 16:9TV SystemTuner (Cable): Clear QAMTuner (Terrestrial): ATSC™ / NTSC Channel Coverage: VHF: 2-13ch UHF: 14-69chCATV (analog): 1-135ch CATV (digital) : 1-135ch TV System (Analog): MNumber of Tuners (Digital): 1(Hybrid)TV System (Digital): ATSC Color System: NTSCVideoVideo Signal: 1080/60p (HDMI™ / COMPONENT), 1080/60i, 1080/24p (HDMI™ ONLY), 720/60p, 480/60p, 480/60iAudioAudio Power Output: 20W (10W x 2) Speakers (Total): 2Speaker Configuration: 2Inputs and OutputsComponent Video (Y/Pb/Pr ) Input(s): 1(1 Side) (Composite input common use))Composite Video Input(s): 2 ( 1 Side (Component input common use)/ 1 Rear) Digital Audio Output(s): Optical Digital Output - 1 (Rear)RF Connection Input(s): 1 (Rear)Analog Audio Input(s) (Total): 3 (2 Side/1 Rear) Audio Out: 1 (Rear)HDMI™ Connection(s) (Total): 4(2 Side/2 Rear) PC In (D-Sub) + Audio In (Stereo Mini): 1 (Side) USB 2.0: 1 (Side)HDMI™ PC Input: Yes (see owner's manual for supported timings) AC Power Input: 1 (Rear)Ethernet Connection(s): 1 (Rear)PowerPower Consumption (in Standby): 0.17W Power Requirements (voltage): AC 120V Power Requirements (frequency): 60HzPower Consumption (in Operation) max.: 129WPower Consumption (in Download Acquisition Mode): Less than 16 WRegulation and Standard ComplianceVESA® Hole Spacing Compatible: Yes VESA® Hole Pitch: 300x300 M6Service and Warranty InformationLimited Warranty Term: 1 Year Labor / 1 Year Parts Online Instruction Manual (Reference Book): YesEnergy Saving & EfficiencyLightSensor™ Technology: Yes Power Saving Modes: Yes Eco Settings: YesDynamic Backlight Control: Yes Backlight Off Mode: YesEstimated Annual Energy Consumption (kWh): 163.3kWh/year Idle TV Standby: YesEnergy Saving Switch: YesRecycled & Recyclable MaterialsProduct Materials: Recycled Carton (more than 40%)DimensionsWeight: 61.3 lbs. (27.8kg) with pedestal; 52.9 lbs. (24kg) without pedestal Measurements: 44.375 x 29 1/2 x 12 5/8 in (1127 x 748 x 320mm) with pedestal; 44.375 x 28 1/4 x 2.625 in (1127 x 716 x 64mm) without pedestalSupplied AccessoriesRemote Control (RM-YD037)Batteries (Type AAA x2) AC Power CordScrews (for pedestal, 4-screws)Table Top Stand (separate, pre-assembled)Optional AccessoriesWallmount Bracket (SU-WL700)UPC Code: 027*********1. Wireless router required (sold separately). Requires a compatible 802.11n access point. Some functionality may require Internet services.2. Connection speed of at least 2.5 Mbps recommended (10 Mbps for HD content). Video quality and picture size vary and are dependent upon broadband speed and delivery by content provider. Select content provided subject to change. Premium content may require additional fees and/or PC registration3. USB device must be formatted FAT-32.4. Dynamic contrast ratio compares the luminance of a 100 IRE (white) signal with that of a 0 IRE (black) signal. When the TV receives a 0 IRE signal the backlight is turned off and the luminance measurement is 0.00 cd/m . The resulting dynamic contrast ratio is infinite. © 2010 Sony Electronics Inc. All rights reserved. Reproduction in whole or in part without written permission is prohibited. Sony, BRAVIA, Motionflow, BRAVIA Engine, LightSensor, make.believe, and the Sony logo, Full HD 1080p logo and BRAVIA logo are trademarks of Sony. PlayStation is a trademark of Sony Computer Entertainment. Blu-ray Disc is atrademark. All other trademarks are trademarks of their respectiveowners. Features and specifications are subject to change without notice. Non-metric weights and measures are approximate and may vary.2。
Characterizing X-ray Variability of TeV Blazars

a r X i v :0806.4243v 1 [a s t r o -p h ] 26 J u n 2008Characterizing X-ray Variability of TeV Blazars ∗Speaker.F2av, a(f)=1n n−1∑j=0F j sin(2πft j),(2.1)where F j is the source count rate at time t j(0≤j≤n−1),T is the data length of the time series and F av is the mean value of the source counting rate.The power due to the photon counting statistics is given byσ2stat.With our definition,integration of power over the positive frequencies is equal to half of the light curve excess variance(e.g.,Nandra et al.1997).To calculate the NPSD of certain data sets,it is recommended to make light curves of two different bin sizes shorter/longer than orbital gaps(e.g.,256and5760sec,respectively).Each light curve is divided into“segments”,which are defined as the continuous part of the light curve.∑[a(t)−a(t+τ)]2,(2.2) N∑UDCF i j(τ),(2.4)Mwhere M is the number of pairs in the bin.The DCF advantages are that it uses all the data points available,does not introduce new errors through interpolation,and calculates a meaningful error estimates.The standard error for each bin(∑[UDCF i j−DCF(τ)]2)1/2.(2.5)M−1As an application,Figure5shows an example to see time-lag in the light curve of PKS 2155−304(Kataoka et al.2000).The data reveal a largeflare at the beginning,followed by lower amplitudefluctuations.The source variability is somewhat different in different energy bands.No-tably,amplitude offlux change is larger at higher photon energies;a factor of2at1.5−7.5keV (red),while it is a factor of1.5in the0.5−1.5keV(blue).Also note that the peak of the light curve in the hard X-ray bands leads that in the soft X-ray bands by∼4−5ksec.This was also suggested by directfitting of the light curves with a simple Gaussian plus constant offset,resulting that a lag of the peaking time by≃4ksec.We therefore computed the cross correlations using the the DCF by dividing the0.5−7.5keV range intofive energy bands and measured the time lag for each light curve compared to the3.0−7.5keV light curve.The results are shown in Figure5(right),again suggesting≃4ksec lags in the X-ray variability of PKS2155−304.As we have seen in§1,reality of this small amount of lag is still matter of debate,due to the periodic gaps(∼6ks)of low-Earth orbit satellites(e.g.,Edelson et al.2001).Meanwhile,it is also suggested that lags on hour-scale can hardly be produced by periodic gaps based on careful simulations(e.g.,Tanihata et al.2001;Zhang et al.2004).To quickly follow their arguments,I have made hundreds pairs of light curves by Monte Carlo simulation,one of which is artificially “lagged”by4ksec.Then the resultant light curves arefiltered by the same window as the actual observation.Figure6(le ft)shows an example pair of light curves thus produced,and Figure6 (right)shows the calculated DCF for10pairs of light curves.It seems that the DCF exhibits large uncertainties but the peak of the DCF is always retained as expected(i.e.,4ksec).Obviously, higher quality X-ray data which are less affected by window sampling is strongly awaited forSource Name Redshift Class Flux(2-10keV)Flux(≥100MeV)[10−12erg/cm2/s][10−5ph/cm2/s] Table1:A list of“VIP”blazars to be simultaneously observed with GLAST and Suzaku in2008/09.Figure7:An expected X-ray sky map for1day exposure with MAXI.an unprecedented accuracy.Coordinated observations between GLAST and X-ray satellites are crucial for further understanding the nature of various types of blazars.Another important mission for future blazar studies will be the Monitor of All-sky X-ray Image (MAXI).MAXI is an X-ray all-sky monitor which is currently scheduled to be attached to the Japanese Experiment Module-Exposed Facility(JEM-EF)on the International Space Station(ISS) in early2009.The MAXI carries two scientific instruments:the Gas Slit Camera(GSC)and the Solid State-slit Camera(SSC).The GSC consists of position-sensitive proportional counters with large collecting area of5350cm2in2−30keV range,while the SSC is utilizing32X-ray CCD chips covering an energy range of0.5-12keV.The MAXI has two sets of GSC and SSC orthogonally oriented,each of which covers a narrow instantaneousfield of view of1.5deg times 160deg that sweeps over the whole sky during every orbit of90minutes.Thus a certain sky area is generally monitored twice in an orbit.The expected detection sensitivity for the GSC is ∼5mCrab in a day and∼1mCrab in one month,which is higher by a factor of5than that of11。
广西大学天体物理学科介绍

Corrections:
k-correction, Galactic extinction (No correction for host galaxy extinction )
7
光度分布
Global lightcurves
( L)
0
ቤተ መጻሕፍቲ ባይዱ
[(
L Lb
)1
( L Lb
)2 ]1
(2)GRB rate: dN RGRB (z) dV (z)
dzdt 1 z dz
RGRB (z) RSFR (z)( , z)
(3)Extinction:
RSFR
(
z)
(1 (1
z
z)3.44 , z ) , 3.44
peak
z
z
peak
Function 3. MC simulation 4. Robotic 60-cm Telescopes of GXU-NAOC Center 5. Summary and Discussion
2
1.伽玛暴
伽玛射线暴(Gamma-Ray Burst,GRB) 是宇宙学距离上的宇宙大爆炸以来的最 强的能量爆发事件,它的主要特点是伽 玛射线波段流量突然增强,以及具有的 瞬时性,能量高,时标短,光变曲线复 杂多变等特点。
6
Data selection
Sample:
Full sample of GRBs with optical afterglow detection from 1997-2012, 230 GRBs included
146 well-sampled LCs for our analysis. Most of them were observed in the R-band.
- 1、下载文档前请自行甄别文档内容的完整性,平台不提供额外的编辑、内容补充、找答案等附加服务。
- 2、"仅部分预览"的文档,不可在线预览部分如存在完整性等问题,可反馈申请退款(可完整预览的文档不适用该条件!)。
- 3、如文档侵犯您的权益,请联系客服反馈,我们会尽快为您处理(人工客服工作时间:9:00-18:30)。
a r X i v :a s t r o -p h /0602135v 1 6 F eb 2006Late-Time X-ray Flares during GRB Afterglows:Extended Internal Engine ActivityA.D.Falcone ∗,D.N.Burrows ∗,P.Romano †,S.Kobayashi ∗∗∗,zzati ‡,B.Zhang §,S.Campana ¶,G.Chincarini ¶ ,G.Cusumano ††,N.Gehrels ‡‡,P.Giommi §§,M.R.Goad ¶¶,O.Godet ¶¶,J.E.Hill ∗∗∗‡‡,J.A.Kennea ∗,P.Mészáros ∗†††,D.Morris ∗,J.A.Nousek ∗,P.T.O’Brien ¶¶,J.P.Osborne ¶¶,C.Pagani ∗,K.Page ¶¶,G.Tagliaferri †and the Swift XRT Team ‡‡‡∗Department of Astronomy &Astrophysics,525Davey Lab.,Penn.State University,UniversityPark,PA 16802,USA †INAF-Osservatorio Astronomico di Brera,Via Bianchi 46,23807Merate,Italy ∗∗Astrophysics Research Institute,Liverpool John Moores University,Birkenhead CH411LD,UK ‡JILA,University of Colorado,Boulder,CO 80309,USA §Department of Physics,University of Nevada,Las Vegas,NV ¶INAF –Osservatorio Astronomico di Brera,Merate,Italy Universitàdegli studi di Milano-Bicocca,Dipartimento di Fisica,Milano,Italy ††INAF-Istituto di Fisica Spazialee Fisica Cosmica sezione di Palermo,Palermo,Italy ‡‡NASA Goddard Space Flight Center,Greenbelt,MD §§ASI Science Data Center,via Galileo Galilei,00044Frascati,Italy ¶¶Department of Physics and Astronomy,University of Leicester,Leicester,UK ∗∗∗USRA,10211Wincopin Circle,Suite 500,Columbia,MD,21044-3432,USA †††Department of Physics,Penn.State University,University Park,PA 16802,USA ‡‡‡Abstract.Observations of gamma ray bursts (GRBs)with Swift produced the initially surprising result that many bursts have large X-ray flares superimposed on the underlying afterglow.These flares were sometimes intense,rapid,and late relative to the nominal prompt phase.The most intense of these flares was observed by XRT with a flux >500×the afterglow.This burst then surprised observers by flaring again after >10000s.The intense flare can be most easily understood within the context of the standard fireball model,if the internal engine that powers the prompt GRB emissionis still active at late times.Recent observations indicate that X-ray flares are detected in ∼1/3of XRT detected afterglows.By studying the properties of the varieties of flares (such as rise/fall time,onset time,spectral variability,etc.)and relating them to overall burst properties,models of flare production and the GRB internal engine can be constrained.INTRODUCTIONSince its launch on 2004November 20,Swift [1]has provided detailed measurements of numerous gamma ray bursts (GRBs)and their afterglows with unprecedented reaction times.By detecting burst afterglows promptly,and with high sensitivity,the properties of the early afterglow and extended prompt emission can be studied in detail for the first time.This also facilitates studies of the transition between the prompt emission and the afterglow.The rapid response of the pointed X-ray Telescope (XRT)instrument [2]on Swift has led to the discovery that large X-ray flares are common in GRBs and occur attimes well after the initial prompt emission.While there are still many unknown factors related to the mechanisms that produce GRB emission,the most commonly accepted model is that of a relativistically expand-ingfireball with associated internal and external shocks[3].In this model,internal shocks produce the prompt GRB emission.Observationally,this emission typically has a timescale of∼30s for long bursts and∼0.3s for short bursts[4].The expandingfireball then shocks the ambient material to produce a broadband afterglow that decays quickly (typically as∝t−α).When the Doppler boosting angle of this deceleratingfireball ex-ceeds the opening angle of the jet into which it is expanding,then a steepening of the light curve(jet break)is also predicted[5].For a description of the theoretical models of GRB emission and associated observational properties,see Mészáros[6],Zhang& Mészáros[7],Piran[8],and Van Paradijs et al.[9].For an alternative explanation that describes both the prompt emission and the afterglow emission with a forward shock, see Dermer&Mitman[10].With the advent of recent Swift-XRT observations of many largeflares at various times after the burst,it is clear that a new constraint on GRB models is available to us.We now know that the few previous observations of relatively smallflux increases [11,12]did not provide a complete picture of the X-rayflaring activity during and following GRBs.Recent observations by XRT indicate thatflares are common,that they can have afluence comparable to the initial prompt emission,and that they have various timescales,spectra,and relativeflux increase factors[13,14,15,16].By studying the properties of theseflares and by delving into the details of the GRB models,the nature of the X-rayflares,and possibly the GRB internal engine,may be elucidated.OVERALL XRT OBSERV ATIONSAs of27December2005,Swift-BAT detected and imaged95GRBs,which extrapolates to a rate of∼100/year.Swift slewed to80of these bursts within200ks,and74%of these observations resulted in detections of an X-ray afterglow.XRT slewed promptly to 59of these bursts within350s,and95%of these observations resulted in detections of an X-ray afterglow.From the sample of56bursts with prompt slews and detections,more than24of them have significant detections of X-rayflares at late times,relative to the nominal prompt emission time frame.In short,>25%of all Swift-BAT detected bursts have significant X-rayflares,and>43%of the bursts with a prompt XRT detection have significant X-rayflares.A FEW REMARKABLE FLARING GRBSTheflaring GRBs discussed below are just a small subset of those observed so far.A more comprehensive sample will be published soon in two forthcoming papers.XRF050406XRF050406was thefirst Swift burst withflaring that was clearly significant,indepen-dent of any supporting observations[15,13].It is worth mentioning that GRB050219aexhibitedflaring,but confidence was not achieved until the higher significance detec-tions offlaring from XRF050406,and then GRB050502B.XRF050406has aflarewith a peak at about210s after the BAT trigger time.Theflare rises above the underly-ing power law decay by a factor of∼6.When the underlying power law decay,whichhas a temporal decay index of1.58±0.17,is subtracted from theflare data,the riseand fall of theflare are nearly symmetric with temporal power law indices of±6.8.The δt/t for thisflare is∼0.2.The underlying decay curve before and after theflare are consistent with a single temporal power law decay.Thisflare did not provide enoughphotons to perform a detailed spectral analysis,but from plotting the band ratio,it couldbe seen that theflare had a harder spectrum at the onset which softened back to that ofthe underlying afterglow as theflare decayed[15].XRF050406is also notable since itwas an X-ray Flash,rather than a classic GRB.This common feature of XRFs and GRBssuggests a potential link between the two classes.GRB050502BGRB050502B is a prime example of a GRB with at least one largeflare at late timesafter the cessation of the initial prompt emission detected by BAT[14,13].The lightcurve from XRT data is shown in Figure1.A giantflare,with aflux increase by a factorof∼500,was observed using XRT.Thefluence during the giantflare,(1.2±0.05)×10−6erg cm−2in the0.2–10keV band,was slightly above that during the initial prompt emission detected by BAT.Theflare rises to a sharp peak at743±10s,but this appears to be on top of a broader peak that extends from640±20s to790±20 s.In the hard band(1–10keV),there is significant time structure within the peak of the giantflare itself.During theflare,the spectrum can befit best by an absorbed cutoff power law(or Band function)[17],rather than a simple absorbed power law,whichfits the underlying afterglow nicely.For details,see Falcone et al.[14].The spectral index hardens significantly during theflare(with a cutoff energy of∼2.5keV in the XRT band) before returning back to a softer and more typical afterglow spectrum after theflare has ended.Before and after theflare,the temporal decay of the underlying afterglow can be fit well with a single power law∼t−0.8±0.2.At much later times,between(1.9±0.3)×104s and(1.1±0.1)×105s,there are two broad bumps(or possibly one broad bump with some structure).These bumps are notable in themselves since they could be more flaring,or they could be due to a combination offlaring and energy injection into the forward shock.FIGURE1.X-ray light curve of GRB050502B.Open circles are window timing mode data,and dots are photon counting mode data.For details,see Falcone et al.[14].GRB050607GRB050607is notable due to the fast rise of one of its multipleflares[18].The second,and brightestflare,had a peak at∼310s.To borrow a term from prompt GRB descriptions,thisflare was FRED-like(fast-rise,exponential-decay),with a very steep rise.The temporal power law index was∼22if one placed t0at the burst trigger time, and it was∼4.1if one places t0at the time of theflare onset[18].Theδt/t for thisflare is∼0.2.Flaring Short burstsThe exceptional short burst,GRB050724,exhibited significantflaring detected by XRT(for details,see Barthelmy et al.[19]).There were severalflare-like features.In particular,there is the broad bump detected with a peak at∼5×10⁴s.It is also possible that GRB051227,which has a significant X-rayflare peaking at ∼110s,is a short burst[20].However,there is some ambiguity in its characterization as short or long.Flaring from High Redshift burstsGRB050904,at a redshift of6.29,is the most distant GRB detected to date.This burst has a very interesting X-ray light curve(see Figure2)with manyflares superimposed on top of the underlying temporal decay,and on top of one another[21].Even after a transformation of the light curve into the rest frame of the GRB,there is significant flaring at times as late as∼5000s.In addition to GRB050904,there are other moderately high redshift bursts with multipleflares(e.g.GRB050730at z∼4).As more data arrive fromflaring GRBs,Rest frame Time (s)101010101010R e s t f r a m e F l u x (e r g /s e c /c m 2)FIGURE 2.Background-subtracted X-ray light curve of GRB 050904,transformed into the rest frame for z=6.29.The BAT data points are from an extrapolation into the XRT energy range (black points,from 0-75s)superimposed on the XRT light curve (20-10,000s).For details,see Cusumano et al.[21].it will be interesting to compare all of the redshift corrected rest frame light curves.While the high redshift certainly makes the emission more extended in the observer frame,these bursts are remarkably sporadic at late times,even in the rest frame.DISCUSSION AND CONCLUSIONSIt is clear that we now have a recently realized characteristic of GRBs that can be used to probe their nature.The X-ray flares have myriad characteristics.Many have very fast rises and decays,whereas others are relatively gradual.Some occur at early times,along with the nominal prompt emission detected by BAT,whereas others occur at very late times (∼105s).They occur during all of the underlying decay curve phases (see Nousek et al.[22],Zhang et al.[23]for discussion of decay phases),with the possible exception of post-jet-break times.Some of the flares are huge,whereas others are small bumps.Some GRBs exhibit many flares,whereas other GRBs have only one.A large fraction of the flares have several characteristics that point towards continued internal engine activity.These characteristics include:1)The temporal decay index before and after many (but not all)flares are identical,indicating that the afterglow had already begun before the flare,2)the rise time and decay time of the flares are frequently very fast (δt /t ≪1),thus the flare is difficult (although not impossible)to explain with mechanisms associated with the external shock (see Ioka et al.[24],Zhang et al.[23]for discussion),3)there is even faster time structure near the peaks of some of the flares,4)the spectra during some flares are represented better by a Band function or cutoff power law model,rather than a simple power law,similar to the nominal prompt emission,5)the hardness before and after some flares is consistent with an afterglow that has already begun before the flare and continues with approximately the same spectral index after the flare,whereas the spectra during some flares are frequently harder than the underlying afterglow.A final piece of supporting evidence for the restarting of the central engine isthat the decay parameters followingflares(and BAT prompt emission)usually imply a t0that is consistent with the onset of the event,when the decay is interpreted as being dominated by the curvature effect;for details,see Liang et al.[25].For at least some GRBs withflares,continued internal engine activity is likely,but someflares allow for the possibility of external shock processes,within the framework of the standardfireball model.It is beyond the scope of this paper to address particular extended internal engine models that can explain theseflare observations.However,it is important to note that any such models must be capable of emission at very late times (>104s),sporadic and repeated emission to explain multipleflares,very fast rise/decay times,and total energy input comparable to that of the initial prompt emission. Studies of the overall properties of a sample of manyflaring GRBs are necessary to truly characterize their nature,and to determine if there are classes.Results from these studies are forthcoming.ACKNOWLEDGMENTSThis work is supported at Penn State by NASA contract NAS5-00136;at the Univ. of Leicester by the Particle Physics and Astronomy Research Council under grant PPA/Z/S/2003/00507;and at OAB by funding from ASI under grant I/R/039/04.REFERENCES1.Gehrels,N.,Chincarini,G.,Giommi,P.,et al.,Astrophys.Journ.,611,1005(2004).2.Burrows, D.N.,Hill,J.E.,Nousek,J.A.,et al.,Space Science Reviews,in press,(2005).;astro-ph/05080713.Mészáros,P.&Rees,M.J.,Astrophys.Journ.,476,232(1997).4.Meegan,C.A.,et al.,Astrophys.Journ.Sup.,106,65(1996).5.Rhoads,J.E.,Astrophys.Journ.,525,737(1999).6.Mészáros,P.,Ann.Rev.Astron.&Astrophys.,40,137(2002).7.Zhang,B.&Mészáros,P.,Int.Journ.of Mod.Phys.A,19,2385(2004).8.Piran,T.,Rev.Mod.Phys.,76,1143(2005).9.van Paradijs,J.,Kouveliotou,C.,&Wijers,R.A.M.J.,Ann.Rev.Astron.&Astrophys.,38,379(2000).10.Dermer,C.D.&Mitman,K.E.,Astrophys.Journ.Lett.,513,L5(1999).11.Piro,L.,et al.,Astrophys.Journ.,623,314(2005).12.in’t Zand,J.J.M.,Heise,J.,Kippen,R.M.,et al.,Proceedings of3rd Rome Workshop,ASP312,18(2003);astro-ph/030536113.Burrows,D.N.,Romano,P.,Falcone,A.,et al.,Science,309,Issue5742,1833(2005).14.Falcone,A.,et al.,Astrophys.Journ.,accepted,(2006).;astro-ph/051261515.Romano,P.,et al.,Astron.&Astrophys.,accepted,(2006).;astro-ph/060117316.Burrows,D.N.,et al.,Proceedings of the X-ray Universe2005Symposium,La Escorial,in press,(2006).;astro-ph/051103917.Band,D.,et al.,Astrophys.Journ.,413,281(1993).18.Pagani,C.,et al.,Astrophys.Journ.,submitted,(2006).19.Barthelmy,S.,et al.,Nature,438,994(2005).20.Barthelmy,S.,et al.,GCN Circular#440121.Cusumano,G.,et al.,Nature,accepted,(2006);astro-ph/050973722.Nousek,J.A.,Kouveliotou,C.,Grupe,D.,et al.,Astrophys.Journ.,accepted(2006).23.Zhang,B.,Fan,Y.Z.,Dyks,J.,et al.,Astrophys.Journ.,accepted(2006).24.Ioka,K.,Kobayashi,S.,&Zhang,B.,Astrophys.Journ.,631,429(2005)25.Liang,E.W.,et al.,in preparation,(2006).。