光源光谱测试报告英文
0603蓝光测试报告13002011
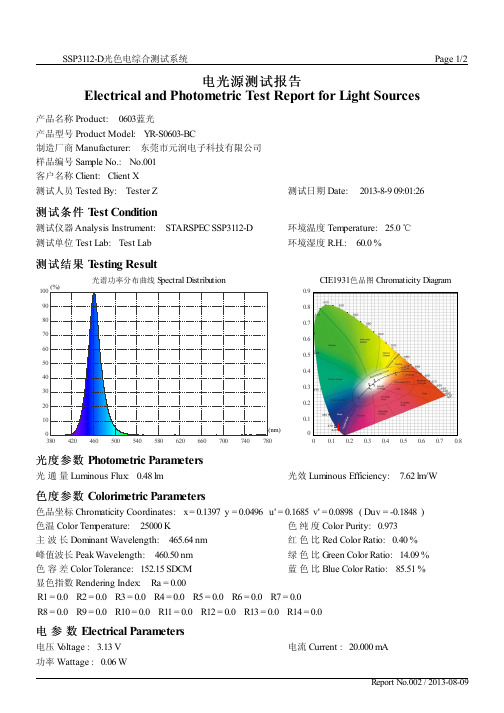
电光源测试报告Electrical and Photometric Test Report for Light Sources产品名称 Product:0603蓝光产品型号 Product Model:YR-S0603-BC制造厂商 Manufacturer:东莞市元润电子科技有限公司样品编号 Sample No.:No.001客户名称 Client:Client X 测试人员 Tested By:Tester Z测试日期 Date:2013-8-9 09:01:26测试条件 T est Condition测试仪器 Analysis Instrument:STARSPEC SSP3112-D 环境温度 Temperature:25.0 ℃测试单位 Test Lab:Test Lab环境湿度 R.H.:60.0 %测试结果 T esting Result光谱功率分布曲线 S pectral DistributionCIE1931色品图 Chromaticity Diagram图CIE19310.10.20.30.40.50.60.70.800.10.20.30.40.50.60.70.80.9光度参数 Photometric Parameters光 通 量 Luminous Flux:0.48 lm光效 Luminous Efficiency:7.62 lm/W色度参数 Colorimetric Parameters色品坐标 Chromaticity Coordinates:x = 0.1397 y = 0.0496 u' = 0.1685 v' = 0.0898 ( Duv = -0.1848 )色温 Color Temperature:25000 K 色 纯 度 Color Purity:0.973主 波 长 Dominant Wavelength:465.64 nm 峰值波长 Peak Wavelength:460.50 nm 红 色 比 Red Color Ratio:0.40 %绿 色 比 Green Color Ratio:14.09 %色 容 差 Color Tolerance:152.15 SDCM 蓝 色 比 Blue Color Ratio:85.51 %显色指数 Rendering Index:Ra = 0.00R1 = 0.0 R2 = 0.0 R3 = 0.0 R4 = 0.0 R5 = 0.0 R6 = 0.0 R7 = 0.0 R8 = 0.0 R9 = 0.0 R10 = 0.0 R11 = 0.0 R12 = 0.0 R13 = 0.0 R14 = 0.0电 参 数 Electrical Parameters电压 V oltage : 3.13 V 电流 Current :20.000 mA功率 Wattage :0.06 W电光源测试报告Electrical and Photometric Test Report for Light Sources色容差图 Color Difference Curve0.3000.3050.3100.3150.3200.3250.3300.3350.3200.3250.3300.3350.3400.3450.3500.355( Y )( X )x = 0.313, y = 0.337ANS I 标准: ANS I/6500K样品图片 Sample Photo。
ies测试报告是什么

IES测试报告是什么IES测试报告是指对照明灯具进行测试以评估其照明性能和能效的报告。
IES (Illuminating Engineering Society)是一个专业组织,致力于照明工程的推进和发展。
该组织制定了一系列标准和规范,包括对照明灯具进行测试和评估的方法。
IES测试报告的重要性IES测试报告对于照明灯具的制造商、供应商和消费者来说,都具有重要的意义。
以下是一些重要的原因:评估照明性能IES测试报告可以对照明灯具的性能进行评估。
它提供了一些关键指标和数据,如照度、颜色温度、色彩指数等,用于衡量灯具的照明效果。
通过这些指标,消费者可以更好地了解灯具的性能,从而做出更明智的购买决策。
提供产品信息IES测试报告还提供了详细的产品信息,如灯具的型号、规格、功率等。
这些信息对于消费者来说非常有用,可以帮助他们了解灯具的基本特性,并在购买时进行比较。
对于照明灯具的制造商和供应商,提供准确的产品信息也有助于建立品牌信誉和市场竞争力。
遵守标准和规范IES测试报告是根据照明工程领域的标准和规范进行的。
通过进行测试和评估,灯具制造商可以确保其产品符合相应的安全和质量标准。
这有助于提高消费者的信任和满意度,并确保照明灯具在使用过程中的稳定性和可靠性。
IES测试报告的内容一个完整的IES测试报告通常包含以下几个部分:项目背景信息报告的开头通常包含一些项目背景信息,如测试的灯具类型、测试的目的和方法等。
这部分信息有助于读者了解整个测试报告的背景和目的。
测试方法和参数这一部分详细描述了测试所采用的方法和参数。
它列出了各种测试项目,包括照度、颜色温度、色彩指数等,以及相应的测试设备和测量方法。
这些详细信息对于后续结果的解释和比较非常重要。
测试结果和分析测试结果和分析部分是整个报告的核心内容。
它展示了每个测试项目的具体结果,并对结果进行了解读和分析。
例如,可以通过给出照度分布曲线图来说明灯具的照明均匀性。
这一部分还可以对测试结果进行比较和对比,以评估不同灯具之间的差异。
可见光光谱 英文
可见光光谱英文The visible light spectrum, encompassing wavelengths ranging from approximately 400 nanometers (nm) to 700 nm,is a narrow slice of the electromagnetic radiation that our eyes are capable of perceiving. This band of wavelengths, although relatively small compared to the vast expanse of the electromagnetic spectrum, plays a pivotal role in our daily lives, shaping our perception of the world around us. At the shorter wavelength end of the visible spectrum, we encounter violet light. Violet waves, with their frequencies exceeding 668 THz, are the highest in energy among all visible colors. As we move towards the red end of the spectrum, wavelengths increase, resulting in lower frequencies and consequently, lower energy levels. Red light, with wavelengths exceeding 700 nm, has the lowest energy among all visible colors.The visible spectrum is not just a random assortment of colors; it is a carefully crafted array of hues that enables us to perceive a wide range of colors. The human eye is equipped with photoreceptors called cones, which are sensitive to specific wavelengths within the visiblespectrum. These cones are primarily sensitive to blue, green, and red light, allowing us to perceive the full range of colors visible to the naked eye.The importance of the visible light spectrum extends beyond our ability to see colors. It plays a crucial role in photosynthesis, the process by which plants convert light energy into chemical energy. Chlorophyll, the green pigment found in plants, is highly absorbent of blue and red light wavelengths, which are essential for photosynthesis. Without the visible light spectrum, photosynthesis would not be possible,严重影响着整个生态系统的运转。
天电光电 EMC 2016 产品 A40 球泡灯参考设计说明书
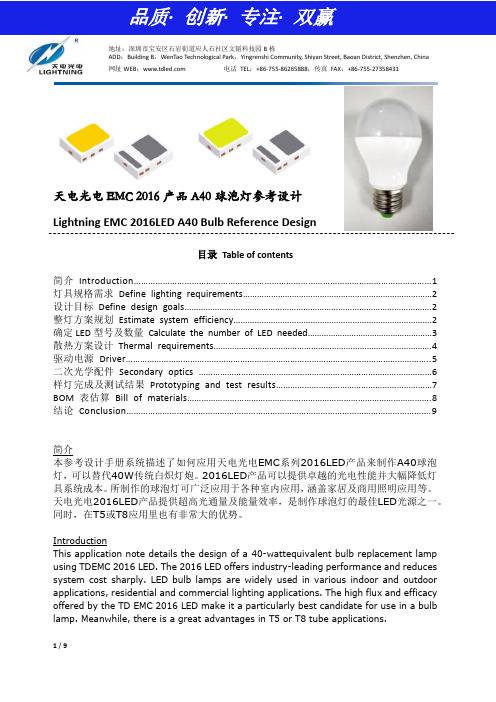
天电光电EMC 2016产品A40球泡灯参考设计Lightning EMC 2016LED A40 Bulb Reference Design目录Table of contents简介Introduction (1)灯具规格需求Define lighting requirements (2)设计目标Define design goals (2)整灯方案规划Estimate system efficiency (2)确定LED型号及数量Calculate the number of LED needed (3)散热方案设计Thermal requirements (4)驱动电源Driver (5)二次光学配件Secondary optics (6)样灯完成及测试结果Prototyping and test results (7)BOM表估算Bill of materials (8)结论Conclusion (9)简介本参考设计手册系统描述了如何应用天电光电EMC系列2016LED产品来制作A40球泡灯,可以替代40W传统白炽灯炮。
2016LED产品可以提供卓越的光电性能并大幅降低灯具系统成本。
所制作的球泡灯可广泛应用于各种室内应用,涵盖家居及商用照明应用等。
天电光电2016LED产品提供超高光通量及能量效率,是制作球泡灯的最佳LED光源之一。
同时,在T5或T8应用里也有非常大的优势。
IntroductionThis application note details the design of a 40-wattequivalent bulb replacement lamp using TDEMC 2016 LED. The 2016 LED offers industry-leading performance and reduces system cost sharply. LED bulb lamps are widely used in various indoor and outdoor applications, residential and commercial lighting applications. The high flux and efficacy offered by the TD EMC 2016 LED make it a particularly best candidate for use in a bulb lamp. Meanwhile, there is a great advantages in T5 or T8 tube applications.设计目标本次设计需要达到以下参数目标:整灯方案规划本次参考设计主要通过较低的温度、较高的光学效率、较高的电源效率来达到设计目标。
白光光谱测量实验(英文)

Lab_1. Basic Alignment of Laser and Optics Introduction:In this experiment, we learn to build an optical path to measure the spectrum of light.The aim of this experiment is to measure the spectrum of white light, so we use white light LED as light source. We also need two other laser generators with known wavelengths to calibrate the axis of spectrum. Here we choose helium-neon laser which generates red light with a wavelength of 633 nm and semiconductor laser which generates green light with a wavelength of 532 nm.A helium–neon laser or He-Ne laser, is a type of gas laser whose gain medium consists of a mixture of 85% helium and 15% neon inside of a small electrical discharge. It usually works in the visible band, and the mostly used is red light with a wavelength of 633 nm. A semiconductor laser is a device that uses semiconductor materials to generate laser. We utilize it to generate green light with a wavelength of 532 nm.To measure the spectrum, the most important element is the transmission grating, which determines the dispersion of polychromatic light and the formation of spectrum. Other elements are needed to confine the optical path and make sure the detector can receive the light signal.A lens is used to focus a light beam by means of refraction. When the lens converges the light at a point, the signal received by the detector is closer to the ideal point, which can reduce the error. Optical attenuator can attenuate the light intensity. The attenuation of light is related to its type and thickness.Diaphragm is an entity in an optical system that limits the light beam. Its size can be adjusted by rotation. In the last step, we need to collect data with CCD sensors. CCD sensor can directly convert the optical signal into analog current signal. The current signal is amplified and analog-to-digital converted to achieve image acquisition, storage, and reproduction.Methods and equipments:1.Adjust parallel light with Semiconductor Laser.1)Put semiconductor laser on the laser holder.2)The optical elements are arranged on the optical platform, as shown in Fig. 1.Fig. 1 Optical path for measuring spectrum. A) The light pathwe built. B) Schematic diagram of standard optical path1)Turn on the semiconductor laser. Adjust the altitude and angle to get laser parallel to optical table.2)Adjust the height of each optical element and use the white plate to verify whether the zero-order lightcan pass through the attenuator, diaphragm, transmission grating and the last diaphragm in turn. Use two diaphragm to ensure that the light emitted by the laser is collimated.3)Place the lens to focus the first-order light, adjust the position of the lens, and make the green lightpass through the lens from the center of the lens.4)Use CCD to collect the light signal, adjust the position of the CCD back and forth, and determinewhether the CCD is in the focal plane through the change in the size of the light spot in the computer software. At the same time, the green light signal is moved to the center of the image.5)Save the data of green light.6)Turn off the semiconductor laser.2.Adjust parallel light with He-Ne Laser.1)Turn on the He-Ne laser.2)Only adjust altitude and angle of He-Ne laser to pass the same optical path determined before.3)Save the data of red light.4)Turn off the He-Ne laser.3.Adjust parallel light with White Light LED1)Turn on the White light LED.2)Only adjust altitude and angle of White light LED to pass the same optical path determined before.3)Save the data of white light.4)Turn off the white light LED.4.Adjust parallel light with Mobile Flash1)Turn on the mobile flash.2)Only adjust altitude and angle of mobile flash to pass the same optical path determined before.3)Save the data of mobile flash.4)Turn off the mobile flash.5.Data processingThe image we get is just the relationship between the number of pixels and the intensity, we need to convert the number of pixels to wavelength. To accomplish this conversion, we need to utilize the spectrum of the standard green light (532 nm) and red light (633 nm).6.EquipmentHe-Ne laser, Semiconductor laser, White light LED, Optical attenuator, Aperture, Transmission grating, Focusing lens.Results and Discussion:The light appears as a circle in the image [Fig.2], When we built the optical path, we did not ensure that the height of the components was consistent, resulting in the optical path itself being inclined. This may have no effect on the first calibrated laser, but with the second calibrated laser it is difficult to align, resulting in scattered calibration data collection for the standard red light. Therefore, I need to use a circle to fit the data and use the coordinates of the center of the circle as the coordinates of the light [Fig. 2]. The coordinates of the center of light I get are shown in Table 1.Fig. 2. Original spectrum we get from softwareFig. 3 Fitting of the light.3, I get the coordinates of a standard laser with a known wavelength, I only need to linearly correspond the pixel coordinates of the two points to the wavelength. The spectrum of white light is shown below in figure 4. It can be seen from the image that the white light spectrum has two peaks, but the first peak was flattened. That is because the data we get from software is saved in uint8, which range is 0 to 255. The CCD sensor has a threshold. When the light intensity is greater than this threshold, the CCD sensor is no longer able to distinguish, and all are stored as the maximum value of 255, resulting in the flattening of the peak in the image. Compared with the spectrum of white light LED I find from website [Fig. 5], the profile of the curve and the wavelength corresponding to the peak are basically the same.Fig. 4 Spectrum of white lightFig. 5 White light LED spectrum from websiteThe spectrum of mobile phone flash is shown in Figure 6. It can only be seen from the low wavelength region and high wavelength region that the trend is the same as that of white LED. Due to the saturation of intensity of light, this spectrum is invalid.Fig. 6 Spectrum of mobile phone flashConclusion:In this experiment, we learned how to construct an optical path to measure the spectrum of LED. In the process, we learn some knowledge about fundamental optical elements and processes about adjusting light source which are effective preparation for our future experiments. As in this experiment, we need to adjust the second calibration light source to pass through two diaphragms. We know that we should adjust the angle and height of light one dimension at a time.In addition, the most important thing I learned from this experiment is that we must keep the optical path horizontal. The optical system is a very precise system. Slight deformation and movement lead to great changes in the results. Moreover, keeping patient and careful is important in optical experiments. Only by constantly trying can the light path be adjusted to an ideal state, which takes time for novices.Code:clear;clc;close all;% read the spectrums of green and red lightg = imread("image\green.tif"); % green ligth datar = imread("image\red.tif"); % red light dataw = imread("image\white.tif"); % white light dataw = im2gray(w);mobile = imread('image\liyunze.tif'); % mobile flash data% preprocess the spectrum imageg_bw = im2bw(g,0.7); % binarize the imageg_bw = bwmorph(g_bw,'close');r_bw = im2bw(r,0.7);se = fspecial('disk',12); % filter the noiser_bw = imfilter(r_bw,se);r_bw = imfill(r_bw,'holes');r_bw = bwmorph(r_bw,'open');% locate the maximum of spectrum of each spectrumfigure;subplot(121);imshow(g_bw);axis on;title('green light')stats = regionprops('table',g_bw,'Centroid','MajorAxisLength','MinorAxisLength'); % find all the connected domaindiameters = mean([stats.MajorAxisLength stats.MinorAxisLength],2);radii = diameters/2;rmax = max(radii);index = radii==rmax; % selected the largest circle(area)stats = stats(index,:);centers_g = round(stats.Centroid)diameters = diameters(index);radii = diameters/2;hold on; viscircles(centers_g,radii);subplot(122);imshow(r_bw);axis on;title('red light')stats = regionprops('table',r_bw,'Centroid','MajorAxisLength','MinorAxisLength');diameters = mean([stats.MajorAxisLength stats.MinorAxisLength],2);radii = diameters/2;rmax = max(radii);index = radii==rmax;stats = stats(index,:);centers_r = round(stats.Centroid)diameters = diameters(index);radii = diameters/2;hold on; viscircles(centers_r,radii);% wavelength of red light and green lightlambda_g = 532; % nmlambda_r = 633; % nmxg = centers_g(1); % position of green lightyg = centers_g(2); %xr = centers_r(1); % position of red light (use this)yr = centers_r(2); %% Conversion between pixel and lambdak = abs((xg-xr)/(lambda_g-lambda_r)); % conversion between pixel and wavelengthwavelength = 710:-1:380; % range of wavelength nmxi = find(wavelength==lambda_r);xs = -(xi-1):(length(wavelength)-xi);x_wave_s = xr + round(k.*xs);xs = lambda_r - xs;% Calculate the spectrum of LED and mobile phoneI_white = normalize(w(810,x_wave_s),'range'); % LEDI_mobile = normalize(mobile(590,x_wave_s),'range'); % mobile phonefigure;plot(xs,I_white);title('Spectrum of white light')xlabel('wavelength(nm)');ylabel('Intensity')axis([370 720 0 1.2])figure;plot(xs,I_mobile);title('Spectrum of mobile flash')xlabel('wavelength(nm)');ylabel('Intensity')axis([370 720 0 1.2])figure;subplot(221);imshow(g);title('Spectrum of green light');axis on; subplot(222);imshow(r);title('Spectrum of red light');axis on;subplot(223);imshow(w);title('Spectrum of white light');axis on; subplot(224);imshow(mobile);title('Spectrum of mobile flash');axis on;。
灯具光源测评报告模板

灯具光源测评报告模板1. 引言本文档是灯具光源测评报告的模板,旨在提供一个标准化的报告模板,帮助读者快速了解灯具光源的测评结果并做出相关决策。
本报告主要涵盖:•灯具光源测评目的•测评环境和方法•测评结果和分析•总结和建议2. 灯具光源测评目的灯具光源测评的目的有以下几点:1.评估光源的亮度和色彩还原性能,判断其是否满足使用要求;2.比较不同光源的性能,为用户提供选购和使用参考;3.提供科学依据,支持灯具制造商和销售商改进产品品质。
3. 测评环境和方法3.1 测评环境本次测评旨在测试常见的室内灯具光源,测试环境为标准化的室内实验室,光环境控制在 300-1000 lux 范围内,并保持恒定。
3.2 测评方法本次测评主要采用以下测试设备和方法:•光度辐射计(Radiometer):用于测试光源的亮度、伏安特性、光谱等参数;•色度计(Spectrophotometer):用于测试光源的色温、色彩还原指数、颜色坐标等参数;•照度计(Illuminometer):用于测试光源的照度、均匀性等参数。
测试步骤如下:1.将测评光源安装在测试装置上,并在整个测试过程中保持不动;2.预热灯具,使其达到稳定的亮度状态;3.使用光度辐射计、色度计和照度计,记录光源的各项参数;4.对测试数据进行分析和处理;5.生成测评报告并作出推荐。
4. 测评结果和分析4.1 亮度测试结果灯具类型测量亮度(lux)LED 灯管500LED 面板灯1200荧光灯800白炽灯750从上表可以看出,不同类型的灯具光源其亮度存在差异。
其中 LED 面板灯的亮度最高,达到了 1200 lux,荧光灯次之,LED 灯管和白炽灯亮度较低。
4.2 色彩还原测试结果灯具类型色温(K)色彩还原指数(CRI)LED 灯管4000 90LED 面板灯5000 95荧光灯4500 80白炽灯2700 100从上表可以看出,不同类型的灯具光源在色彩还原性能上存在差异。
CREE-LM80测试报告

XLamp XP-E White LEDs (Revision 1)1. Number of LED light sources tested /LED光源数量试验See individual test reports.见测试报告2. Description of LED light sources LED光源的描述XLamp XP-E White LEDs (XPEWHT)All measurements provided are LED package measurements.3. Description of auxiliary equipment测试设备描述Instrument Systems ISP-500 Integrating SphereInstrument Systems CAS-140 Spectrometer Keithley 2420 Sourcemeter4. Operating cycle 循环周期LED packages are driven at constant current.5. Ambient conditions 环境条件LED packages are operated in environmentalcontrol chambers. The temperature of theambient air around the LED packages is activelycontrolled by air flowing through the chamber.TA : See individual test reportsRH : < 45%Air flow : 800 CFM 包装是运作了环境控制室。
周围的空气的温度在LED包是乘飞机主动控制流过室。
助教:看个人测试报告湿度,< 45%空气流动:800 CFM立方英尺每分钟6. Case temperature情况下温度The case temperature measurement point is shown inthe XLamp XP-E Soldering & Handling document(AP25). 如此的温度测量点被证明在XLamp XP-E焊接和处理文件(AP25)。
20130810-ZMGW14(斯迈得2835)60mA

光 源 光 谱 测 试 报 告0.300.300.400.400.50CLASS: ANSI_5700K颜色参数:色品坐标:x=0.3237 y=0.3386/u'=0.2018 v'=0.4750 duv=2.725e-003相关色温:Tc=5900K 主波长:λd=498.9nm 色纯度: Purity=3.0%色比:R=15.2% G=80.3% B=4.5% 峰值波长:λp=452.5nm 半宽度:Δλd=20.7nm 显色指数:Ra=81.0R1 =79R2 =86R3 =89R4 =81R5 =80R6 =80R7 =87R8 =67R9 =2R10=65R11=79R12=52R13=81R14=94R15=75光度参数:光通量 Φ = 23.45 lm 光效 : 132.58 lm/W Φe = 73.77 mW电参数:正向电压 VF = 2.953 V 正向电流 IF = 59.90 mA 功率 P = 176.8 mW Ch1分级:418 白光分类:ANSI_5700K仪器状态: 积分时间 T=2217.00ms Ip=54997 (84%) [ HAAS2000_V1_USB ] V2.00.167产品型号:ZMGW14产品编号:ZMGW14-1测试人员:JT测试日期:2013-08-10 16-06环境温度:25.3℃环境湿度:65.0%制造厂商:斯迈得备 注:审核人员:damin光 源 光 谱 测 试 报 告0.300.300.400.400.50CLASS: ANSI_5700K颜色参数:色品坐标:x=0.3237 y=0.3357/u'=0.2030 v'=0.4735 duv=1.233e-003相关色温:Tc=5907K 主波长:λd=494.9nm 色纯度: Purity=3.1%色比:R=15.2% G=80.5% B=4.3% 峰值波长:λp=450.6nm 半宽度:Δλd=19.4nm 显色指数:Ra=80.6R1 =79R2 =85R3 =87R4 =81R5 =80R6 =78R7 =87R8 =68R9 =3R10=62R11=80R12=52R13=81R14=93R15=75光度参数:光通量 Φ = 23.10 lm 光效 : 130.14 lm/W Φe = 72.92 mW电参数:正向电压 VF = 2.963 V 正向电流 IF = 59.90 mA 功率 P = 177.5 mW Ch1分级:418 白光分类:ANSI_5700K仪器状态: 积分时间 T=2217.00ms Ip=54227 (83%) [ HAAS2000_V1_USB ] V2.00.167产品型号:ZMGW14产品编号:ZMGW14-2测试人员:JT测试日期:2013-08-10 16-17环境温度:25.3℃环境湿度:65.0%制造厂商:斯迈得备 注:审核人员:damin光 源 光 谱 测 试 报 告0.300.300.400.400.50CLASS: ANSI_5700K颜色参数:色品坐标:x=0.3250 y=0.3376/u'=0.2031 v'=0.4747 duv=1.652e-003相关色温:Tc=5843K 主波长:λd=498.4nm 色纯度: Purity=2.6%色比:R=15.2% G=80.8% B=4.0% 峰值波长:λp=449.9nm 半宽度:Δλd=18.9nm 显色指数:Ra=79.5R1 =78R2 =83R3 =85R4 =81R5 =79R6 =76R7 =86R8 =67R9 =-1R10=59R11=80R12=52R13=79R14=92R15=74光度参数:光通量 Φ = 23.94 lm 光效 : 132.39 lm/W Φe = 75.09 mW电参数:正向电压 VF = 3.019 V 正向电流 IF = 59.90 mA 功率 P = 180.8 mW Ch1分级:518 白光分类:ANSI_5700K仪器状态: 积分时间 T=2038.00ms Ip=51917 (79%) [ HAAS2000_V1_USB ] V2.00.167产品型号:ZMGW14产品编号:ZMGW14-3测试人员:JT测试日期:2013-08-10 16-25环境温度:25.3℃环境湿度:65.0%制造厂商:斯迈得备 注:审核人员:damin。
- 1、下载文档前请自行甄别文档内容的完整性,平台不提供额外的编辑、内容补充、找答案等附加服务。
- 2、"仅部分预览"的文档,不可在线预览部分如存在完整性等问题,可反馈申请退款(可完整预览的文档不适用该条件!)。
- 3、如文档侵犯您的权益,请联系客服反馈,我们会尽快为您处理(人工客服工作时间:9:00-18:30)。
光源光谱测试报告英文
Title: Light Source Spectral Testing Report.
1. Introduction.
This report presents the results of the spectral
testing conducted on a light source. The purpose of this testing was to analyze the spectral characteristics of the light emitted by the source.
2. Testing Methodology.
The spectral testing was performed using a spectrometer, which measures the intensity of light at different wavelengths. The light source was positioned at a fixed distance from the spectrometer, and multiple readings were taken to ensure accuracy.
3. Results and Analysis.
The spectral testing revealed the following characteristics of the light source:
Wavelength Range: The light emitted by the source ranged from X nanometers to Y nanometers.
Peak Wavelength: The peak intensity of the light occurred at a wavelength of Z nanometers.
Spectral Distribution: The spectral distribution of the light exhibited a particular pattern, indicating the presence of specific wavelengths or color components.
Color Rendering Index (CRI): The CRI of the light source was determined to be XX, indicating its ability to accurately render colors.
4. Discussion.
Based on the results obtained, it can be concluded that the light source possesses a specific spectral profile. The wavelength range and peak wavelength provide insights into
the color composition of the light emitted. The spectral distribution indicates the presence or absence of specific wavelengths, which can have implications for various applications, such as photography, lighting design, or scientific research. The CRI value provides information about the light source's color rendering capabilities, which is important for accurate color perception.
5. Conclusion.
The spectral testing conducted on the light source revealed valuable information about its spectral characteristics, including the wavelength range, peak wavelength, spectral distribution, and color rendering index. These findings can be utilized for various purposes, such as optimizing lighting setups, evaluating color accuracy, or selecting appropriate light sources for specific applications.
6. Recommendations.
Based on the results obtained, it is recommended to
further analyze the spectral data and compare it with industry standards or specific requirements. This can help in determining the suitability of the light source for different applications and identifying any potential areas for improvement.
Please note that this is a general template for a light source spectral testing report. The specific details and sections may vary depending on the actual testing conducted and the requirements of the project.。