曼昆经济学原理课后答案第七章消费者、生产者与市场效率
曼昆微观经济学课后练习英文答案(第七章)
✍ how to define and measure consumer surplus.✍ the link between sellers’ costs of producing a good and the supply curve.✍ how to define and measure producer surplus.✍ that the equilibrium of supply and demand maximizes total surplus in a market. CONTEXT AND PURPOSE:Chapter 7 is the first chapter in a three-chapter sequence on welfare economics and market efficiency. Chapter 7 employs the supply and demand model to develop consumer surplus and producer surplus as a measure of welfare and market efficiency. These concepts are then utilized in Chapters 8 and 9 to determine the winners and losers from taxation and restrictions on international trade.The purpose of Chapter 7 is to develop welfare economics—the study of how the allocation of resources affects economic well-being. Chapters 4 through 6 employed supply and demand in a positive framework, which focused on the question, “What is the equilibrium price and quantity in a market?” This chapter now addresses the normative question, “Is the equilibrium price and quantity in a market the best possible solution to the resource allocation problem, or is it simply the price and quantity that balance supply and demand?” Students will discover that under most circumstances the equilibrium price and quantity is also the one that maximizes welfare.KEY POINTS:? Consumer surplus equals buyers’ willingness to pay for a good minus the amount they actually pay for it, and it measures the benefit buyers get from participating in a market.Consumer surplus can be computed by finding the area below the demand curve and above the price.? Producer surplus equals the amount sellers receive for their goods minus their costs of production, and it measures the benefit sellers get from participating in a market. Producer surplus can be computed by finding the area below the price and above the supply curve.? An allocation of resources that maximizes the sum of consumer and producer surplus is said to be efficient. Policymakers are often concerned with the efficiency, as well as the equality, of economic outcomes.? The equilibrium of supply and demand maximizes the sum of consumer and producer surplus.That is, the invisible hand of the marketplace leads buyers and sellers to allocate resources efficiently.? Markets do not allocate resources efficiently in the presence of market failures such as market power or externalities.CHAPTER OUTLINE:I. Definition of welfare economics: the study of how the allocation of resources affects economic well-being.A. Willingness to Pay1. Definition of willingness to pay: the maximum amount that a buyer will pay for a good.2. Example: You are auctioning a mint-condition recording of Elvis Presley’s first album. Four buyers show up. Their willingness to pay is as follows:for John. Because John is willing to pay more than he has to for the album,he derives some benefit from participating in the market.3. Definition of consumer surplus: the amount a buyer is willing to pay for a good minus the amount the buyer actually pays for it.4. Note that if you had more than one copy of the album, the price in the auction would end up being lower (a little over $70 in the case of two albums) and both John and Paul would gain consumer surplus.B. Using the Demand Curve to Measure Consumer Surplus1. We can use the information on willingness to pay to derive a demand curve for the rare2. . Because the demand curve shows the buyers’ willingness to pay, we can use the demand curve to measure consumer surplus.C. How a Lower Price Raises Consumer Surplusare paying less for the product than before (area A on the graph).b. Because the price is now lower, some new buyers will enter the market and receive consumer surplus on these additional units of output purchased (area B on the graph).D. What Does Consumer Surplus Measure?1. Remember that consumer surplus is the difference between the amount that buyers are willing to pay for a good and the price that they actually pay.2. Thus, it measures the benefit that consumers receive from the good as the buyers themselves perceive it.III. Producer SurplusA. Cost and the Willingness to Sell1. Definition of cost: the value of everything a seller must give up to produce a good .2. Example: You want to hire someone to paint your house. You accept bids for the work from four sellers. Each painter is willing to work if the price you will pay exceeds her opportunity cost. (Note that this opportunity cost thus represents willingness to sell.) The costs are: ALTERNATIVE CLASSROOM EXAMPLE:Review the material on price ceilings from Chapter 6. Redraw the market for two-bedroom apartments in your town. Draw in a price ceiling below the equilibriumprice.Then go through:✍ consumer surplus before the price ceiling is put into place.✍ consumer surplus after the price ceiling is put into place.You will need to take some time to explain the relationship between the producers’ willingness to sell and the cost of producing the good. The relationship between cost and the supply curve is not as apparent as the relationship between the demand curve and willingness to pay. It is important to stress that consumer surplus is measured in monetary terms. Consumer surplus gives us a way to place a monetary cost on inefficient market outcomes (due to government involvement or market failure).except for Grandma. Because Grandma receives more than she would require to paint the house, she derives some benefit from producing in the market.4.Definition of producer surplus: the amount a seller is paid for a good minus the seller’s cost of providing it.5. Note that if you had more than one house to paint, the price in the auction would end up being higher (a little under $800 in the case of two houses) and both Grandma and Georgia would gain producer surplus.B. Using the Supply Curve to Measure Producer Surplus1. We can use the information on cost (willingness to sell) to derive a supply curve for2. marginal seller . Because the supply curve shows the sellers’ cost (willingness to sell), we can use the supply curve to measure producer surplus.are receiving more for the product than before (area C on the graph).b. Because the price is now higher, some new sellers will enter the market and receive producer surplus on these additional units of output sold (area D on the graph).D. Producer surplus is used to measure the economic well-being of producers, much like consumer surplus is used to measure the economic well-being of consumers.ALTERNATIVE CLASSROOM EXAMPLE:Review the material on price floors from Chapter 6. Redraw the market for anagricultural product such as corn. Draw in a price support above the equilibriumprice.Then go through:✍ producer surplus before the price support is put in place.✍ producer surplus after the price support is put in place.Make sure that you discuss the cost of the price support to taxpayers.IV.Market EfficiencyA. The Benevolent Social Planner1. The economic well-being of everyone in society can be measured by total surplus, which is the sum of consumer surplus and producer surplus:Total Surplus = Consumer Surplus + Producer SurplusTotal Surplus = (Value to Buyers – Amount Paid by Buyers) +(Amount Received by Sellers – Cost to Sellers)Because the Amount Paid by Buyers = Amount Received bySellers:2. Definition of efficiency: the property of a resource allocation of maximizing the total surplus received by all members of society .3. Definition of equality: the property of distributing economic prosperity uniformly the members of society .a. Buyers who value the product more than the equilibrium price will purchase the product; those who do not, will not purchase the product. In other words, the free market allocates the supply of a good to the buyers who value it most highly, as measured by their willingness to pay.b. Sellers whose costs are lower than the equilibrium price will produce the product; those whose costs are higher, will not produce the product. In other words, the free market allocates the demand for goods to the sellers who can produce it at the lowest cost.to the marginal buyer is greater than the cost to the marginal seller so total surplus would rise if output increases.b. At any quantity of output greater than the equilibrium quantity, the value of the product to the marginal buyer is less than the cost to the marginal seller so total surplus would rise if output decreases.3. Note that this is one of the reasons that economists believe Principle #6: Markets are usually a good way to organize economic activity.It would be a good idea to remind students that there are circumstances whenthe market process does not lead to the most efficient outcome. Examplesinclude situations such as when a firm (or buyer) has market power over priceor when there are externalities present. These situations will be discussed inlater chapters.Pretty Woman, Chapter 6. Vivien (Julia Roberts) and Edward (Richard Gere)negotiate a price. Afterward, Vivien reveals she would have accepted a lowerprice, while Edward admits he would have paid more. If you have done a goodjob of introducing consumer and producer surplus, you will see the light bulbsgo off above your students’ heads as they watch this clip.C. In the News: Ticket Scalping1. Ticket scalping is an example of how markets work to achieve an efficient outcome.2. This article from The Boston Globe describes economist Chip Case’s experience with ticket scalping.D. Case Study: Should There Be a Market in Organs?1. As a matter of public policy, people are not allowed to sell their organs.a. In essence, this means that there is a price ceiling on organs of $0.b. This has led to a shortage of organs.2. The creation of a market for organs would lead to a more efficient allocation of resources, but critics worry about the equity of a market system for organs.V. Market Efficiency and Market FailureA. To conclude that markets are efficient, we made several assumptions about how markets worked.1. Perfectly competitive markets.2. No externalities.B. When these assumptions do not hold, the market equilibrium may not be efficient.C. When markets fail, public policy can potentially remedy the situation. SOLUTIONS TO TEXT PROBLEMS:Quick Quizzes1. Figure 1 shows the demand curve for turkey. The price of turkey is P1 and the consumer surplus that results from that price is denoted CS. Consumer surplus is the amount a buyer is willing to pay for a good minus the amount the buyer actually pays for it. It measures the benefit to buyers of participating in a market.Figure 1 Figure 22. Figure 2 shows the supply curve for turkey. The price of turkey is P1 and the producer surplus that results from that price is denoted PS. Producer surplus is the amount sellers are paid for a good minus the sellers’ cost of providing it (measured by the supply curve). It measures the benefit to sellers of participating in a market.Figure 33. Figure 3 shows the supply and demand for turkey. The price of turkey is P1, consumer surplus is CS, and producer surplus is PS. Producing more turkeys than the equilibrium quantity would lower total surplus because the value to the marginal buyer would be lower than the cost to the marginal seller on those additional units.Questions for Review1. The price a buyer is willing to pay, consumer surplus, and the demand curve are all closely related. The height of the demand curve represents the willingness to pay of the buyers. Consumer surplus is the area below the demand curve and above the price, which equals the price that each buyer is willing to pay minus the price actually paid.2. Sellers' costs, producer surplus, and the supply curve are all closely related. The height of the supply curve represents the costs of the sellers. Producer surplus is the area below the price and above the supply curve, which equals the price received minus each seller's costs of producing the good.Figure 43. Figure 4 shows producer and consumer surplus in a supply-and-demand diagram.4. An allocation of resources is efficient if it maximizes total surplus, the sum of consumer surplus and producer surplus. But efficiency may not be the only goal of economic policymakers; they may also be concerned about equity the fairness of the distribution of well-being.5. The invisible hand of the marketplace guides the self-interest of buyers and sellers into promoting general economic well-being. Despite decentralized decision making and self-interested decision makers, free markets often lead to an efficient outcome.6. Two types of market failure are market power and externalities. Market power may cause market outcomes to be inefficient because firms may cause price and quantity to differ from the levels they would be under perfect competition, which keeps total surplus from being maximized. Externalities are side effects that are not taken into account by buyers and sellers. As a result, the free market does not maximize total surplus.Problems and Applications1. a. Consumer surplus is equal to willingness to pay minus the price paid. Therefore, Melissa’s willingness to pay must be $200 ($120 + $80).b. Her consumer surplus at a price of $90 would be $200 ? $90 = $110.c. If the price of an iPod was $250, Melissa would not have purchased one because the price is greater than her willingness to pay. Therefore, she would receive no consumer surplus.2. If an early freeze in California sours the lemon crop, the supply curve for lemons shifts to the left, as shown in Figure 5. The result is a rise in the price of lemons and a decline in consumer surplus from A + B + C to just A. So consumer surplus declines by the amount B + C.Figure 5 Figure 6In the market for lemonade, the higher cost of lemons reduces the supply of lemonade, as shown in Figure 6. The result is a rise in the price of lemonade and a decline in consumer surplus from D + E + F to just D, a loss of E + F. Note that an event that affects consumer surplus in one market often has effects on consumer surplus in other markets.3. A rise in the demand for French bread leads to an increase in producer surplus in the market for French bread, as shown in Figure 7. The shift of the demand curve leads to an increased price, which increases producer surplus from area A to area A + B + C.Figure 7The increased quantity of French bread being sold increases the demand for flour, as shown in Figure 8. As a result, the price of flour rises, increasing producer surplus from area Dto D + E + F. Note that an event that affects producer surplus in one market leads to effects on producer surplus in related markets.Figure 84. a.Figure 9b. When the price of a bottle of water is $4, Bert buys two bottles of water. His consumer surplus is shown as area A in the figure. He values his first bottle of water at $7, but pays only $4 for it, so has consumer surplus of $3. He values his second bottle of water at $5, but pays only $4for it, so has consumer surplus of $1. Thus Bert’s total consumer surplus is $3 + $1 = $4, which is the area of A in the figure.c. When the price of a bottle of water falls from $4 to $2, Bert buys three bottles of water, an increase of one. His consumer surplus consists of both areas A and B in the figure, an increase in the amount of area B. He gets consumer surplus of $5 from the first bottle ($7 value minus $2 price), $3 from the second bottle ($5 value minus $2 price), and $1 from the third bottle ($3 value minus $2 price), for a total consumer surplus of $9. Thus consumer surplus rises by $5 (which is the size of area B) when the price of a bottle of water falls from $4 to $2.5. a.Figure 10b. When the price of a bottle of water is $4, Ernie sells two bottles of water. His producer surplus is shown as area A in the figure. He receives $4 for his first bottle of water, but it costs only $1 to produce, so Ernie has producer surplus of $3. He also receives $4 for his second bottle of water, which costs $3 to produce, so he has producer surplus of $1. Thus Ernie’s total producer surplus is $3 + $1 = $4, which is the area of A in the figure.c. When the price of a bottle of water rises from $4 to $6, Ernie sells three bottles of water, an increase of one. His producer surplus consists of both areas A and B in the figure, an increase by the amount of area B. He gets producer surplus of $5 from the first bottle ($6 price minus $1 cost), $3 from the second bottle ($6 price minus $3 cost), and $1 from the third bottle ($6 price minus $5 price), for a total producer surplus of $9. Thus producer surplus rises by $5 (which is the size of area B) when the price of a bottle of water rises from $4 to $6.6. a. From Ernie’s supply schedule and Bert’s demand schedule, the quantityequilibrium quantity of two.b. At a price of $4, consumer surplus is $4 and producer surplus is $4, as shown in Problems 3 and 4 above. Total surplus is $4 + $4 = $8.c. If Ernie produced one less bottle, his producer surplus would decline to $3, as shown in Problem 4 above. If Bert consumed one less bottle, his consumer surplus would decline to $3, as shown in Problem 3 above. So total surplus would decline to $3 + $3 = $6.d. If Ernie produced one additional bottle of water, his cost would be $5, but the price is only $4, so his producer surplus would decline by $1. If Bert consumed one additional bottle of water, his value would be $3, but the price is $4, so his consumer surplus would decline by $1. So total surplus declines by $1 + $1 = $2.7. a. The effect of falling production costs in the market for stereos results in a shift to the right in the supply curve, as shown in Figure 11. As a result, the equilibrium price of stereos declines and the equilibrium quantity increases.Figure 11b. The decline in the price of stereos increases consumer surplus from area A to A + B + C + D, an increase in the amount B + C + D. Prior to the shift in supply, producer surplus was areas B + E (the area above the supply curve and below the price). After the shift in supply, producer surplus is areas E + F + G. So producer surplus changes by the amount F + G – B, which may be positive or negative. The increase in quantity increases producer surplus, while the decline in the price reduces producer surplus. Because consumer surplus rises by B + C + D and producer surplus rises by F + G – B, total surplus rises by C + D + F + G.c. If the supply of stereos is very elastic, then the shift of the supply curve benefits consumers most. To take the most dramatic case, suppose the supply curve were horizontal, as shown in Figure 12. Then there is no producer surplus at all. Consumers capture all the benefits of falling production costs, with consumer surplus rising from area A to area A + B.Figure 128. Figure 13 shows supply and demand curves for haircuts. Supply equals demand at a quantity of three haircuts and a price between $4 and $5. Firms A, C, and D should cut the hair of Ellen, Jerry, and Phil. Oprah’s willingness to pay is too low and firm B’s costs are too high, so they do not participate. The maximum total surplus is the area between the demand and supply curves, which totals $11 ($8 value minus $2 cost for the first haircut, plus $7 value minus $3 cost for the second, plus $5 value minus $4 cost for the third).Figure 139. a. The effect of falling production costs in the market for computers results in a shift to the right in the supply curve, as shown in Figure 14. As a result, the equilibrium price of computers declines and the equilibrium quantity increases. The decline in the price of computers increases consumer surplus from area A to A + B + C + D, an increase in the amount B + C + D.Figure 14 Figure 15Prior to the shift in supply, producer surplus was areas B + E (the area above thesupply curve and below the price). After the shift in supply, producer surplus isareas E + F + G. So producer surplus changes by the amount F + G – B, whichmay be positive or negative. The increase in quantity increases producer surplus,while the decline in the price reduces producer surplus. Because consumer surplusrises by B + C + D and producer surplus rises by F + G – B, total surplus rises byC +D + F + G.b. Because typewriters are substitutes for computers, the decline in the price of computers means that people substitute computers for typewriters, shifting the demand for typewriters to the left, as shown in Figure 15. The result is a decline in both the equilibrium price and equilibrium quantity of typewriters. Consumer surplus in the typewriter market changes from area A + B to A + C, a net change of C – B. Producer surplus changes from area C + D + E to area E, a net loss of C + D. Typewriter producers are sad about technological advances in computers because their producer surplus declines.c. Because software and computers are complements, the decline in the price and increase in the quantity of computers means that the demand for software increases, shifting the demand for software to the right, as shown in Figure 16. The result is an increase in both the price and quantity of software. Consumer surplus in the software market changes from B + C to A + B, anet change of A – C. Producer surplus changes from E to C + D + E, an increase of C + D, so software producers should be happy about the technological progress in computers.Figure 16d. Yes, this analysis helps explain why Bill Gates is one the world’s richest people, because his company produces a lot of software that is a complement with computers and there has been tremendous technological advance in computers.10. a. With Provider A, the cost of an extra minute is $0. With Provider B, the cost of anextra minute is $1.b. With Provider A, my friend will purchase 150 minutes [= 150 – (50)(0)]. WithProvider B, my friend would purchase 100 minutes [= 150 – (50)(1)].c. With Provider A, he would pay $120. The cost would be $100 with Provider B.Figure 17d. Figure 17 shows the friend’s demand. With Provider A, he buys 150 minutes andhis consumer surplus is equal to (1/2)(3)(150) – 120 = 105. With Provider B, hisconsumer surplus is equal to (1/2)(2)(100) = 100.e. I would recommend Provider A because he receives greater consumer surplus.11. a. Figure 18 illustrates the demand for medical care. If each procedure has a price of $100, quantity demanded will be Q1 procedures.Figure 18b. If consumers pay only $20 per procedure, the quantity demanded will be Q2 procedures. Because the cost to society is $100, the number of procedures performed is too large to maximize total surplus. The quantity that maximizes total surplus is Q1 procedures, which is less than Q2.c. The use of medical care is excessive in the sense that consumers get procedures whose value is less than the cost of producing them. As a result, the economy’s total surplus is reduced.d. To prevent this excessive use, the consumer must bear the marginal cost of the procedure. But this would require eliminating insurance. Another possibility would be that the insurance company, which pays most of the marginal cost of the procedure ($80, in this case) could decide whether the procedure should be performed. But the insurance company does not get the benefits of the procedure, so its decisions may not reflect the value to the consumer.。
曼昆 经济学原理07-消费者、产品和市场效率

The Costs of Four Possible Sellers...
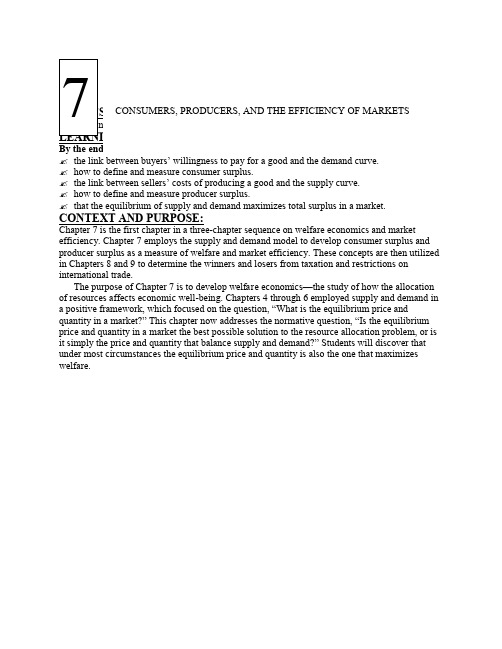
Seller Mary Frida Georgia Grandma Cost $900 800 600 500
Producer Surplus and the Supply Curve
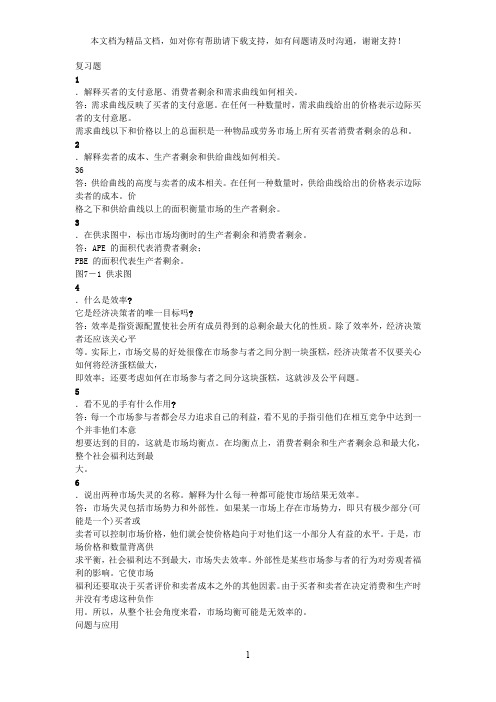
Just as consumer surplus is related to the demand curve, producer surplus is closely related to the supply curve. At any quantity, the price given by the supply curve shows the cost of the marginal seller, the seller who would leave the market first if the price were any lower.
Consumer Surplus
Consumer surplus is the amount a buyer is willing to pay for a good minus the amount the buyer actually pays for it.
Four Possible Buyers' Willingness to Pay...
Measuring Producer Surplus with the Supply Curve...
Price of House Painting
$900 800
Price = $600
Supply
600 500
Grandma's producer surplus ($100)
曼昆经济学笔记(7)——消费者、生产者与市场效率

第7章消费者、生产者与市场效率在本章我们会讨论到有关规范经济学的部分,我们了解到市场倾向于在市场均衡点处分配稀缺资源,但这样的分配是否符合经济福利呢?福利经济学便是这样一门研究资源配置如何影响经济福利的学问。
一、消费者剩余1、支付意愿一个买者愿意支付的最高价格称为支付意愿,它衡量买者对物品的评价。
每个买者都希望以低于自己支付意愿的价格购买物品,当价格等于支付意愿的时候买者对购买与否持无所谓的态度,买者拒绝以高于支付意愿的价格购买物品。
消费者剩余是买者愿意为一种物品支付的量减去其为此实际支付的量。
2、用需求曲线衡量消费者剩余消费者剩余与一种物品的需求曲线密切相关。
在任何一种数量时,需求曲线给出的价格表示边际买者的支付意愿。
边际买者是指如果价格再提高一点就首先离开市场的买者。
由于需求曲线反映了买者的支付意愿,我们还可以用它来衡量消费者剩余。
需求曲线以下和价格以上的面积衡量一个市场上的消费者剩余。
这之所以正确是因为需求曲线的高度用买者对此物品的支付意愿来衡量他们对此物品的评价。
这种支付意愿与市场价格之间的差额是每个买者的消费者剩余。
因此,需求曲线以下和价格以上的总面积是一种物品或劳务市场上所有买者的消费者剩余的总和。
3、价格降低如何增加消费者剩余由于买者总想为他们买的物品少支付一些,因此价格降低使一种物品买者的状况变好。
当价格降低时,增加的消费者剩余有两部分组成,一部分是原来消费者增加的消费者剩余,另一部分是进入市场的新消费者的消费者剩余。
4、消费者剩余衡量什么我们提出消费者剩余的概念是为了对市场结果的合理性做出规范性判断。
消费者剩余,即买者愿意为一种物品支付的量减去他们实际支付的量,衡量了买者从一种物品中得到的自己感觉到的利益。
因此,如果决策者想尊重买者的偏好,那么消费者剩余不失为经济福利的一种好的衡量标准。
但在一些情况下,决策者可能选择不去关注消费者剩余,因为他们不尊重驱动买者行为的偏好。
譬如从社会的角度看,吸毒者对毒品的愿意支付并不是买者利益的好的指标,消费者剩余也不是经济福利的好的衡量指标,因为吸毒者并不关心自己的最佳利益。
(NEW)曼昆《经济学原理(微观经济学分册)》(第6版)课后习题详解

目 录第1篇 导 言第1章 经济学十大原理第2章 像经济学家一样思考第3章 相互依存性与贸易的好处第2篇 市场如何运行第4章 供给与需求的市场力量第5章 弹性及其应用第6章 供给、需求与政府政策第3篇 市场和福利第7章 消费者、生产者与市场效率第8章 应用:赋税的代价第9章 应用:国际贸易第4篇 公共部门经济学第10章 外部性第11章 公共物品和公共资源第12章 税制的设计第5篇 企业行为与产业组织第13章 生产成本第14章 竞争市场上的企业第15章 垄 断第16章 垄断竞争第17章 寡 头第6篇 劳动市场经济学第18章 生产要素市场第19章 收入与歧视第20章 收入不平等与贫困第7篇 深入研究的论题第21章 消费者选择理论第22章 微观经济学前沿第1篇 导 言第1章 经济学十大原理一、概念题1.稀缺性(scarcity)答:经济学研究的问题和经济物品都是以稀缺性为前提的。
稀缺性指在给定的时间内,相对于人的需求而言,经济资源的供给总是不足的,也就是资源的有用性与有限性。
人类消费各种物品的欲望是无限的,满足这种欲望的物品,有的可以不付出任何代价而随意取得,称之为自由物品,如阳光和空气;但绝大多数物品是不能自由取用的,因为世界上的资源(包括物质资源和人力资源)是有限的,这种有限的、为获取它必须付出某种代价的物品,称为“经济物品”。
正因为稀缺性的客观存在,地球上就存在着资源的有限性和人类的欲望与需求的无限性之间的矛盾。
经济学的一个重要研究任务就是:“研究人们如何进行抉择,以便使用稀缺的或有限的生产性资源(土地、劳动、资本品如机器、技术知识)来生产各种商品,并把它们分配给不同的社会成员进行消费。
”也就是从经济学角度来研究使用有限的资源来生产什么、如何生产和为谁生产的问题。
2.经济学(economics)答:经济学是研究如何将稀缺的资源有效地配置给相互竞争的用途,以使人类的欲望得到最大限度满足的科学。
时下经常见诸国内报刊文献的“现代西方经济学”一词,大多也都在这个意义上使用。
曼昆经济学原理课后答案第七章消费者、生产者与市场效率
复习题1.解释买者的支付意愿、消费者剩余和需求曲线如何相关。
答:需求曲线反映了买者的支付意愿。
在任何一种数量时,需求曲线给出的价格表示边际买者的支付意愿。
需求曲线以下和价格以上的总面积是一种物品或劳务市场上所有买者消费者剩余的总和。
2.解释卖者的成本、生产者剩余和供给曲线如何相关。
36答:供给曲线的高度与卖者的成本相关。
在任何一种数量时,供给曲线给出的价格表示边际卖者的成本。
价格之下和供给曲线以上的面积衡量市场的生产者剩余。
3.在供求图中,标出市场均衡时的生产者剩余和消费者剩余。
答:APE 的面积代表消费者剩余;PBE 的面积代表生产者剩余。
图7-1 供求图4.什么是效率?它是经济决策者的唯一目标吗?答:效率是指资源配置使社会所有成员得到的总剩余最大化的性质。
除了效率外,经济决策者还应该关心平等。
实际上,市场交易的好处很像在市场参与者之间分割一块蛋糕,经济决策者不仅要关心如何将经济蛋糕做大,即效率;还要考虑如何在市场参与者之间分这块蛋糕,这就涉及公平问题。
5.看不见的手有什么作用?答:每一个市场参与者都会尽力追求自己的利益,看不见的手指引他们在相互竞争中达到一个并非他们本意想要达到的目的,这就是市场均衡点。
在均衡点上,消费者剩余和生产者剩余总和最大化,整个社会福利达到最大。
6.说出两种市场失灵的名称。
解释为什么每一种都可能使市场结果无效率。
答:市场失灵包括市场势力和外部性。
如果某一市场上存在市场势力,即只有极少部分(可能是一个)买者或卖者可以控制市场价格,他们就会使价格趋向于对他们这一小部分人有益的水平。
于是,市场价格和数量背离供求平衡,社会福利达不到最大,市场失去效率。
外部性是某些市场参与者的行为对旁观者福利的影响。
它使市场福利还要取决于买者评价和卖者成本之外的其他因素。
由于买者和卖者在决定消费和生产时并没有考虑这种负作用。
所以,从整个社会角度来看,市场均衡可能是无效率的。
问题与应用1.Melissa用120美元购买了一个iPod,并得到了80美元的消费者剩余。
7消费者、生产者与市场效率(曼昆经济学原理微观)

*
10
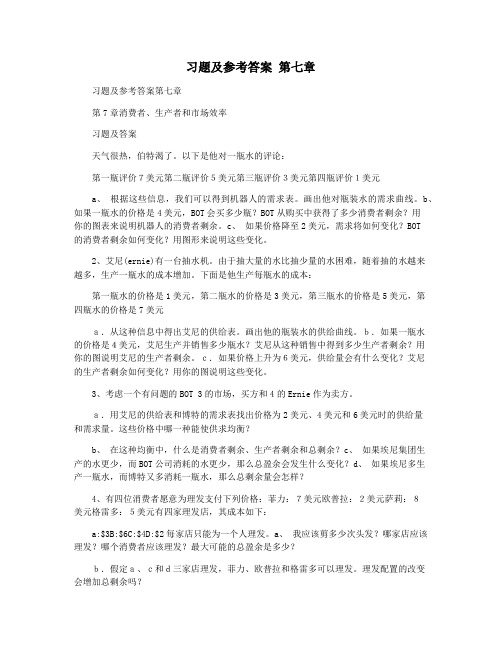
消费者剩余与需求曲线
P
$350 $300 $250
Flea的消费 者剩余 Anthony的消费 者剩余
$200
$150
$100
$50
$0
Q
01234
© 2013 Cengage Learning. All Rights Reserved. May not be copied, scanned, or duplicated, in whole or in part, except for use as permitted in a license distributed with a certain product or service or otherwise on a password-protected website for classroom use.
© 2013 Cengage Learning. All Rights Reserved. May not be copied, scanned, or duplicated, in whole or in part, except for use as permitted in a license distributed with a certain product or service or otherwise on a password-protected website for classroom use.
*
8
消费者剩余
消费者剩余:买者愿意为一种物品支付的量减去其 为此实际支付的量
消费者剩余 = 支付意愿 – 市场价格
人名
支付 意愿
Anthon y
$250
Chad 175
习题及参考答案 第七章
习题及参考答案第七章习题及参考答案第七章第7章消费者、生产者和市场效率习题及答案天气很热,伯特渴了。
以下是他对一瓶水的评论:第一瓶评价7美元第二瓶评价5美元第三瓶评价3美元第四瓶评价1美元a、根据这些信息,我们可以得到机器人的需求表。
画出他对瓶装水的需求曲线。
b、如果一瓶水的价格是4美元,BOT会买多少瓶?BOT从购买中获得了多少消费者剩余?用你的图表来说明机器人的消费者剩余。
c、如果价格降至2美元,需求将如何变化?BOT的消费者剩余如何变化?用图形来说明这些变化。
2、艾尼(ernie)有一台抽水机。
由于抽大量的水比抽少量的水困难,随着抽的水越来越多,生产一瓶水的成本增加。
下面是他生产每瓶水的成本:第一瓶水的价格是1美元,第二瓶水的价格是3美元,第三瓶水的价格是5美元,第四瓶水的价格是7美元a.从这种信息中得出艾尼的供给表。
画出他的瓶装水的供给曲线。
b.如果一瓶水的价格是4美元,艾尼生产并销售多少瓶水?艾尼从这种销售中得到多少生产者剩余?用你的图说明艾尼的生产者剩余。
c.如果价格上升为6美元,供给量会有什么变化?艾尼的生产者剩余如何变化?用你的图说明这些变化。
3、考虑一个有问题的BOT 3的市场,买方和4的Ernie作为卖方。
a.用艾尼的供给表和博特的需求表找出价格为2美元、4美元和6美元时的供给量和需求量。
这些价格中哪一种能使供求均衡?b、在这种均衡中,什么是消费者剩余、生产者剩余和总剩余?c、如果埃尼集团生产的水更少,而BOT公司消耗的水更少,那么总盈余会发生什么变化?d、如果埃尼多生产一瓶水,而博特又多消耗一瓶水,那么总剩余量会怎样?4、有四位消费者愿意为理发支付下列价格:菲力:7美元欧普拉:2美元萨莉:8美元格雷多:5美元有四家理发店,其成本如下:a:$3B:$6C:$4D:$2每家店只能为一个人理发。
a、我应该剪多少次头发?哪家店应该理发?哪个消费者应该理发?最大可能的总盈余是多少?b.假定a、c和d三家店理发,菲力、欧普拉和格雷多可以理发。
【免费下载】经济学原理作业 第七章 消费者生产者与市场效率附答案1

第七章消费者、生产者与市场效率一、名词解释(参照课本注释)1、支付意愿(willingness to pay)2、消费者剩余(consumer surplus)3、生产者剩余(producer surplus)4、效率(efficiency)二、选择题1.假设可以购买三个相同的花瓶。
买者1愿意为一个花瓶支付30美元,买者2愿意为一个花瓶支付25美元,买者3愿意为一个花瓶支付20美元。
如果价格是25美元,将卖出多少花瓶?这个市场上的消费者剩余是多少?( C )a. 将卖出一个花瓶,消费者剩余为30美元。
b. 将卖出一个花瓶,消费者剩余为5美元。
c. 将卖出两个花瓶,消费者剩余为5美元。
d. 将卖出三个花瓶,消费者剩余为0美元。
2.如果仁慈的社会计划者选择生产低于一种物品的均衡数量,那么( D )a.生产者剩余最大化。
b.消费者剩余最大化。
c.总剩余最大化。
d.买者对生产的最后一单位的评价大于生产的成本。
e.生产最后一单位的成本大于买者对它的评价。
3.亚当斯密“看不见的手”的概念表明,竞争市场的结果(B )a.使总剩余最小化b.使总剩余最大化c.引起社会成员平等d. b和c都对4.一般来说,如果仁慈的社会计划者若想使市场上买者和卖者得到的总利益最大化,计划着就应该( C )a.选择高于市场均衡价格的价格b.选择低于市场均衡价格的价格c.允许市场自己寻找均衡d.选择任何一种计划者想要的价格,因为卖者(买者)从价格的任何变动中产生的亏损都正好有买者(卖者)得到的收益抵消了。
5.如果一个市场是有效率的,那么,(D )a.市场把产品配置给了对它评价最大的买者。
b.市场把买者配置给了能以最低成本生产物品的生产者。
c.市场生产的两使消费者和生产者之和最大。
d.以上各项都对。
6.假设一辆新自行车的价格是300美元。
苏对一辆新自行车的评价是400美元。
卖者生产一辆新自行车的成本是200美元。
如果苏购买一辆新自行车,总剩余值是( B )a.100美元b.200美元c.300美元d.400美元7.乔有10副棒球手套,而苏没有。
- 1、下载文档前请自行甄别文档内容的完整性,平台不提供额外的编辑、内容补充、找答案等附加服务。
- 2、"仅部分预览"的文档,不可在线预览部分如存在完整性等问题,可反馈申请退款(可完整预览的文档不适用该条件!)。
- 3、如文档侵犯您的权益,请联系客服反馈,我们会尽快为您处理(人工客服工作时间:9:00-18:30)。
复习题1.解释买者的支付意愿、消费者剩余和需求曲线如何相关。
答:需求曲线反映了买者的支付意愿。
在任何一种数量时,需求曲线给出的价格表示边际买者的支付意愿。
需求曲线以下和价格以上的总面积是一种物品或劳务市场上所有买者消费者剩余的总和。
2.解释卖者的成本、生产者剩余和供给曲线如何相关。
36答:供给曲线的高度与卖者的成本相关。
在任何一种数量时,供给曲线给出的价格表示边际卖者的成本。
价格之下和供给曲线以上的面积衡量市场的生产者剩余。
3.在供求图中,标出市场均衡时的生产者剩余和消费者剩余。
答:APE 的面积代表消费者剩余;PBE 的面积代表生产者剩余。
图7-1 供求图4.什么是效率?它是经济决策者的唯一目标吗?答:效率是指资源配置使社会所有成员得到的总剩余最大化的性质。
除了效率外,经济决策者还应该关心平等。
实际上,市场交易的好处很像在市场参与者之间分割一块蛋糕,经济决策者不仅要关心如何将经济蛋糕做大,即效率;还要考虑如何在市场参与者之间分这块蛋糕,这就涉及公平问题。
5.看不见的手有什么作用?答:每一个市场参与者都会尽力追求自己的利益,看不见的手指引他们在相互竞争中达到一个并非他们本意想要达到的目的,这就是市场均衡点。
在均衡点上,消费者剩余和生产者剩余总和最大化,整个社会福利达到最大。
6.说出两种市场失灵的名称。
解释为什么每一种都可能使市场结果无效率。
答:市场失灵包括市场势力和外部性。
如果某一市场上存在市场势力,即只有极少部分(可能是一个)买者或卖者可以控制市场价格,他们就会使价格趋向于对他们这一小部分人有益的水平。
于是,市场价格和数量背离供求平衡,社会福利达不到最大,市场失去效率。
外部性是某些市场参与者的行为对旁观者福利的影响。
它使市场福利还要取决于买者评价和卖者成本之外的其他因素。
由于买者和卖者在决定消费和生产时并没有考虑这种负作用。
所以,从整个社会角度来看,市场均衡可能是无效率的。
问题与应用1.Melissa用120美元购买了一个iPod,并得到了80美元的消费者剩余。
A.她的支付意愿是多少?答:消费者剩余等于支付意愿减去付出的价格。
因此,梅莉莎须支付200 美元($120 + $80)。
B.如果她在降价销售时买了售价为90美元的iPod,她的消费者剩余会是多少?答:此时,她的消费者剩余为: 200-90 =110 美元。
C.如果iPod的价格是250美元,她的消费者剩余会是多少?答:如果iPod 的价格是250 美元,其价格大于梅莉莎的支付愿意,因此她不会再买,这时的消费者剩余就为零。
2.加利福尼亚早来的寒流使柠檬变酸。
柠檬市场上消费者剩余会有什么变动?柠檬水市场上消费者剩余会有什么变动?用图形说明你的答案。
答:柠檬变酸,消费者对柠檬的评价下降,需求曲线向左下方移动。
在其他条件不变的情况下,消费者剩余减少。
如图7-2(a)所示,柠檬质量下降,使需求曲线从D1 下降到D2,APE 是原先的消费者剩余,A′P′E′,是变动后的消费者剩余,△APE>△A′P′E′。
由于柠檬价格的下降,柠檬水的投入成本减少,柠檬水的价格也下降。
在其他条件不变的情况下,柠檬水市场上消费者剩余增加,如图7-2(b)所示。
37(a)柠檬市场(b)柠檬水市场图7-2 寒流的影响3.假设对法国面包的需求增加。
在法国面包市场上,生产者剩余会发生什么变动?在面粉市场上,生产者剩余会发生什么变动?用图形说明你的答案。
答:由于需求增加,在其他条件不变的情况下,法国面包的价格会上升,市场上的生产者剩余增加。
如图7-3(a),价格从P1 上升的P2,销量从Q1 上升到Q2,生产者剩余从面积PlBE1 增加到面积P2BE2。
由于面包产量上升,它的生产要素面粉的需求量也会上升。
在其他条件不变的情况下,面粉价格上升,市场上的生产者剩余增加。
如图7-3(b)所示,生产者剩余从面积P1BE1 增加到面积P2BE2。
(a)面包市场的生产者剩余(b)面粉市场的生产者剩余图7-3 法国面包需求增加的影响4.这是一个热天,Bert口干舌燥。
下面是他对一瓶水的评价:对第一瓶评价7美元对第二瓶评价5美元对第三瓶评价3美元对第四瓶评价1美元A.根据以上信息推导出Bert的需求表。
画出他对瓶装水的需求曲线。
答:表7-1 博特的需求表价格需求量大于7 美元07~5 美元15~3 美元23~1 美元31 美元以下438图7-4 博特的需求曲线B.如果一瓶水的价格是4美元,Bert会买多少瓶水?Bert从他的购买中得到了多少消费者剩余?在你的图形中标出Bert的消费者剩余。
答:如果价格是4 美元,博特买2 瓶水。
他从购买中得到了4 美元的消费者剩余。
如图7-5 所示,博特的消费者剩余是4 美元(7-4+5-4=4)。
图7-5 博特的消费者剩余C.如果价格下降到2美元,需求量会有何变化?Bert的消费者剩余会有何变化?用你的图形说明这些变化。
答:如果价格下降到2 美元,需求量增加到3,博特的消费者剩余增加到9 美元。
如图7—6 所示,博特的消费者剩余增加到9 美元(7-2+5-2+3-2=9)。
图7-6 博特的消费者剩余5.Ernie有一台抽水机。
由于抽大量的水比抽少量的水困难,随着抽的水越来越多,生产一瓶水的成本增加。
下面是他生产每瓶水的成本:第一瓶水的成本1美元第二瓶水的成本3美元第三瓶水的成本5美元第四瓶水的成本7美元A.根据以上信息推导出Ernie的供给表。
画出他的瓶装水的供给曲线。
答:表7-2 艾尼的供给表价格供给量7 美元或以上45~7 美元33~5 美元21~3 美元11 美元以下039图7-7 艾尼的供给曲线B.如果一瓶水的价格是4美元,Ernie会生产并销售多少瓶水?Ernie从这种销售中得到多少生产者剩余?在你的图形中标出Ernie的生产者剩余。
答:如果一瓶水的价格是4 美元,艾尼生产并销售2 瓶水。
艾尼的生产者剩余是4 美元,如图7-8 所示。
图7—8 艾尼的生产者剩余C.如果价格上升为6美元,供给量会有什么变化?Ernie的生产者剩余会有何变化?在你的图形中标出这些变化。
答:如果价格上升为6 美元,供给量会上升,艾尼的生产者剩余也上升。
如图7-9 所示,供给量上升为3瓶,生产者剩余上升为9 美元。
图7—9 艾尼的生产者剩余6.考虑一个由问题4中的Bert作为买者、问题5中的Ernie作为卖者组成的市场。
A.用Ernie的供给表和Bert的需求表找出价格为2美元、4美元和6美元时的供给量和需求量。
这些价格中哪一种能使供求达到平衡?答:这些价格中4 美元一瓶时可使供求均衡。
表7-3 供求表B.在这种均衡时,消费者剩余、生产者剩余和总剩余是多少?答:在这种均衡中,消费者剩余是4 美元,生产者剩余是4 美元,总剩余是8 美元。
C.如果Ernie少生产并且Bert少消费一瓶水,总剩余会发生什么变动?答:总剩余会下降,变成6 美元,因为市场并没有达到有效规模。
D.如果Ernie多生产并且Bert多消费一瓶水,总剩余会发生什么变动?答:总剩余会下降,变成6 美元,因为资源没有有效配置。
7.在过去几十年间,生产平面电视的成本降低了。
我们考虑这一事实的某些含义。
A.用供求图说明生产成本下降对平面电视的价格和销售量的影响。
答:成本下降使供给曲线从S1 向右下方移动到S2,立体声音响系统价格从P1 下降到P2,销售量从Q1 上升到Q2。
价格供给量需求量2 1 34 2 26 3 140图7-10 平面电视供求图B.用你的图形说明消费者剩余和生产者剩余发生了什么变化?答:从图中可以看出,成本下降使消费者剩余增加,从面积AP1E1 增加到面积AP1E2。
生产者剩余也增加了,从面积B1P1E1 增加到面积B2P2E2。
C.假定平面电视的供给是非常富有弹性的。
谁从生产成本下降中获益最大?是平面电视的消费者还是生产者?答:假定平面电视的供给非常富有弹性,那么,消费者从生产成本下降中获益最大。
8.有四位消费者愿意为理发支付下列价格:Terry:7美元;Oprah:2美元;Ellen:8美元;Phil:5美元;有四家理发店,其成本如下:A企业:3美元B企业:6美元C企业:4美元D企业:2美元每家店只能为一个人理发。
从效率来看,应该有多少次理发?哪些店应该理发?哪些消费者应该理发?最大可能的总剩余是多少?答:从效率来看,应该有3 次理发。
A、C、D 理发店应理发,Terry、Ellen 和Phil 应该理发。
Oprah 愿意支付的价格太低而企业B 的成本太高,所以不会参与。
最大可能总剩余是11 美元(8-2+7-3+5-4=11)。
9.假设技术进步使生产电脑成本降低。
A.用供求图说明电脑市场上价格、数量、消费者剩余和生产者剩余会发生什么变动?答:成本下降使供给曲线从S1 向右下方移动到S2,电脑市场上价格从P1 下降到P2,销售量从Q1 上升到Q2。
消费者剩余从面积AP1E1 增加到AP2E2,生产者剩余从面积P1E1B1 增加到P2E2B2。
图7-11 电脑市场供求图B.电脑和加法机是替代品。
用供求图说明加法机市场上的价格、数量、消费者剩余和生产者剩余会发生什41么变动?电脑技术进步对加法机生产者而言是好事还是坏事?答:由于电脑和加法机是替代品,电脑的销售量增加引起加法机的需求减少,需求曲线从D1 向左下方移动到D2,价格从P1 下降到P2,销售量从Q1 下降到Q2。
生产者剩余从面积BP1E1 减少到面积BP2E2,消费者剩余从面积A1P1El 减少到面积A2P2E2。
加法机生产者对电脑技术进步感到不幸。
图7-12 加法机市场供求图C.电脑和软件是互补品。
用供求图说明软件市场上的价格、数量、消费者剩余和生产者剩余会发生什么变动?电脑技术进步对软件生产者而言是好事还是坏事?答:由于电脑和软件是互补品,电脑的销售量增加引起软件的需求减少,需求曲线从D1 向右上方移动到D2,价格从P1 上升到P2,销售量从Q1 上升到Q2。
生产者剩余从面积BP1E1 增加到面积BP2E2,消费者剩余从面积A1PIEl 增加到面积A2P2E2。
软件生产者对电脑技术进步感到幸福。
D.上述分析有助于解释为什么软件生产者比尔·盖茨是世界上最富有的人之一吗?答:这种分析有助于解释软件生产者比尔·盖茨是世界上最富有的人之一。
电脑制造成本下降使电脑价格下降,人们对电脑的购买量不断上升。
没有软件,电脑只是一架空壳。
电脑销售量的快速增长必然带来软件业的繁荣,软件开发商的生产者剩余不断增加,比尔·盖茨的个人财富也会随之增加。
图7-13 软件市场供求图10.考虑医疗保险如何影响所进行的医疗服务量。
假设一般的就医治疗成本为100美元,但一个有医疗保险的人只需自付20美元。