北大光华管理学院企业价值评估案例
【538】从价值链增值策略中,窥视“绿盛”的成功之道
北京大学光华管理学院案例大赛企业管理组题目名称:从价值链增值策略中,窥视“绿盛”的成功之道案例介绍综述:本案例以绿盛脱颖而出为题,第一部分运用swot分析法,价值链分析,波士顿矩阵等理论工具着重从微观环境出发,分析影响和推动绿盛发展的内部策略选择。
第二部分在明晰绿盛优劣势的基础上,通过核心竞争力分析、品牌策略分析分析,详述了绿盛能够脱颖而出的原因。
每一个案例的背后,都有值得深思的地方。
故而第三部分我们以绿盛的崛起作为其他国产品牌效法的蓝本,以推动民族企业的发展成为研究的重点,提出了一些思考与建议。
关键词:绿盛、核心竞争力、R&V非竞争性战略联盟、品牌形象研究方法:波士顿矩阵分析,swot分析法,核心竞争力分析等研究方法。
概览:绿盛,全球第一个把传统食品与网络经济做到完美的企业;绿盛,全球第一个提出“R&V非竞争性战略联盟”的理论并予以实践的企业。
在改革开放20年间,休闲食品市场逐渐得到了人们的关注,并且是近几十年来中国市场增长速度最快的行业之一。
据统计,目前中国休闲食品销量在200-300亿元左右,未来几年估计将维持在每年增幅在15%左右。
高幅度的增长率使吸引了很多的休闲食品业的新进入者,以至于当前市场上的休闲食品供应量已经超过了人民在当今生活水平下对休闲食品的需求。
但是,企业数量的激增却不能说明整个产业的趋势已达成熟,目前国内休闲食品企业依然处于发展的初级阶段,在新品研发、口味多样化、包装个性化等方面都存在不足,同质化现象也十分严重。
此外,产品品种相对单一,单个产品品种的优势较弱。
也是我国休闲食品生产商存在的普遍问题。
可见,要在这样的初级休闲食品市场中要打拼出走向国际休闲食品高端市场的企业,无疑是困难重重的。
而在这样的市场环境下,一家名为绿盛的牛肉干生产公司为我国的休闲式拼民族企业打开了欧洲的国门,并在与其它几家大型牛肉干生产公司的共同努力下,让牛肉干产业走在了休闲食品产业的前端。
北大光华管理学院MBA会计学案例库
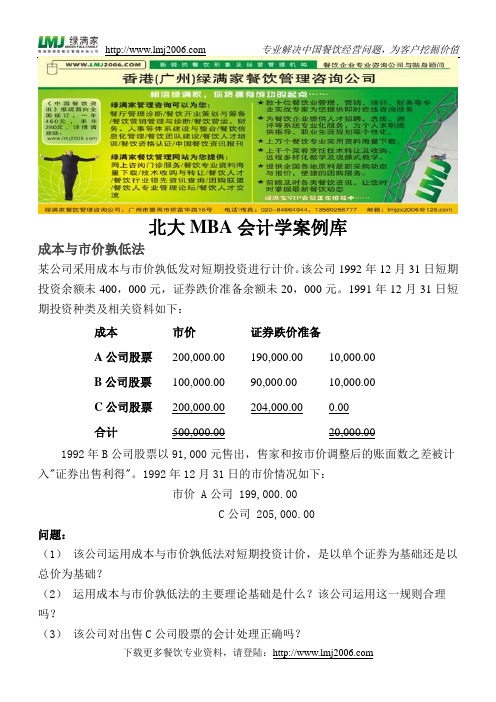
北大MBA会计学案例库成本与市价孰低法某公司采用成本与市价孰低发对短期投资进行计价。
该公司1992年12月31日短期投资余额未400,000元,证券跌价准备余额未20,000元。
1991年12月31日短期投资种类及相关资料如下:成本市价证券跌价准备A公司股票200,000.00190,000.0010,000.00B公司股票100,000.0090,000.0010,000.00C公司股票200,000.00204,000.000.00合计500,000.0020,000.001992年B公司股票以91,000元售出,售家和按市价调整后的账面数之差被计入"证券出售利得"。
1992年12月31日的市价情况如下:市价 A公司 199,000.00C公司 205,000.00问题:(1)该公司运用成本与市价孰低法对短期投资计价,是以单个证券为基础还是以总价为基础?(2)运用成本与市价孰低法的主要理论基础是什么?该公司运用这一规则合理吗?(3)该公司对出售C公司股票的会计处理正确吗?(4)该公司于1992年12月31日还需要做什么分录,以反映有价证券市价的变化?阳澄湖公司以下是阳澄湖公司1996年发生的部分经济业务:(1)因为火灾物品贱卖(fire sale ),价值140,000元的设备以110,000元的价格购入。
所作分录为:借:机器设备140,000贷:现金110,000收入30,000(2)预计销售价格减去估计的销售成本(销售费用)后,成本为380,000元的商品存货在资产负债表中确认的金额为460,000元。
记录商品存货增值的会计分录是:借:商品存货80,000贷:收入80,000(3)公司总裁使用他自己的钱购买小帆船自用,所作会计分录如下:借:杂项费用80,000贷:收入80,000(4)1996年度房屋折旧为23,000元,因为房屋市价上涨过大,所以年底所作的计提折旧分录为:借:留存收益23,000贷:累计折旧--房屋23,000(5)以股票换入设备,股票总面值为70,000元,公平市价为300,000元,设备的公平市价不详,交换时所作的会计分录是:借:机器设备:70,000贷:股本70,000(6)收到顾客的购货定单,购买本公司商品16,000元。
【823】阳光 案例大赛分析报告最终版
案例介绍案例选题的原因杭州娃哈哈集团有限公司创建于1987年,为中国最大全球第五的食品饮料生产企业,在资产规模、产量、销售收入、利润、利税等指标上已连续11年位居中国饮料行业首位,成为目前中国最大、效益最好、最具发展潜力的食品饮料企业;在饮用水“三大巨头”中占有不可撼动的地位。
结合我们专业课上对康师傅“低价”低成本策略、农夫山泉“水源”的控制策略、娃哈哈“渠道为王”的分销策略,我们小组选定了娃哈哈集团股份有限公司,分析其产品结构及管理,整理其策略规划,从中学习与市场营销相关的现实经验。
案例的内容摘要我们首先分析了杭州娃哈哈集团有限公司的发展历程和基本情况,从近5年的销售收入看娃哈哈毫无疑问是行业霸主;娃哈哈集团公司将自己定位为“全方位饮料公司”的过程中,其产品线长度和宽度、产品项目种类和总数得到了很大的扩充,对产品的介绍是我们的第二部分;接下来我们从行业和内部进行了产品营销计划的的分析:运用SWOT分析整理出了娃哈哈现阶段的优势、劣势、机会和威胁,以更好地认识娃哈哈公司的现状和产品情况;运用PEST分析整理了娃哈哈公司所处的政治、经济、社会文化风俗、技术大环境,以更好地认识娃哈哈的背景情况。
我们的重点内容是对娃哈哈公司的产品进行产品策略、价格策略、促销策略、分销策略等4P、4C方面的营销策略进行分析。
案例分析的逻辑思路与方法及关键词等首先认识娃哈哈公司的基本情况和产品分类,然后对企业所面临的大环境和行业竞争小环境进行分析;重点对娃哈哈公司自身的优势、劣势、机会和威胁进行整理;最后收集汇总了公司最近的产品营销策略,从产品、品牌、促销、定价、分销、国际市场营销等方面分析了其策略。
其中主要运用了SWOT和PEST分析。
关键词:基本情况行业竞争者 SWOT PEST 产品4P策略基本情况一、企业介绍杭州娃哈哈集团有限公司创建于1987年,为中国最大全球第五的食品饮料生产企业,在资产规模、产量、销售收入、利润、利税等指标上已连续11年位居中国饮料行业首位,成为目前中国最大、效益最好、最具发展潜力的食品饮料企业。
北大光华管理学院“企业价值评估”案例
北大光华管理学院“企业价值评估”案例北大光华治理学院“企业价值评估”案例课堂文·何风志北大光华治理学院访咨询教授黄铁鹰戴着一顶太阳帽走进教室,帽子前面绣着一只展翅的雄鹰。
尽管课程安排在周末,然而座位间的过道也站满了人。
想想看,一位曾经担任过拥有300多亿元资产的华润创业公司总经理、参与收购兼并的企业价值总额达15亿美元的行家讲授收购实战案例,“票房”自然有保证。
“今天,我们以华润收购黄海啤酒厂为案例来探讨企业价值评估的咨询题。
”黄教授开门见山介绍道。
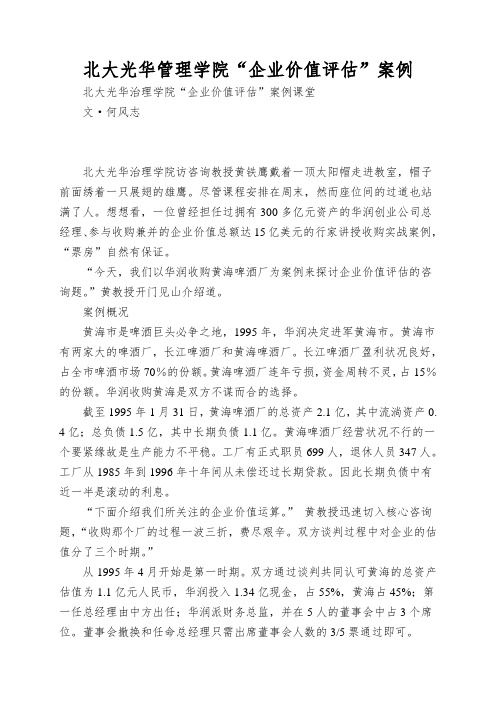
案例概况黄海市是啤酒巨头必争之地,1995年,华润决定进军黄海市。
黄海市有两家大的啤酒厂,长江啤酒厂和黄海啤酒厂。
长江啤酒厂盈利状况良好,占全市啤酒市场70%的份额。
黄海啤酒厂连年亏损,资金周转不灵,占15%的份额。
华润收购黄海是双方不谋而合的选择。
截至1995年1月31日,黄海啤酒厂的总资产2.1亿,其中流淌资产0. 4亿;总负债1.5亿,其中长期负债1.1亿。
黄海啤酒厂经营状况不行的一个要紧缘故是生产能力不平稳。
工厂有正式职员699人,退休人员347人。
工厂从1985年到1996年十年间从未偿还过长期贷款。
因此长期负债中有近一半是滚动的利息。
“下面介绍我们所关注的企业价值运算。
”黄教授迅速切入核心咨询题,“收购那个厂的过程一波三折,费尽艰辛。
双方谈判过程中对企业的估值分了三个时期。
”从1995年4月开始是第一时期。
双方通过谈判共同认可黄海的总资产估值为1.1亿元人民币,华润投入1.34亿现金,占55%,黄海占45%;第一任总经理由中方出任;华润派财务总监,并在5人的董事会中占3个席位。
董事会撤换和任命总经理只需出席董事会人数的3/5票通过即可。
1995年5月,第二时期开始。
外资公司BBI介入。
他们同黄海专门快签订了合资协议。
该公司同意黄海总资产估值1.3亿,并投入1.06亿的二手设备占合资公司的45%股份,黄海占55%;董事长和总经理均由中方出任。
【达芙妮】估值报告

北京大学光华管理学院案例大赛初赛案例分析报告案例介绍鞋类相对服装对人的修饰性稍弱,在服饰中扮演以“饰”为主的角色,因此女鞋消费觉醒较晚,直到近年女鞋市场才经历了高速发展。
而国内女鞋品牌大多定位于中高端市场,例如百丽国际、千百度、星期六等。
但在中低端女鞋市场中有较大影响力的只有达芙妮。
达芙妮通过更加灵活的街边店模式得以迅速扩张,成为中国女性喜爱的女鞋品牌,连续十六年保持同类产品全国销量第一。
此外,达芙妮作为高成长公司却保持每年30%的较高股利支付率,违背了成长型公司股利政策的一般规律,导致其现金流压力增大。
因此我们选择达芙妮国际控股有限公司对其进行详细的分析估值,为投资者挖掘投资机会。
本案例分析报告采用“瀑布流”方法对达芙妮国际进行估值。
我们首先介绍了达芙妮国际所处的宏观和行业环境,并分析了女鞋行业的市场前景与行业格局以及达芙妮公司在行业中的地位和其主要竞争对手。
接着我们分析达芙妮国际的公司概况和业务情况,在此基础上我们分析了达芙妮的主要财务比率和其盈利质量,并与其主要竞争对手百丽进行对比。
然后基于以上分析并结合公司最新发展动向,我们对达芙妮的同店增长率、销售点增长以及毛利率、销售分销费率等财务指标做出预测并为其股票估值。
最后从宏观环境、竞争威胁、行业消费结构变化和财务状况几个方面为投资者给出风险提示。
我们使用DDM和DCF模型对达芙妮股票进行估值。
估值思路如下:首先分析宏观环境和女鞋消费市场,结合达芙妮最近五年的业绩表现,得到达芙妮未来三年同店增长率和销售点增长率,进而得到达芙妮单店销售收入,从而估计其未来三年销售收入。
在预测达芙妮毛利率和销售费率等主要成本费率指标的基础上,预测其未来三年利润及相应的投资支出,并做出预期的财务报表。
我们用预期达芙妮长期净资产收益率乘以其再投资比率得到达芙妮的长期增长率。
考虑到达芙妮在香港上市,我们以一年期HIBOR利率作为无风险利率,并用最近25年恒生指数年平均收益率为市场预期收益率,以及Reuters提供的达芙妮β系数,用CAPM模型计算出贴现率。
北大光华财务管理 第二讲 价值提升
费用
息税前收益 所得税 税后净营业利润
投资到风险程度相近的项目上可以获得的 收益——债务和权益的加权成本
资本成本 = 投资资本 × 加权资本成本
EVA 与股价直接相关...
管理EVA就等于管理公司的价值
股价 股价
PV EVA C
PV NOPAT C
MVA
PV EVA2 PV EVA1
PV EVA3
第二章 投资决策与公司价值提升 ——美国E.G.公司案例分析
一、投资决策是公司财务管理的一个关键环节 二、公司价值的决定与价值驱动分析 三、公司风险的构成与投资决策 四、EVA与公司管理层激励 五、EG公司案例
一、投资决策是公司财务管理 的一个关键环节
• 核心:原有股东的价值最大
• 关键环节
– 投资 – 融资 – 资本成本 – 资本结构
公司价值的驱动
• 公司价值与权益资本收益率的关系 • 权益资本收益率(ROE)的计算 • ROE 分解为毛利率、周转率和财务杠杆 • 提升ROE的途径
三、公司风险的构成与投资决策
• 公司风险的划分
–营业风险 –财务风险 –项目投资的风险
–购并风险
• 风险直接决定公司价值
营业风险的决定因素
• 营业风险的定义 • 客观因素 • 主观因素 • 营业风险与道德风险的两难选择
如何对待营业风险 ——多元化经营的害处!
• 鸡蛋与金蛋、金鸡的比喻 • 转行的风险
• 购并中的营业风险
• 购并风险的两个比喻 • 多元化必须符合公司的战略 • 众多的实例:中远、光大、四通、海尔、可口可乐、 活力28、深圳报业集团等
如何对待营业风险
• 倾向于营业风险高的企业,还是营业风险低的企业?
光华管理学院相对估值法
Why relative valuation?
4
“If you think I’m crazy, you should see the guy who lives across the hall”
Jerry Seinfeld talking about Kramer in a Seinfeld episode
Describe the multiple
Analyze the multiple
Apply the multiple
7
Definitional Tests
8
Is the multiple consistently defined?
Proposition 1: Both the value (the numerator) and the standardizing variable ( the denominator) should be to the same claimholders in the firm. In other words, the value of equity should be divided by equity earnings or equity book value, and firm value should be divided by firm earnings or book value. The variables used in defining the multiple should be estimated uniformly across assets in the “comparable firm” list. If earnings-based multiples are used, the accounting rules to measure earnings should be applied consistently across assets. The same rule applies with book-value based multiples.
【251】北大光华案例分析大赛-飞翔的黑鱼-Valuation_of_The_Fresh_Market
北京大学光华管理学院案例大赛Valuation of the Fresh Market——企业管理组参赛作品飞翔的黑鱼——冯翼翔, 王远韬,俞晓婧Valuation of the Fresh Market 2013/4/14 Part 1: Competitive analysisTABLE OF CONTENTSChapter 1: Preliminary Assessment (1)A. Industry Overview (1)B. Target Company (2)C. Comparable Companies (2)D. Company Comparison (3)Chapter 2: Financial Ratios (11)Chapter 3: Competitive Advantage (21)A. “Smal ler-box Format” strategy (21)B. Concentration and Pricing (22)C. Shopping environment (24)D. Infrastructure (26)Chapter 1: Preliminary AssessmentA.Industry OverviewAfter skimming through a variety of industries, we decided to pick up the U.S. food retailer industry as our target. However, there’s no crystal clear definition of this industry, since it encompasses store formats ranging from small grocery shops and convenience stores to large supermarkets. Some of them mainly retail food, while others retail different kinds of commodities including food. These retailers may operate in different business models according to their sizes and product categories, but they do compete with each other when it comes to selling food directly to consumers.Key trends that will continue to shape the food retailer industry include:(i)Increasing focus on the customer shopping experience: Supermarkets areenhancing or attempting to enhance the consumer’s shopping experience in stores even as price competition is increasing. Many conventional supermarkets have reduced new store expansion to direct capital expenditure budgets toward remodeling existing stores. In addition, supermarkets are striving to be more innovative and responsive to consumer preferences with their consumer interactions and product offerings.(ii)Emphasis on healthy, fresh and quality offerings: Supermarkets are increasingly providing and marketing fresh food items consistent with ongoing health trends and greater consumer awareness of the negative aspects of processed foods. Many conventional supermarkets are attempting to complement center aisle grocery formats with fresh formats that emphasize high-quality perishables and prepared foods. The increased popularity of farmers’ markets over the past few years is also indicative of a consumer preference for fresh food items. Additionally, the growing consumer demand for fresh, quality offerings has improved the infrastructure for, and increased the supply of, these items, resulting in improved sourcing, distribution and pricing.(iii)Localization: An increasing number of consumers believe that locally-grown products are fresher and taste better. Consumers often purchase locally-grown food because they prefer to support local growers. In addition, these consumers may believe that locally-grown food results in a reduced environmental impact.(iv)Rise of private label: Supermarkets are increasingly developing and promoting private-label brands to distinguish themselves from their competitors and promote consumer loyalty. These private-label brands can also offer benefits to retailers through increased margins and, in certain instances, to customers through lower prices compared to branded products. Another key contributor to private label growth has been the improved product quality image and exclusivity of certain brands, which can further help to differentiatesupermarkets from each other.(v)Aging customer demographic: According to the U.S. Census Bureau, by 2030, one in five U.S. residents will be 65 or older, driven by an aging Baby Boomer population which, we believe, tends to make a greater number of shopping trips and higher food at home spending per household than younger age groups.1B.Target CompanyAs stated in our company description, among all the food retailers we choose to value the Fresh Market (NASDAQ: TFM), which is a specialty food retailer. The Company focuses on perishable product categories including meat, seafood, produce, deli, bakery, floral, sushi and prepared foods. The Fresh Market’s non-perishable product categories consist of grocery and dairy products, as well as specialty foods, including bulk, coffee and candy, and beer and wine. As of January 29, 2012, the Fresh Market operated 113 stores in 21 states, primarily in the Southeast, Midwest and Mid-Atlantic United States. In October 2011, the Company formed the Fresh Market Gift Company, LLC (Giftco), as a wholly owned subsidiary. Giftco was formed to administer the Company’s gift card program. The Company’s gift selection includes candles, cookbooks, kitchen items and seasonal and holiday gift baskets.To summarize, the Fresh Markets mainly competes in perishable foods, but it also involves in grocery, dairy products, etc.parable CompaniesWhile narrowing down, we find a subset of its competitors to form our comparable company list. These companies mainly retail food just like the Fresh Market, mostly operate only in USA (we will demonstrate their geographical distribution in graphs below), have a similar market capitalization as the Fresh Market, and are all publicly traded with more than f our years’ historical data. These comparable companies are as follows:(i)SafewaySafeway (NYSE: SWY) is a food and drug retailer in North America. As of December 31, 2011, the Company had 1,678 stores. Its United States retail operations are located principally in California, Hawaii, Oregon, Washington, Alaska, Colorado, Arizona, Texas, the Chicago metropolitan area and the Mid-Atlantic region. Safeway’s Canadian retail operations are located principally in British Columbia, Alberta and Manitoba/Saskatchewan.(ii)Harris Teeter SupermarketsHarris Teeter Supermarkets (NYSE: HTSI), formerly Ruddick Corporation, is a holding company. The Company, through its wholly owned subsidiary, Harris Teeter, Inc. is engaged in the retail supermarket business. Harris Teeter operates a regional1See page 5 of the Fresh Market’s 10-K Annual Report, filed with SEC, on March 29, 2012 at/Archives/edgar/data/1489979/000114420412017856/v306421_10k.htmchain of supermarkets in eight states primarily in the southeastern and mid-Atlantic United States, and the District of Columbia. These supermarkets offer a range of groceries, produce, meat and seafood, delicatessen items, bakery items, wines and non-food items, such as health and beauty care, general merchandise and floral.(iii)Weis MarketsWeis Markets (NYSE:WMK) is engaged principally in the retail sale of food in Pennsylvania and surrounding states. The Company's retail food stores sell groceries, dairy products, frozen foods, meats, seafood, fresh produce, floral, pharmacy services, deli products, prepared foods, bakery products, beer and wine, fuel and general merchandise items, such as health and beauty care and household products. As of December 31, 2011, the Company owned and operated 161 retail food stores.(iv)Ingles MarketIngles Markets (NYSE: IMKTA) is a supermarket chain in the southeast United States. As of September 25, 2010, the Company operated 202 supermarkets, including 73 in Georgia, 69 in North Carolina, 36 in South Carolina, 21 in Tennessee, two in Virginia and one in Alabama. The Company’s supermarkets are located in suburban areas, small towns and neighborhood shopping centers. Ingles supermarkets offers customers a range of advertised food products, including grocery, meat and dairy products, produce, frozen foods and other perishables, and non-food products. Non-food products include fuel centers, pharmacies, health and beauty care products and general merchandise. The Company also offers private label items. The Company’s modern stores focuses on selling products, including perishable departments featuring organic and home meal replacement items, in-store pharmacies, on-premises fuel centers, and a selection of food and non-food items to provide a one-stop shopping.(v)SUPERV ALUSUPERV ALU (NYSE: SVU) is a United States grocery channel. It operates in two segments: Retail food and Independent business. The Company leverages its distribution operations by providing wholesale distribution, logistics and service solutions to its independent retail customers through its Independent business segment. The Retail food segment derives revenues from the sale of groceries at retail locations operated by the Company, and Independent business segment profits from wholesale distribution to independently-owned retail food stores and other customers.2pany Comparison(i)Comparison of Geographical DistributionWe can see these companies’ geographical distribution from graphs below.The Fresh Market:2See Google Finance at/finance?q=NASDAQ%3ATFM&sq=the%20fresh%20market&sp=2&ei=e6xnUIjWGtS00 QGcdwSafeway:Harris Teeter Supermarkets:Weis Markets:Ingles Market:SUPERV ALU:It is straightforward to conclude from the above maps that all these company are geographically overlapped, and that many of them lay emphasis on the eastern part of USA, which indicates they directly compete with each other. And as we described in the industry trend, a great deal of attention has been drawn on localization in this industry. Those companies doing business within same geographic areas may end up developing similar business models.(ii)Comparison of Product CategoriesApart from the geographical competition, we can also compare the kinds of food they retail in detail.The Fresh Market focuses on perishable product categories, which include meat, seafood, produce, deli, bakery, floral, sushi and prepared foods.Safeway’s stores provide a range of grocery items. Most stores offer a line of food and general merchandise and feature a variety of specialty departments, such as bakery, delicatessen, floral, seafood and pharmacy.Harris Teeter Supermarkets offer a range of groceries, produce, meat and seafood, delicatessen items, bakery items, wines and non-food items, such as health and beauty care, general merchandise and floral.Weis Market's retail food stores sell groceries, dairy products, frozen foods, meats, seafood, fresh produce, floral, pharmacy services, deli products, prepared foods, bakery products, beer and wine, fuel and general merchandise items, such as health and beauty care and household products.Ingles supermarkets offers customers a range of advertised food products, including grocery, meat and dairy products, produce, frozen foods and other perishables, and non-food products. Non-food products include fuel centers, pharmacies, health and beauty care products and general merchandise.SUPERV ALU’ retail food segment derives revenues from the sale of groceries at retail locations operated by the Company, and the Independent business segment derives revenues from wholesale distribution to independently-owned retail food stores and other customers.As we can see from above, these retailers have a strong focus on perishable foods,including meat, seafood, deli, and bakery, etc. That is to say, they share similar traits from the operating perspective as well. Days of inventory held are critical for perishable food retailers as these commodities deteriorate at a relatively fast speed. This may further induce these companies to adopt homogeneous strategies.(iii)Comparison of Online BusinessAll six retailers have online display channels, presenting beautifully their food supply as well as other merchandise and offering attractive recipes and coupons for customers.The Fresh Market has online shopping access for TFM coffee club membership, but tangible food cannot be ordered on the website. Safeway provides online shopping which requires online registration. Harris Teeter provides plenty of groceries to seven states, which will be quite convenient for consumers there. Weis Markets provide groceries mainly in Pennsylvania. Ingles Markets allow customers to order food online, but requires them to pick up in person. SUPERV ALU provides various links to its chain stores which provide online shopping with various groceries.Therefore, online business for groceries is really a common trend across the industries, which further increases the comparability of the companies.(iv)Comparison of Risk, Profitability and Growth PotentialThe graph above shows quick ratios of different companies. As we can see, TFM has similar quick ratio to its competitors except WMK, since WMK has very few liabilities. And the fact that TFM has the smallest quick ratio may enclose two things. Firstly, TFM may face certain liquidity problem. Secondly, we may say TFM is capable of using its resources efficiently.The graph above shows D/E ratio of different companies. As we can see, TFM has a decreasing D/E ratio which is gradually approaching those of SWY and HTSI.From the above graph, we can see four of them really have close ROE/ROAThe two graphs above show that all these companies except for SVU generally has similar profit margin while SVU is below the average. And the companies have quite the same asset turnover ratio except that TFM is a bit higher, which may result from competitive advantages.The graph above shows the PE ratios of these companies. As we can see, TFM’s comparable companies do have quite close P/E ratios, while TFM has a much higher one. P/E is an indicator of the growth potential from the view of investors, which might be biased sometimes but basically has an element of truth. As TFM is relatively new in the stock market, we still need time to check if this high expectation for TFM is rational.Chapter 2: Financial RatiosThe tables below list the financial ratios of the Fresh Market as well as its comparable companies.The Fresh Market:NAME:TICKER SYMBOL:TFM PRIMARY SIC CODE:.STOCK EXCHANGE:14CUSIP:35804HFinancial RatiosFiscal Year:20072008200920102011(FYR Ending):(31DEC2007 )(31DEC2008 )(31DEC2009 )(31DEC2010 )(31DEC2011 )Return on Common Equity .833.720.331.405Return on Assets.302.221.099.182Unlevered profit margin .044.060.025.048Asset Turnover Ratio 6.832 3.675 3.948 3.812 Cash251.793188.174300.451154.516 Accounts Receivable, Net 1,206.054615.006619.926356.683 Inventories50.47627.62929.90230.704 Other Current Assets 315.213176.048110.87696.844 Total Current Assets35.99120.48621.09619.168 Property, Plant, and Equipment, net 8.444 4.484 4.884 4.814 Other Assets6,539.3853,629.183882.839407.591 Property, Plant, and Equipment, gross 5.861 2.998 3.030 2.894 Total Assets6.832 3.675 3.948 3.812Cost Structure Ratios COGS Expense Ratio 69.56%67.91%67.23%66.89% SG&A Expense Ratio22.73%22.69%22.21%22.24% Advertising Expense Ratio 0.65%100.65%200.65%300.65% D&A Expense Ratio 3.07% 3.23% 3.40% 3.29% Non-operating Income 0.07%0.05%0.04%0.05% Special Items 0.00%0.00%-2.96%-0.10% Interest Expense0.72%0.46%0.27%0.22% Income before income tax expense 4.00% 5.74% 3.98%7.31% Income tax expense (benefit) 0.04%0.04% 1.62% 2.67% Minority interest 0.00%0.00%0.00%0.00% Extraordinary items0.00%0.00%0.00%0.00% Discontinued Operations 0.00%0.00%0.00%0.00% Net Income3.96% 5.71% 2.35%4.64%Working Capital Management Ratios Current Ratio .781.699.775.777 Quick Ratio.224.159.268.311 Cash flow to current liabilities 1.063 1.488 1.643 1.337 Days of Purchases outstanding 7.51714.22813.98214.979 Days of Inventory held10.39519.45318.15617.771 Accounts Receivable Collection Period .303.620.637 1.075 Trade Cash Cycle17.61033.06031.50131.675Property, Plant and Equipment Ratios Depreciable Life of Gross PPEQ 5.56010.3119.70710.493 Depreciable Life of Net PPEQ 3.859 6.895 6.023 6.308Leverage Ratios6.161 4.417 3.589 2.964 Total Debt to Total Assets .557.417.320.198 Total Liabilities to Total Assets .838.710.732.607 Total Debt to Common Equity 3.4302.1491.314.747Reconciliation of Income Taxes Federal Statutory Rate.350.350.350.350 Income tax expense (federal)35353535 State taxes on income(net of federal) 00 4.07 3.85 Canadian tax rate differential 0Effective Tax Rate35.0%35.0%39.1%38.9%FRESH MARKET INC NASDAQ-NMS Stock MarketIngles Market:NAME:TICKER SYMBOL:IMKTAPRIMARY SIC CODE:5411STOCK EXCHANGE:14CUSIP:457030Financial RatiosFiscal Year:20072008200920102011(FYR Ending):(31DEC2007 )(31DEC2008 )(31DEC2009 )(31DEC2010 )(31DEC2011 )Return on Common Equity .135.072.077.090Return on Assets.067.047.047.050Unlevered profit margin .026.021.021.022Asset Turnover Ratio 2.568 2.255 2.231 2.268 Cash309.17880.31648.25393.582 Accounts Receivable, Net 61.24352.44655.73360.225 Inventories13.20512.29812.18012.107 Other Current Assets 308.240290.253301.057286.899 Total Current Assets10.1488.6008.0598.820 Property, Plant, and Equipment, net 3.476 3.102 3.144 3.212 Other Assets322.272209.267166.01961.652 Property, Plant, and Equipment, gross 2.027 1.845 1.835 1.831 Total Assets2.568 2.255 2.231 2.268Cost Structure Ratios COGS Expense Ratio 74.81%74.81%75.21%75.51% SG&A Expense Ratio19.28%19.39%19.23%18.99% Advertising Expense Ratio 0.65%100.65%200.65%300.65% D&A Expense Ratio 2.07% 2.34% 2.29% 2.25% Non-operating Income 0.20%0.15%0.16%0.24% Special Items 0.00%-0.31%0.00%0.00% Interest Expense1.58% 1.89% 1.95% 1.78% Income before income tax expense2.45% 1.42% 1.48% 1.70% Income tax expense (benefit) 0.85%0.53%0.55%0.61% Minority interest 0.00%0.00%0.00%0.00% Extraordinary items0.00%0.00%0.00%0.00% Discontinued Operations 0.00%0.00%0.00%0.00% Net Income1.60%0.88%0.93% 1.09%Working Capital Management Ratios Current Ratio 1.322 1.854 1.350 1.340 Quick Ratio.300.665.429.297 Cash flow to current liabilities .354.450.403.335 Days of Purchases outstanding 21.93919.82618.72321.069 Days of Inventory held36.95039.67739.84639.928 Accounts Receivable Collection Period 6.0567.037 6.615 6.118 Trade Cash Cycle52.83352.46651.95354.879Property, Plant and Equipment Ratios Depreciable Life of Gross PPEQ 23.78123.20323.74524.247 Depreciable Life of Net PPEQ 13.87113.79913.86113.822Leverage Ratios3.452 3.694 3.752 3.722 Total Debt to Total Assets .522.560.535.528 Total Liabilities to Total Assets .720.738.729.733 Total Debt to Common Equity 1.7202.0012.0531.978Reconciliation of Income Taxes Federal Statutory Rate.350.350.350.350 Income tax expense (federal)27889156491708621249 State taxes on income(net of federal) 185683826292145Canadian tax rate differential 0Effective Tax Rate37.3%36.9%40.4%38.5%INGLES MARKETS INC -CL A NASDAQ-NMS Stock MarketHarris Teeter Supermarkets:NAME:TICKER SYMBOL:HTSIPRIMARY SIC CODE:5411STOCK EXCHANGE:11CUSIP:414585Financial RatiosFiscal Year:20072008200920102011(FYR Ending):(31DEC2007 )(31DEC2008 )(31DEC2009 )(31DEC2010 )(31DEC2011 )Return on Common Equity .117.106.126.094Return on Assets.069.056.067.053Unlevered profit margin .028.024.029.024Asset Turnover Ratio 2.475 2.303 2.357 2.212 Cash141.309121.60179.34335.999 Accounts Receivable, Net 39.93842.92742.71748.067 Inventories13.12713.09413.95214.106 Other Current Assets 116.169114.025123.03630.546 Total Current Assets8.5548.5728.635 6.570 Property, Plant, and Equipment, net 4.351 3.983 4.097 4.106 Other Assets17.44515.05815.52717.768 Property, Plant, and Equipment, gross 2.308 2.119 2.131 2.142 Total Assets2.475 2.303 2.357 2.212Cost Structure Ratios COGS Expense Ratio 66.87%67.07%67.39%67.08% SG&A Expense Ratio25.94%25.81%25.13%25.42% Advertising Expense Ratio 0.65%100.65%200.65%300.65% D&A Expense Ratio 2.87% 3.08% 3.08% 3.28% Non-operating Income 0.08%0.10%0.03%0.47% Special Items 0.02%-0.24%0.09%0.00% Interest Expense0.56%0.50%0.47%0.46% Income before income tax expense 3.87% 3.40% 4.05% 4.23% Income tax expense (benefit) 1.44% 1.28% 1.48% 1.63% Minority interest 0.01%0.01%0.02%0.00% Extraordinary items0.00%0.00%0.00%0.00% Discontinued Operations 0.00%0.00%0.00%-0.47% Net Income2.42% 2.11% 2.55% 2.13%Working Capital Management Ratios Current Ratio 1.162 1.177 1.355 1.585 Quick Ratio.401.407.558.986 Cash flow to current liabilities .553.580.606.568 Days of Purchases outstanding 31.93330.97228.20230.223 Days of Inventory held41.58241.56238.82238.575 Accounts Receivable Collection Period 9.4498.7948.8427.804 Trade Cash Cycle64.06663.74158.18360.994Property, Plant and Equipment Ratios Depreciable Life of Gross PPEQ 15.12015.33315.25914.217 Depreciable Life of Net PPEQ 8.0208.1597.9367.417Leverage Ratios2.067 2.164 2.191 2.081 Total Debt to Total Assets .189.198.163.145 Total Liabilities to Total Assets .514.560.524.509 Total Debt to Common Equity .375.419.395.320Reconciliation of Income Taxes Federal Statutory Rate.350.350.350.350 Income tax expense (federal)53939533055517663390 State taxes on income(net of federal) 6589685459978604Canadian tax rate differential 0Effective Tax Rate39.3%39.5%38.8%39.8%HARRIS TEETER SUPERMARKETS New York Stock ExchangeSUPERV ALU:NAME:TICKER SYMBOL:SVUPRIMARY SIC CODE:5411STOCK EXCHANGE:11CUSIP:868536Financial RatiosFiscal Year:20072008200920102011(FYR Ending):(31DEC2007 )(31DEC2008 )(31DEC2009 )(31DEC2010 )(31DEC2011 )Return on Common Equity -.779.100-.634-.990Return on Assets-.126.044-.076-.054Unlevered profit margin -.055.019-.031-.019Asset Turnover Ratio 2.305 2.385 2.489 2.797 Cash184.530180.031196.198219.453 Accounts Receivable, Net 48.83748.10148.26249.016 Inventories16.24916.07516.29316.335 Other Current Assets 194.179129.703129.782170.686 Total Current Assets10.80110.38810.53810.865 Property, Plant, and Equipment, net 5.918 5.579 5.513 5.568 Other Assets5.8056.9577.96611.645 Property, Plant, and Equipment, gross 3.871 3.383 3.090 2.919 Total Assets2.305 2.385 2.489 2.797Cost Structure Ratios COGS Expense Ratio 74.89%77.45%77.52%77.79% SG&A Expense Ratio19.09%17.17%17.67%17.14% Advertising Expense Ratio 0.65%100.65%200.65%300.65% D&A Expense Ratio 2.42% 2.40% 2.50% 2.49% Non-operating Income 0.06%0.03%0.04%0.03% Special Items -8.44%-0.02%-4.91%-4.02% Interest Expense1.45% 1.43% 1.50% 1.44% Income before income tax expense -6.24% 1.56%-4.05%-2.85% Income tax expense (benefit) 0.17%0.59%-0.03%0.03% Minority interest 0.00%0.00%0.00%0.00% Extraordinary items0.00%0.00%0.00%0.00% Discontinued Operations 0.00%0.00%0.00%0.00% Net Income-6.41%0.97%-4.02%-2.88%Working Capital Management Ratios Current Ratio .918.891.903.898 Quick Ratio.312.329.304.299 Cash flow to current liabilities .343.354.307.294 Days of Purchases outstanding 27.39626.62026.91626.352 Days of Inventory held29.99429.31628.90028.726 Accounts Receivable Collection Period 7.6177.7107.6607.527 Trade Cash Cycle49.77348.22648.15647.550Property, Plant and Equipment Ratios Depreciable Life of Gross PPEQ 10.69012.30712.95113.773 Depreciable Life of Net PPEQ 6.9927.4647.2587.219Leverage Ratios3.6104.475 4.7747.518 Total Debt to Total Assets .482.465.491.519 Total Liabilities to Total Assets .853.824.903.998 Total Debt to Common Equity 1.6172.1192.2743.789Reconciliation of Income Taxes Federal Statutory Rate.350.350.350.350 Income tax expense (federal)-937221-533-360 State taxes on income(net of federal) -720-4-1 Canadian tax rate differential 0Effective Tax Rate35.3%38.2%35.3%35.1%SUPERVALU INC New York Stock ExchangeSafeway:NAME:TICKER SYMBOL:SWYPRIMARY SIC CODE:5411STOCK EXCHANGE:11CUSIP:786514Financial RatiosFiscal Year:20072008200920102011(FYR Ending):(31DEC2007 )(31DEC2008 )(31DEC2009 )(31DEC2010 )(31DEC2011 )Return on Common Equity .059-.067.034.027Return on Assets.068-.054.053.046Unlevered profit margin .027-.022.019.016Asset Turnover Ratio 2.510 2.518 2.727 2.887 Cash133.52795.63565.66457.857 Accounts Receivable, Net 80.70378.74876.03372.146 Inventories16.36816.01915.99717.133 Other Current Assets 104.897100.941137.775143.261 Total Current Assets11.04910.47310.18810.364 Property, Plant, and Equipment, net 4.148 3.904 4.066 4.464 Other Assets14.98421.95744.12838.712 Property, Plant, and Equipment, gross 2.255 2.046 2.028 2.149 Total Assets2.510 2.518 2.727 2.887Cost Structure Ratios COGS Expense Ratio 69.04%68.51%68.89%70.34% SG&A Expense Ratio24.17%25.33%25.45%24.43% Advertising Expense Ratio 0.65%100.65%200.65%300.65% D&A Expense Ratio 2.59% 2.87% 2.83% 2.63% Non-operating Income 0.05%0.04%0.08%0.08% Special Items 0.00%-4.83%0.00%0.00% Interest Expense0.84%0.83%0.75%0.66% Income before income tax expense 3.41%-2.33% 2.15% 2.02% Income tax expense (benefit) 1.22%0.35%0.71%0.83% Minority interest 0.00%0.00%0.00%0.00% Extraordinary items0.00%0.00%0.00%0.00% Discontinued Operations 0.00%0.00%0.00%0.00% Net Income2.19%-2.69% 1.44% 1.18%Working Capital Management Ratios Current Ratio .884.903.981.831 Quick Ratio.308.311.373.341 Cash flow to current liabilities .500.602.429.402 Days of Purchases outstanding 31.39831.90832.34832.252 Days of Inventory held32.30233.26033.12030.288 Accounts Receivable Collection Period 4.523 4.635 4.801 5.059 Trade Cash Cycle59.17760.53260.66757.481Property, Plant and Equipment Ratios Depreciable Life of Gross PPEQ 17.14017.05117.41317.676 Depreciable Life of Net PPEQ 9.3188.9338.6868.508Leverage Ratios1.102.995.890.817 Total Debt to Total Assets .315.328.319.359 Total Liabilities to Total Assets .612.669.670.755 Total Debt to Common Equity .350.319.288.277Reconciliation of Income Taxes Federal Statutory Rate.350.350.350.350 Income tax expense (federal)526.6-333.7308.4308.7 State taxes on income(net of federal) 42.2 5.725.220.8 Canadian tax rate differential 0-16-23.1-6.1Effective Tax Rate37.8%36.1%35.2%36.7%SAFEWAY INC New York Stock ExchangeWeis Market:NAME:TICKER SYMBOL:WMKPRIMARY SIC CODE:5411STOCK EXCHANGE:11CUSIP:948849Financial RatiosFiscal Year:20072008200920102011(FYR Ending):(31DEC2007 )(31DEC2008 )(31DEC2009 )(31DEC2010 )(31DEC2011 )Return on Common Equity .049.063.066.072Return on Assets.056.071.072.075Unlevered profit margin .019.025.026.027Asset Turnover Ratio 2.870 2.852 2.746 2.724 Cash32.99130.56923.81721.040 Accounts Receivable, Net 47.56651.59648.42350.205 Inventories12.71012.26111.54312.040 Other Current Assets 580.763446.170412.886356.681 Total Current Assets7.5917.358 6.592 6.523 Property, Plant, and Equipment, net 4.795 4.924 5.059 5.004 Other Assets121.98185.51067.49171.415 Property, Plant, and Equipment, gross 1.925 1.919 1.918 1.908 Total Assets2.870 2.852 2.746 2.724Cost Structure Ratios COGS Expense Ratio 72.18%71.16%70.91%71.33% SG&A Expense Ratio23.10%23.14%23.21%22.58% Advertising Expense Ratio 0.65%100.65%200.65%300.65% D&A Expense Ratio 1.94% 1.88% 1.85% 1.93% Non-operating Income 0.11%0.06%0.08%0.12% Special Items 0.00%0.00%0.00%0.00% Interest Expense0.00%0.00%0.00%0.00% Income before income tax expense 2.89% 3.89% 4.10% 4.27% Income tax expense (benefit) 0.95% 1.40% 1.49% 1.53% Minority interest 0.00%0.00%0.00%0.00% Extraordinary items0.00%0.00%0.00%0.00% Discontinued Operations 0.00%0.00%0.00%0.00% Net Income1.94%2.50% 2.61% 2.75%Working Capital Management Ratios Current Ratio 2.004 1.895 2.197 2.125 Quick Ratio.788.710.979.922 Cash flow to current liabilities .728.615.753.779 Days of Purchases outstanding 21.49723.48426.13624.698 Days of Inventory held39.78841.83744.59342.497 Accounts Receivable Collection Period 7.8117.1937.6777.433 Trade Cash Cycle53.47458.12763.05159.762Property, Plant and Equipment Ratios Depreciable Life of Gross PPEQ 26.74027.78528.12527.120 Depreciable Life of Net PPEQ 10.73610.82610.66510.342Leverage Ratios.886.904.944.973 Total Debt to Total Assets .000.000.000.000 Total Liabilities to Total Assets .221.246.266.275 Total Debt to Common Equity .000.000.000.000Reconciliation of Income Taxes Federal Statutory Rate.350.350.350.350 Income tax expense (federal)24540342683758541151 State taxes on income(net of federal) -483187725382558Canadian tax rate differential 0Effective Tax Rate34.3%36.9%37.4%37.2%WEIS MARKETS INC New York Stock Exchange。
- 1、下载文档前请自行甄别文档内容的完整性,平台不提供额外的编辑、内容补充、找答案等附加服务。
- 2、"仅部分预览"的文档,不可在线预览部分如存在完整性等问题,可反馈申请退款(可完整预览的文档不适用该条件!)。
- 3、如文档侵犯您的权益,请联系客服反馈,我们会尽快为您处理(人工客服工作时间:9:00-18:30)。
北大光华管理学院企业
价值评估案例
This model paper was revised by LINDA on December 15, 2012.
收购中,企业的价值是“侃”出来的
北大光华管理学院“企业价值评估”案例课堂
文·何风志
主讲人:黄铁鹰
北大光华管理学院访问教授黄铁鹰戴着一顶太阳帽走进教室,帽子前面绣着一只展翅的雄鹰。
虽然课程安排在周末,但是座位间的过道也站满了人。
想想看,一位曾经担任过拥有300多亿元资产的华润创业公司总经理、参与收购兼并的企业价值总额达15亿美元的行家讲授收购实战案例,“票房”自然有保证。
“今天,我们以华润收购黄海啤酒厂为案例来探讨企业价值评估的问题。
”黄教授开门见山介绍道。
案例概况
黄海市是啤酒巨头必争之地,1995年,华润决定进军黄海市。
黄海市有两家大的啤酒厂,长江啤酒厂和黄海啤酒厂。
长江啤酒厂盈利状况良好,占全市啤酒市场70%的份额。
黄海啤酒厂连年亏损,资金周转不灵,占15%的份额。
华润收购黄海是双方不谋而合的选择。
截至1995年1月31日,黄海啤酒厂的总资产2.1亿,其中流动资产0.4亿;总负债1.5亿,其中长期负债1.1亿。
黄海啤酒厂经营状况不好的一个主要原因是生产能力不平衡。
工厂有正式员工699人,退休人员347人。
工厂从1985年到1996年十年间从未偿还过长期贷款。
因此长期负债中有近一半是滚动的利息。
“下面介绍我们所关注的企业价值计算。
” 黄教授迅速切入核心问题,“收购这个厂的过程一波三折,费尽艰辛。
双方谈判过程中对企业的估值分了三个阶段。
”
从1995年4月开始是第一阶段。
双方经过谈判共同认可黄海的总资产估值为1.1亿元人民币,华润投入1.34亿现金,占55%,黄海占45%;第一任总经理由中方出任;华润派财务总监,并在5人的董事会中占3个席位。
董事会撤换和任命总经理只需出席董事会人数的3/5票通过即可。
1995年5月,第二阶段开始。
外资公司BBI介入。
他们同黄海很快签订了合资协议。
该公司同意黄海总资产估值1.3亿,并投入1.06亿的二手设备占合资公司的45%股份,黄海占55%;董事长和总经理均由中方出任。
华润承诺,外资公司无论提出什么条件,华润啤酒都奉陪到底。
从1995年11月,艰难的第三阶段开始。
黄海政府是黄海啤酒的股东。
经过多方努力,黄海政府主动提出将黄海啤酒100%卖给华润。
黄海市政府的出价为:总资产2.1亿,其中包括固定资产1.3亿(固定资产的账面价值为1.7亿),流动资产0.4亿,商誉0.4亿。
华润啤酒对黄海啤酒厂的估值:黄海啤酒厂的总资产最多1.3亿,其中包括:固定资产0.9亿、流动资产0.3亿、商誉0.07亿。
“双方对于价值评估有着不同的观点,双方争论的焦点在以下几个方面。
”黄教授条分缕析地介绍:
首先是固定资产的估值。
黄海啤酒厂账面的固定资产价值是1.7个亿,考虑到资产和设备的现状,黄海方只同意将固定资产价值降到1.3个亿。
由于黄海啤酒厂国营企业的性质,使用它所占用的土地不需缴纳土地租金。
华润啤酒接管黄海啤酒厂,总共需要缴纳
4000万的土地使用费。
华润啤酒减去这部分的固定资产成本,采取资产重置的办法计算出黄海啤酒厂的固定资产价值,最多为0.91个亿。
其次是流动资产的估值。
黄海方坚持,双方必须在签合同的同时确认流动资产的账面值0.4亿。
而华润啤酒认为:1.啤酒的流动资产中有很大一部分是在销售渠道中流通的瓶箱包装物,因此流动资产的最后价值必须通过交接日的盘点和对成新率的判断才能确定,不能事先定价。
2.黄海啤酒厂流动资产中的应收账款和待摊费用按照国际通行的会计准则必须要大幅撇账,华润最多承认0.3亿。
第三个分歧是关于商誉的价值。
黄海啤酒对于商誉报价4000万。
华润对黄海啤酒厂商誉价值的评估参考了青啤和雪花啤酒的做法。
青岛啤酒1993年上市时盈利1.9亿,销量33万吨,商标入账1亿。
此外,华润在1993年与雪花啤酒合资时,沈阳雪花净资产1.1亿,盈利0.35亿,销量26万吨,合资作价2.1亿,其中包括商誉入账0.7亿。
而黄海啤酒厂1996年净资产0.6亿,亏损0.02亿,销量2.6万吨,因此,华润啤酒认为,黄海的商誉最多值0.07亿。
“企业是活的,只有在市场上交易了,才会有一个合适的价值”
“在谈判过程中,仅仅六个月的时间,啤酒厂还是原来的啤酒厂,设备还是原来的设备,人还是原来的人,企业的价值何以出现这么大的变化呢”黄老师启发同学们思考。
“究竟啤酒厂的价值是多少钱呢如果你是华润啤酒CEO,你就是当时的我,你说我该不该买如果该买,多少钱合适呢”
一位在资产管理公司工作过的同学首先表达了自己的观点。
她说:“我觉得可以采用未来收入现金流折现的办法进行计算。
根据公司的情况和市场的情况,估算出我们以后每
年的收入现金流,并采用一个合理的折现率。
通过这种办法计算的价值比计算账面价值要科学,因为你买这家公司,不是要买它的资产,而是看中的是资产的增值能力。
”
黄教授点头表示肯定,“你说的有一定道理。
但是,我给大家讲一个小故事。
大家知道全球最成功最着名的投资人是巴菲特。
他2002年给股东的写一封信,说明他对利润预测的看法。
他说,我对我公司的利润不要说下一年,就是下一个季度能赚多少钱我都不敢预测。
”
“我的意思是说,一个公司的发展无论是内部还是外部都有很多不确定因素,明天的事谁能说得准管理再好的公司充其量也只能大概估算一个数,并且还必须加上一句:在政治经济市场和公司没有重大改变的前提下,我们公司在明年有可能实现N元利润。
可是在我们还有记忆的过去十几年里,经营环境有哪几年是‘没有重大变化’呢1993年的通货膨胀,1995年的宏观调控,1997年的金融风暴,2000年的科技泡沫,2001年的
‘9·11’恐怖袭击,2003年的‘非典’。
能预见这些‘重大变化’的只有上帝。
因此常人(包括公司CEO和财务董事)如能计算出企业明天能赚多少钱的,更多的是靠幸运而不是科学。
”
这时,另外一位同学要求发言。
他说,“企业的价值如果用现在的资产的价值来衡量不是很科学,比如,两个公司资产都是100万,一家每年赚10万,另一家每年亏10万,价值肯定不一样。
如果用企业的盈利能力来衡量,也很有问题。
正如您刚才所说,很难预料这个企业能不能挣钱,能挣多少钱。
这好像是一个很怪的问题。
不知道老师是怎么看的”
黄教授没有直接回答,而是抛出了另一个问题。
“企业的价值和一般商品的价值有什么区别呢?
“你要买一辆汽车,你交了钱,就能开着车走了。
在交易的过程中,汽车还是这辆汽车,它是没有发生变化的。
企业呢?你要记住企业是一个活的东西。
它是活的,而不是死的。
它每时每刻都在发生变化。
今天销售额增大了,那么应收账款就增大了,相应的坏账计提就增大了,企业的价值就有可能减少了。
比如说,你今天签订了收购协议,明天一个工人上班故意损坏一个流水线上的关键设备。
这样,这条流水线要歇一周,企业的价值就比昨天的价钱低了。
从另外一方面来说,收购企业和我们在菜市场上买的萝卜和白菜也是一样的。
”
听了最后一句话,有位同学马上问:“是不是企业的价值是由市场决定的是由供需双方讨价还价决定的”
“对!你说的非常对!”黄教授深表赞许。
“企业的价值不是企业的所有者决定的,也不是由购买者决定的。
而是双方谈判协商的结果,是市场决定的。
企业只有在市场上交易了,它才有了一个合适的价值。
它如果不交易,你怎么衡量它的价值呢”
又有同学追问了一句:“是不是可以说企业的价值是‘侃’出来的”
“你总结得非常好!总结的很经典。
企业的价值就是双方侃价‘侃’出来的。
”看着学员在自己一步步的引导下触摸到问题的本质,黄教授显得有些兴奋,开始给大家传授“心经”,“企业价值评估是一门独立的学问,评估方法就有十几种,不同的企业的价
值要用不同的方法来算。
比如同一个行业里的亏损企业和赢利的企业的计算方法是完全不同的, 亏损的企业可能按残值算,赢利的可能按市盈率算。
”
“我刚才说了这么多企业价值的不确定性,不是说不要企业价值评估了。
而是强调,实际企业的交易价格你要考虑更多的因素,不拘泥于数学方法算出来的数字。
”
“再回到这个案例来。
最终,我们是以1.9亿人民币收购的黄海啤酒厂,这个数字远远高于我们在当地新建一个啤酒厂的价格。
我做不了主,向董事会汇报。
董事会中的一位董事是世界第四大啤酒集团的CEO,他告诉我一句话:到有鱼的地方去钓鱼。
——华润啤酒要想在中国占有一席之地就必须要收购黄海啤酒厂,这是华润啤酒战略发展的要求。
”
“只有到了有鱼的地方才能钓到鱼。
”黄教授在结束时又说了一句让学员们揣摩不已的话。