英语四六级考试图表作文模板
图表作文模板
①As can be clearly seen from the graph/table/chart,great changed have taken place in __________ ①图表显示的情况Or: As is shown in the table/figure, .
②The __________ have jumped from _____ to _____. ②描述变化
③When it comes to the reasons for the changes, different people give different explanations. Here I shall just give a few. ③概述原因
④To begin with,首先. ④原因之一
⑤What’s more, . ⑤原因之二
⑥Last but not least, . ⑥原因之三
⑦While it is desirable(合意的)that ___________, there are still some problems
and difficulties for __________ ⑦话题转移
⑧Firstly, __________ ⑧要点一
⑨In addition另外, __________ ⑨要点二
⑩In a word总而言之, __________ ⑩总结
补充:
2.The chart/graph/table/diagram shows that…As is shown in…; According to依照…; As can be seen in…
3. This chart/graph/table/diagram shows a great/sharp/sudden/slow/rapid…. increase/drop...
4. To make a generalization; on the whole大体上一般来说; in general/generally speaking
~~~~~~~~~~~~~~~~~~~~~~~~~~~~~~~~~~~~~~~
Para 1,第一句:This is a _____chart, which demonstrates(示范证明)the number of_____ from ____ to ____.
如果两个图,则:There are two charts below. The _____ chart describes the number
of _____, and the _____ chart illustrates the figure of ____.
第二句:(所有题目适用),From the chart we can see that the number of ______ varies ….in _____.
Para 2, As we can see from the chart,/or It is clear from the chart that ____.
如果有两个图:则:The _____ chart shows that ______./or As we can see from the first chart, _______
Para 3, (如果两个图的话,) It is clear from the second chart that …
Para 4 结尾:From the figures/statistics above, we can see/conclude/draw a
conclusion that…
~~~~~~~~~~~~~~~~~~~~~~~~~~~~~~~~~~~~~~~
第一段:说明图表
开篇句:As the bar chart shows, ____ during the years of ____ to ____.
扩展句:1、As early as 早在_____.2、Then _____ years later, ____.3、And arriving in the year ____, ____.
第二段:解释图表变化原因
主题句:Several factors contribute to _____.
扩展句:1、______. (原因1)2、And ______.(原因)3、Furthermore, ______ (原因4、All these result in ____.
第三段:提出解决办法
结尾句:However, ____ is faced with some problems.
扩展句:1、With _____, ____, the effect of which is not only discouraging, but also challenging.
2、So my principle is to pay due attention to ___, but not just to
~~~~~~~~~~~~~~~~~~~~~~~~~~~~~~~~~~~~~~~
As is shown/indicated/illustrated by the figure/percentage in the table
(graph/picture/pie/chart), __作文题目的议题__ has been on rise/ decrease(goes up/increases/drops/decreases), significantly/dramatically/steadily rising/decreasing from__ in __ to __ in __.
From the sharp/marked decline/ rise in the chart, it goes without saying that…. There are at least two good reasons accounting for __. On the one hand, __. On the other hand,__ is due to the fact that __.In addition, __ is responsible for __.Maybe there are some other reasons to show __.But it is generally believed that the above mentioned reasons are commonly convincing.
As far as I am concerned,I hold the point of view that __. I am sure my opinion is both sound and well-grounded.
~~~~~~~~~~~~~~~~~~~~~~~~~~~~~~~~~~~~~~~
第一部分写作模板——图表式作文
It is obvious in the graphic/table that the rate/number/amount of Y has undergone dramatic changes. It has gone up/grown/fallen/dropped considerably in recent years (as X varies). At the point of X1,Y reaches its peak of….
What is the reason for this change?Mainly there are…reasons behind the situation reflected in the graphic/table. First of all,…(第一个原因). More importantly,…(第二个原因). Most important of all,…(第三个原因). From the above discussions,we have enough reason to predict what will happen in the near future. The trend described in the graphic/table will continue for quite a long time (If necessary measures are not taken, 不太好的变化趋势)。
~~~~~~~~~~~~~~~~~~~~~~~~~~~~~~~~~~~~~~~
1. As is shown by the graph/in the table。。(概述图表)
正如曲线所示,最近54年来该国人口飞速增长。
As is shown by the graph, there has been a rapid increase in the population of the country in the past five years.
2. It can be seen from the (table) that …(得出结论)
shown graph
concluded figures
estimated statistics
A. 从表中所给的统计数字可以看出,从1985年到1990年中国的人均收入迅速提高。
From the statistics given in the table it can be seen that the average personal income of the Chinese people increased (grew 、rose) rapidly from 1985 to 1990.
B. 从曲线图可以得出结论,最近5年来中国人口的出生率已经大大下降。
It can be concluded from the graph that there has been a great decline in birth rates in China in the past five years.
3. …amount to …(数量总计)
add up to合计达/come to达到共计/ sum up to计算什么的总数
全部费用合计200美元。
All the expenses (costs) amount to (= add up to) $ 200.
4. …increase from …to …(数量增减)
Decrease/rise/fall/drop
A. 这个工厂生产的彩电已由1986年的5000台增加到1990年的21000台。
The number of colour TV sets produced by the factory increased (rose , grew , climbed) from 5000 in 1986 to 21000 in 1990.
B.参加者的人数增加到30万。
The number of paticipants grew up to 300000 persons = increased , reaching 300000 persons).
C. 这个学校的教职工人数已减少到700人。
The number of teaching staff members in this school has decreased to 700 persons.
5.(be)three times as + 形容词+ as 总产量total output 钢的年产量the annual output of
上升17% rise by 17per cent steel
日产量the daily output 导致产量下降result in a
diminished output
现在我们地区的粮食产量相当于1970年的3倍。
The grain production (= output)in our area now is three times as great as that of 1970.
https://www.360docs.net/doc/9214794933.html,pared with … , …
与去年相比,今年13项主要产品的产量都有大幅度增长。The factory has an output of 9million cigarettes https://www.360docs.net/doc/9214794933.html,pared with that of last year,the output of 13 main products (= items) this year has increased to a great extent.
7.There is (was) a rapid rise in …be on the rise (收集:https://www.360docs.net/doc/9214794933.html,)
has been sharp increase on the increase/sudden decrease on the decline/steady decline/gradual fall/slow drop/slight
最近几年来这个地区的棉花产量有了迅速增长。
The cotton output in this area has increased rapidly in the past few years.
~~~~~~~~~~~~~~~~~~~~~~~~~~~~~~~~~~~~~~~
——“结尾”段落中常用的句型:
1. In my opinion, …
2. Personally, I …
3. In short (= In brief), …
4. In conclusion, …
5.As far as I’m concerned, …
6. To conclude, it seems clear that …
至于说到我,我赞成前一种观点。所以,我的结论是,只要我们坚持正确的东西,改正错误的东西,我们就一定能成功。
As far as I’m concerned ,I’m in favour o f the former view. Therefore, my conclusion is that we are certain to succeed as long as we stick to what is right and correct what is wrong.
~~~~~~~~~~~~~~~~~~~~~~~~~~~~~~~~~~~~~~~
The chart gives us an overall picture of the ____________(图表主题). The first
we notice is that_______________(图表最大特点). This means that as __________, _________________(进一步说明
We can see from the statistics given that _______________(图表细节一). After V.ing_________(细节一中的第一个变化), the _____V.ed+幅度+时间(紧跟着的变化). The figures also tells us that_________________________(图表细节二). (数据位置,如In the second column), we can see that ____________accounts for _______(进一步描述).
Judging from these figures, we can draw the conclusion that___________(结论). The reason for this, as far as I am concerned is that_____________(给出原因). / It is high time that we V.ed(发出倡议)
~~~~~~~~~~~~~~~~~~~~~~~~~~~~~~~~~~~~~~~
英语四六级图表作文经典用词:
上升:increase、rise、ascend、core、surge、go up、climb、mount、level up 下降:decrease、fall、drop、descend、decline、reduce、lessen、level down 平稳:stable、steady、remain/maintain/keep/be the same as/similar to
波动:fluctuate、fluctuation、rise and falls、up and down
占:occupy、take up、account for、gain
而:while、however、whereas、on the other hand、actually/in fact
相比:by contract、on the contrary、likewise、compared with
最高点:the highest、the top、the summit、the peak、the most
最低点:bottom、less、least、rock bottom
平均:mean、average
趋势:tendency、trend、inclination
预见:prediction
达到顶峰:mount to
在***中占***:***gain the percentage of
有一个稳定的过程:a stable period can be seen
副词:sharply, remarkably, obviously, significantly, gradually, slowly
表示倍数的词汇: double; triple the number of/the percentage of; four/five times 表示多少的词汇: a little/ much/ a lot more/less than…, over…
六级之图表作文
六级之图表作文 Prepared on 22 November 2020
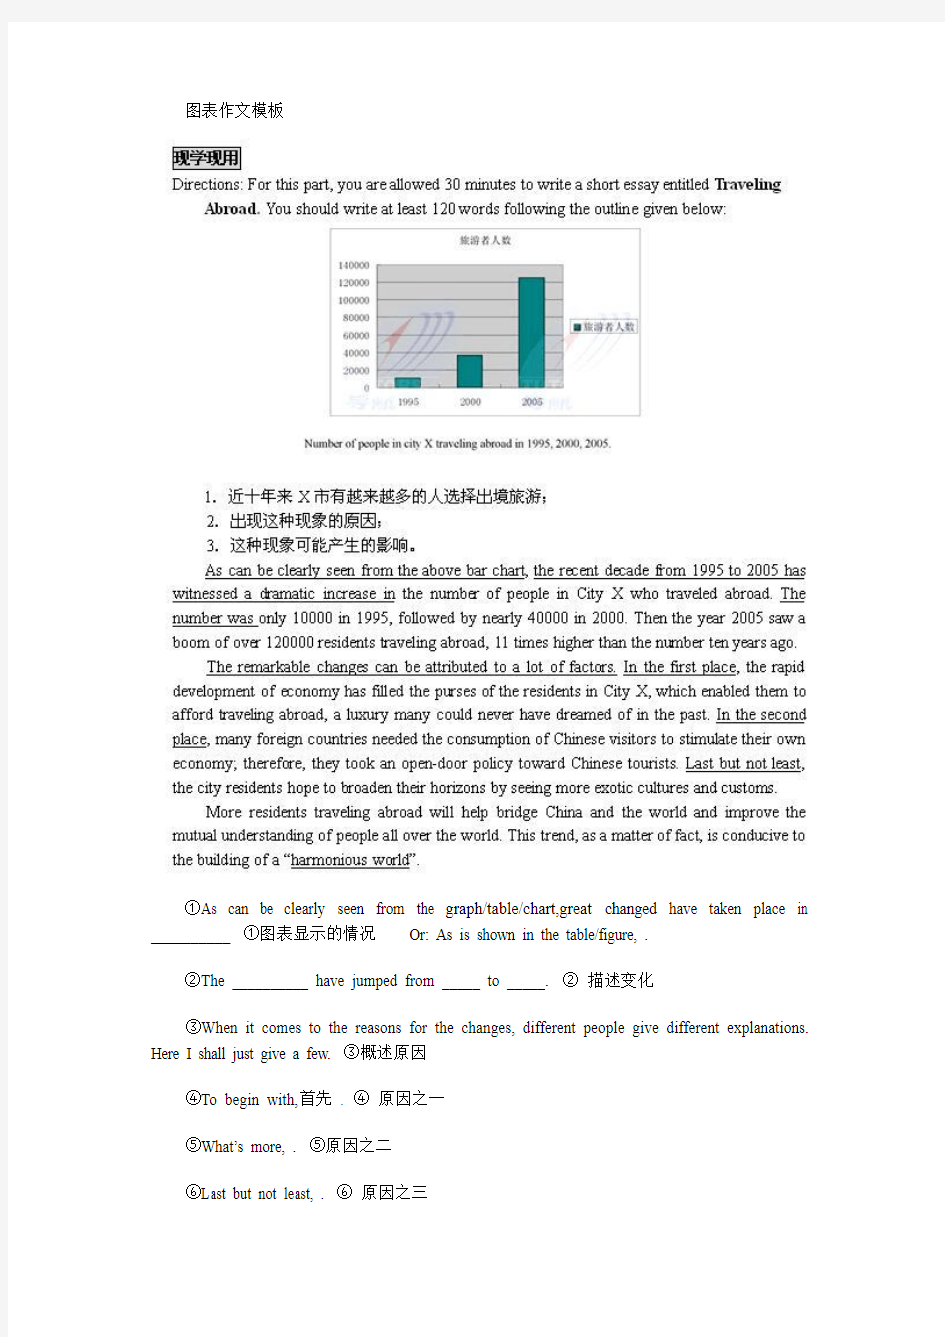
图表作文图表是科学文献中常用的一种表达手段。四六级图表作文利用图形(figure)、表格(table)、曲线图(graph)、柱状图(pie chart)和饼状图(pie chart)等作为写作提示,并以此为依据要求用简洁生动的语言把图标中所给出的信息完整而准确地表达出来。 这一类作文通常前半部分说明图标所表达的信息,后半部分进行议论,不论以何种方式出现,图标作文还是遵循一定的模式。最常见的模式是:第一段:描述现状。简要地描述图表,概括图表所表现的社会问题。第二段:分析原因。剖析图表所反映的深层次问题。用图表来论证第一段提出的主题,或者分析各个数据产生的原因。第三段:结论和启示。从图表中所体现的现象获得结论或者启示,或者对图标所表现的趋势加以预测。 图表作文模式 ①As is shown/depicted/described in the picture/chart, 概括图表内容。②For one thing, 支持这一内容的一个方面。③For another, 支持这一内容的另外一个方面。④It is obvious that 图表所反映的内容。 ⑤Many remarkable factors contribute to主题。⑥First of all, 理由一。⑦In addition, 理由二。⑧Thirdly,理由三。 ⑨Considering all these, I believe that我的看法或偏好。⑩First of all, 个人看法的依据一。⑾Furthermore, 个人看法的依据二。⑿Therefore, 个人的结论或文章的结论。 Example As is shown in the chart, the number of Chinese people traveling abroad increased gradually. For one thing, in 2001, the number of people traveling abroad was seven point five million, which was increased to ten million in 2002. For another, in 2003, there were twelve point one million Chinese people traveling abroad. It is obvious that China is witnessing an ever prosperous overseas tourism. The reasons of the increase lie in several aspects.First of all, with the implementation of China’s reform and opening policy, china’s economy has been growing rapidly and steadily. In addition, people’s income has increased tremendously, so more and more people are now eager to see the outside world with their own eyes. Thirdly, the Chinese government has been simplifying the formalities of traveling abroad and has opened more overseas tourist destinations.
大学英语四级考试图表作文
大学英语四级考试图表作文 1、图形种类及概述法: 饼图:pie chart 直方图或柱形图:bar chart / histogram 表格图:table 趋势曲线图:line chart / curve diagram 泛指一份数据图表:a data graph/chart/diagram/illustration/table 2、图表中的数据(Data )具体表达法 数据(Data )在某一个时间段固定不变:fixed in time 在一系列的时间段中转变:changes over time 3. 持续变化的data 在不同情况下: 增加:increase / raise / rise / go up 减少:shrink/decrease / drop / fall … 波动:fluctuate / undulate / wave 稳定:remain stable / stabilize / level off 4. 最常用的两种表达法: 动词+副词形式(Verb+Adverb form)形容词+名词形式(Adjective+Noun form ) 5. 图表常用动词:show 、describe 、illustrate 、can be seen from、clear 、apparent 、reveal 、represent 、demonstrate 6. 图表常用名词:figure 、statistic 、number 、percentage 、proportion 7、表示数据变化的单词或者词组 rapid/rapidly 迅速的,飞快的, dramatic/dramatically 戏剧
图表类英语作文范文英语作文模板(图表类的)
图表类英语作文范文英语作文模板(图表类的)这里很全 一、图表类作文常用的单词、短语和句型 1.表示数据变化的单词或短语 in the case of (在……的情况下) in terms of (在……方面) increase / raise / rise / go up(增加) decrease / grow down / drop / fall (减少) increased by (增长了) increased to (增长到) the number sharply goes up to(数字急剧上升至)
significant(重大的),steady(平稳的),gradual(逐渐的),slow(慢慢的),stable(稳定的),rapid(快速的)…… 2. 表示从图表得知的信息的句型 The table / chart / graph shows that...(这个图表告诉我们……) Aording to the table / chart /graph, we can see that...(根据图表,我们可以看出……) It can be concluded from the graph that...(从图表中可以得出……) The table shows the changes in the number of...over the period from...to...(该表格描述了在……期间……数量的变化) 二、图表类作文的模式
图表类作文中的图表主要有以下形式:柱形图类(chart)、圆饼图类(pie chart)、曲线图类(line chart)、表格类(table)。写文章时,首先要对图表加以描述,而后引出主题加以讨论,最后得出结论,也就是按照描述图表—解释原因—下结论的步骤来写。切忌对图表不作交代就直接谈论主题。 1.表格类作文的模式 表格类作文一般可以分为三段:第一段对表格中的数据进行描述,只要抓住变化规律即可,切忌一一列举数据;第二段说明变化的原因;第三段得出结论。即: (1) Studying the table carefully, we can see...(仔细研读表格,我们可以看出……) (2) In my opinion, the reasons why...are as follows. Firstly...Secondly...Thirdly...(在我看来,为什么……的原因在于以下几点:第一……第二……第三……)
2020年大学英语四级图表作文范文话题:可持续发展
2020年大学英语四级图表作文范文话题:可持续发展Directions: How can we meet the needs of today without diminishing the capacity of future generations to meet theirs? Sustainable development implies a broad view of human welfare, a long term perspective about social development. Write an essay which should cover: 1) describing the set of drawings below, 2) stating its main idea, and 3) giving your comment. 范文1: The images above are both meaningful and instructive: this man's hard work is not only for his own benefit, but also for the benefit of future generations. The pictures serve to remind us that the existence of our current happiness and valuable national heritage is due to the struggles of our predecessors. We, in turn, should also work hard in order to guarantee the comfort and safety of generations to come. Sustainable development has become a topic of heated debate in recent years. While it is justifiable to satisfy current demands, we cannot neglect the needs of our descendants in the process. Our children also depend on Earth's natural resources and we should not deprive them of such necessities.
英语四六级写作作文模板
作文模版: 图画图表作文 As is shown in the picture,… According to the information conveyed by the picture, … The picture also implies that … It is clear that … There are at least two good reasons for … On the one hand, … Let′s have an example to illustrate … On the other hand, …is due to the fact that … In addition, …is responsible for … Maybe there are some other reasons to show … But it is generally believed that the above mentioned reasons are commonly acceptable. The suggestion as to the best way to cope with the problem is as follows. In the first place, … Moreover, …Last but not the least it is … As far I am concerned, …… I am sure my opinion is both sound and well-grounded.(139words) 议论文(I) It is generally believed that …is a hot topic which is widely talked about both at home and abroad. Now our government attaches great importance to solving this problem. Scientists in this field have put forward a number of suggestions tending to relieve it. To begin with, we should …Furthermore, … It is clear that … People, however, differ in their opinions on this matter. Some people think that … According to them, all of us should … Other argue that …In their opinion, nobody can …without … There is no doubt that … As a consequence, … In short, I firmly support the view that … It is because … So my conclusion is that … (107words) 议论文(II) There is no denying the fact that …is a popular topic which is much talked about not only by …, but also by … It is generally thought that … The reasons for … are as follows. T o begin with, … Secondly,… Therefore, we should attach great significance to solving the problem. There are, I think, at least two possible ways to cope with it. The first way to tackle it is to appeal to the authorities to take drastic measures to (do) …The other policy that is worth adopting is to work out new regulations to (do) …Only in this way can we succeed in dealing with the problem in the near future. To conclude, it seems obvious that … So the prospect we are looking
英语四级写作万能:图表型作文精编版
英语四级写作万能:图表型作文精编版 MQS system office room 【MQS16H-TTMS2A-MQSS8Q8-MQSH16898】
英语四级写作万能模板:图表型作文 图表型作文 此类作文要求考生从提示性文字或图表、图画入手,解释提示性文字、图表、图画反映出的问题,提出问题的危害性或解决这一问题的紧迫性;然后对问题展开分析,提出解决问题的方案或应对措施;最后一段要求考生表明自己的态度、做法等。 a.影响分析型关键句式 The chart / graph/ table/ picture describes that the figure declines/ falls smoothly/ markedly. It indicates that…图表显示数字下降平缓,这表明…. There may be a combination of factors which contribute to / are responsible for …可能是好几个因素造成的结果。 There may be several possible reasons to this phenomenon, which will be demonstrated as follows. 可能有几个原因导致了我们下面所要阐述的现象。 The significant effects of this phenomenon are undeniable, which can be concluded as the following aspects.这一现象的重大影响是不可忽略的,可大致归结为以下几个方面 On one hand, …; On the other hand,…一方面,…;另一方面,… 现象阐释类作文框架 As is shown in the graph above, we can see clearly that great changes have taken place in … from…to… The first … years saw… The last … years witnessed … What are the reasons for the? On my standpoint, there are several as follows. First of all, (______). What is more, (______).Last but not the least,(______). The significant effects of this phenomenon are undeniable, which can be concluded as the following aspects. On one hand, …; On the other hand,… 76 words b.问题解决型关键句式 It is important that effective actions should be taken to prevent the situation. 采取有效措施防止这种情况的发生很重要。
英语作文模板图表作文
图表分析作文1 As is clearly shown in the table/ figure/ graph / chart, 图表总体描述between 年代and 年代. Especially, 突出的数据变化. There are three reasons for 具体表示急剧上升、下降或特殊现象的词. To begin with, 原因一. In addition / Moreover, 原因二. For example, 具体例证. Last but no least, 原因三. In short,总结上文. As far as I am concerned, / For my part, / As for me,作者自己的观点. On the one hand, 理由一. On the other hand, 理由二. In brief,总结上文. 图表分析作文2 The table / figure / graph / chart shows that 图表总述from 年代to年代. It is self-evident that 突出的数据变化. Three possible reasons contribute to 具体表示急剧上升、下降或特殊现象的词或代词代替上文内容. One reason is that原因一. Another reason is that原因二. For instance,举例证. What’s more原因三. As a result, 重述上文之趋势. However, in my opinion 作者观点. For one thing,理由一. For another, 理由二. To sum up,总结上文. 图表分析作文3 It can be seen from the table / figure / graph / chart that图表总述between年代and年代. Especially,突出的数据变化. Why are there such great changes during 图表涉及的年头数years? There are mainly two reasons explaining具体表示急剧上升、下降或特殊现象的词或代词代替上文内容. First,原因一. In the old days,比较法说明过去的情况. But now,说明现在的情况. Second,原因二. As a result,总结上文. In my viewpoint,作者自己的观点. On the one hand,论点一. On the other hand,论点二. 图表分析作文4 As the table / figure / graph / chart shows,图表总述in the past years年代. Obviously,突出的数据变化. Why are there such sharp contrasts during 图表涉及的年头years? Two main factors contribute to具体表示急剧上升、下降或特殊现象的词或代词代替上文内容. First of all,原因一. In the past,比较法说明过去的情况. But now 说明现在的情况. Moreover,原因二. Therefore,总结上文. As I see it,作者自己的观点. For one thing,论点一. For another,论点二. 图表作文补充句型 ?As is shown in the graph… 如图所示… ?The graph shows that… 图表显示… ?As can be seen from the table,… 从表格中可以看出… ?From the chart, we know that… 从这张表中,我们可知… ?All these data clearly prove the fact that… 所有这些数据明显证明这一事实,即… ?The increase of …. In the city has reached to 20%. ….在这个城市的增长已达到20%. ?In 1985, the number remained the same. 1985年,这个数字保持不变. ?There was a gradual decline in 1989. 1989年,出现了逐渐下降的情况.
2014年6月英语四级图表作文范文
2014年6月英语四级图表作文范文:文明风尚 Directions: Understanding is a drop of golden sun, is wellspring of life, and is a bridge between man and the soul of man. Understanding is tolerance, is a kind of se lf restraint. The world needs understanding. Write an essay which should cover: 1) describing the drawing below, 2) stating its main idea, and 3) giving your comment 范文1: The human being differs from the wild beast in that the latter is liable to have a hostile view of others and interact in an unreasonable and aggressive manner. Primitive humans might have acted in such fashion, but civilized humans should cultivate more appropriate behaviors. In the drawing above, a man carrying a large load accidentally steps on a woman's foot. Given that he gracefully apologizes, the woman both accepts his apology and assures him not to worry. The man and woman depicted interact with each other in a courteous and compassionate manner. The woman understands the man did not intentionally step on her foot, and therefore whether or not she is in pain, she does not attack or blame him. Because she is able to view the situation from his perspective, conflict is diverted. Mutual understanding such as this is a fundamental aspect of civilized society. Some people tend to think the worst of others and become angry over even the smallest of matters, regardless of how their own actions are disturbing in turn. Such intolerance only leads to more conflict. Disrespecting or mistreating people not only inflicts pain upon others, but can also harm one's own conscience and attitude. Having compassion for others is an important facet of social intercourse. Once one strives to understand the experience and perspective of another, one can avoid much trouble and conflict, thus making life more peaceful and just for all. 译文: 人类和野兽的区别就在于后者倾向于相互仇视,交往时不讲道理且好斗。原始人也许会如此行事,但文明人应该养成更得体的举止。 上图中,一个手里捧着很多东西的先生无意中踩了旁边女士的脚。在他有礼貌地道歉后,这位女士不仅接受了他的道歉,还让他不必在意。 上图中的先生和女士诠释了在与人交往时应有的礼貌和富有同情心的态度。这位女士知道他并不是有意要踩她的脚,所以无论疼不疼,她都不会攻击或是埋怨这位先生。因为她能设身处地地看待这件事情,一场冲突就避免了。像这样的相互理解是构成文明社会的基本方面。 一些人往往把别人想得特别坏,为点鸡毛蒜皮的事就大发雷霆,而全然不顾他们自己的行为是多么让别人讨厌。这种偏狭只会导致更多的冲突,对人无礼或粗暴不仅会给别人带来不愉快,而且会损害自己的道德水准和仪态。宽厚是社交中重要的一面,一旦一个人努力去理解别人的做法和看法,他就会避免许多麻烦和冲突,而这会让所有人的生活都变得更美好。
英语六级作文图表题
1.大学生心理问题Directions: Write an essay of 160~200 words based on the following bar chart. In your essay, you should 1)first describe the bar chart, 2)then interpret its meaning, and 3)give your comment on it. You should write neatly on ANSWER SHEET 2. (20 points) 话题剖析 如图所示,有一个大时钟,年轻人试图把指针向前推,而老人则尝试把指针向后推,他们累的满头大汗,却都徒劳无功。年轻人之所以要向前推是因为他对未来充满好奇,老人则是希望回到过去,但是时间是不会加快也不会变慢的。该图的寓意是我们应该充实的过好现在的每一天,珍惜现在的时间,这样才不会在年老时后悔。在论证中,可以从以下角度来考虑:时间不以人的意志向前或者倒退,年轻时应该如何充分利用宝贵时间,因为只有珍惜时间的人才会有更大的机会获得成功,才能充分实现人生的价值。 参考范文(196 words) As is apparently portrayed in the bar chart above, at present university students suffer from psychological problems of various kinds, among which spiritual depression, miscellaneous problems, and suicide-committing top the list. What the chart reveals is indeed thought-provoking.
英语四级图表作文讲解及参考范文
英语四级图表作文讲解及参考范文 图表作文也是四(六)级考试中常见,而且被认为是一种较难的作文形式。图表作文就是把非文字信息(通常为各种图表表示的数字信息等)转换成文字信息的一种作文。它要求我们用文字来描述非文字性的图表或对图表显示的关系作解释说明。 第一节图表作文的出题形式和写作要领 一、图表作文常见出题形式 图表作文一般在题目中给出作文的标题和一个或几个统计表格、圆形图、曲线图或条形图,有时还用英文或中文提纲的形式给出提示,要求我们: 1)用文字描述图表,客观解释图表中所传递的信息,并找出某种规律或趋势; 2)就图表中所反映的某种趋势或问题分析其原因或后果。 图表作文着重说明事实,常常是通过对图表中所反映的具体数据的说明、分析、比较,对某种事物或现象的事实或变化情况等加以说明,并提出结论或看法。因此,图表作文常常采用议论文体的写作方法。 写好图表作文,关键在于能否读懂图表中所提供的信息,把握各信息间的联系,用准确流畅的语言把这一信息表达出来,并就这一信息发表自己的看法。 二、图表作文的写作步骤 写图表作文时,要注意遵循以下步骤: 1)认真分析图表的含义,弄清图表中所含的信息及不同信息间的关系; 2)确定文章的主题思想,构思出文章的基本框架,筛选出能说明图表主题思想的典型数据; 3)编列文章的提纲; 4)根据文章的提纲,将各段的提纲内容扩展成段落,然后将各个段落组成文章,注意段与段之间的衔接与过渡; 5)检查与修改。
三、图表作文的篇章结构 写图表作文时,常采用三段式的陈述方式。文章的第一段往往分析图表中的数据变化反映什么问题或趋势,概述图表所揭示的信息。第二段分析造成这一问题或趋势的原因。第三段则展望未来的情况或提出解决问题的办法或建议。这一结构可以简单地表述为: 第一段:概述图表反映的主题思想(总趋势+极端值+特点,时态) 第二段:分析产生的原因 第三段:展望未来或提出方法或建议 模板一 ①总的趋势②图表具体描述③剖析图表所揭示的含义 ④理由一⑤理由二⑥理由三⑦理由四⑧总结⑨前景预测 As can be seen from the table, the past decade has witnessed dramatic changes in①______. While ②_______. It is obvious from the table that③_________. What contributed to these changes? I think the reasons are as follows. To start with, ④______. Secondly, ⑤______ . What’s more, ⑥ _______. Last but not lease, ⑦________. In conclusion, ⑧_________. Moreover, ⑨ ________. 模板二 ①描述图表②分三方面解释原因③下结论 1) During the period from _______to _______, ________rose from ________to _______, while _______ decreased from _______ to _______. 2) We believe that three reasons can account for this phenomenon. First,____. Second, ____. Third, _____. 3) ___.We are happy to see that things are becoming better and better nowadays. We can imagine that ___. 模板三 ①描述图表②解释图表③补充解释 1) During the period between _______ and ________, ________ declined abruptly from _______ to ________, while ________ increased sharply from ________ to _______. 2) Several reasons can account for this phenomenon. Compared with _________ is much cheaper and more convenient__________ . Apart from that, _________. 3) However, there are still a number of people who _________, generally for two reasons. On the
英语图表作文范例
一、图表作文写作常识 1、图形种类及概述法: 泛指一份数据图表:a data graph/ch art/diagram/illustration/table 饼图:pie chart 直方图或柱形图:bar chart / histo gram 趋势曲线图:line chart / curve di agram 表格图:table 流程图或过程图:flow chart / sequ ence diagram 程序图:processing/procedures dia gram 2、常用的描述用法
The table/chart diagram/graph sho ws (that) According to the table/chart diag ram/graph As (is) shown in the table/char t diagram/graph As can be seen from the table/cha rt/diagram/graph/figures, figures/statistics shows (tha t)…… It can be seen from the figures/s tatistics We can see from the figures/stati stics It is clear from the figures/stat istics It is apparent from the figures/s tatistics
table/chart/diagram/graph figures (that)…… table/chart/diagram/graph shows/d esc ribes/illustrates how…… 3、图表中的数据(Data)具体表达法 数据(Data)在某一个时间段固定不变:fixed in time 在一系列的时间段中转变:changes o ver time 持续变化的data在不同情况下: 增加:increase / raise / rise / g o up …… 减少:decrease / grow down / drop / fall …… 波动:fluctuate / rebound / undul ate / wa ve …… 稳定:remain stable / stabilize / level off ……
英语四六级图表作文范文
5、图表作文:人口快速增长带来的问题 Directions: A. Study the following graphs carefully and write an essay in at least 150 words. B. Your essay should cover these points; 1. effect of the country's growing human population in its wildlife 2. possible reasons for the effect 3. your suggestion for wildlife protection (15 points) 【参考范文】the ups and downs of population growth As is seen from the two graphs, it is clear that with the rapid growth of U.S. population from 1800 to 1990, the number of its wildlife species no longer existing soared during the same period. Naturally, we can draw the conclusion that the sharp decline of wildlife species resulted from the population growth. Two reasons may account for this phenomenon. To begin with, as the population grows, people consume much more natural resources, which often leads to excessive hunting. Second, with the increase of human activities, modern people take up more and more space. Which has a great impact on other species. Finally, the problem of pollution becomes more and more serious with the development of modern industry. More and more animals have to adapt themselves to the decaying environment or move to a totally different place, but not all of them are fortunate enough to survive the changes. Solving this problem calls for, above all, the government’s efforts to control population growth, to decrease industrial pollution and to enhance the laws to forbid wildlife hunting. Moreover, common citizens should be aware of this ecological crisis and take on the responsibility of wildlife protection. In a word, only when the government and the common people make joint e f forts can we hope to find a satisfactory solution to this problem. 6、图表作文:居民日常生活花消表 Study the following table carefully and write an essay of at least 150 words. Your essay must be written on Answer Sheet? Your essay should meet the requirements below. 1. Changes in people' s daily expenses in the past five years 2. Give possible reasons for the changes. 3. Draw my own conclusions [参考范文] In the past five years, there have been great changes in people’s daily expenses in XX city. According to the figures given in the table, the amount of money spent on food decreased gradually, accounting for 35 per cent in 1998. However, there was a rapid increase in clothing expenses, which made up 17% in 1998. In addition, the table shows an upward tendency in recreation expenses. The same was the case with other expenses. What caused these remarkable changes? In my opinion, there are at least three good reasons.