O3 fiscal and monetary policies
货币政策MonetaryPolicy和财政政策(fiscalPolicy)

货币政策MonetaryPolicy和财政政策(fiscalPolicy)货币政策Monetary Policy是指政府或中央银⾏为影响所采取的措施,尤指控制以及调控的各项措施。
⽤以达到特定或维持政策⽬标——⽐如,抑制通胀、实现完全就业或。
直接地或间接地通过和设置银⾏最低(最低)。
货币理论和货币政策是同⼀事物的两⾯,⼀个是从经济理论⾓度讲,⼀个是从政策措施讲。
根据对的影响⽅⾯,可把货币政策分为两类:(积极货币政策)和紧缩性货币政策(稳健货币政策)。
在时,中央银⾏采取措施降低,由此引起增加,刺激投资和,增加总需求,称为。
反之,经济过热、太⾼时,中央银⾏采取⼀系列措施减少,以提⾼、抑制投资和,使减少或放慢增长速度,使物价⽔平控制在合理⽔平,称为紧缩性货币政策主要措施运⽤货币政策所采取的主要措施包括七个⽅⾯:第⼀,控制。
第⼆,控制和调节对政府的贷款。
第三,推⾏。
第四,改变。
第五,调整。
第六,。
第七,。
-------------------------------------------------------------------------------------------------------------------------------------------财政政策(Fiscal policy )学词汇。
财政政策的概述财政政策是指根据⼀定时期政治、经济、的任务⽽规定的财政⼯作的指导原则,通过与政策来调节总需求。
增加,可以刺激总需求,从⽽增加,反之则压抑总需求,减少国民收⼊。
税收对是⼀种收缩性⼒量,因此,增加政府税收,可以抑制从⽽减少国民收⼊,反之,则刺激总需求增加国民收⼊。
财政政策是国家整个的组成部分有两种形式:其⼀是,指的是政府在物品和上的花费——购买军备、修建道路、⽀付公务员的薪⽔等等,其次是政府转移⽀付,例如,政府在社会福利、保险、贫困救济和补助⽅⾯的⽀出,以提⾼某些群体(如⽼⼈或失业者)的收⼊。
最新 翻译技巧:如何翻译“稳健的财政政策和货币政策”-精品
翻译技巧:如何翻译“稳健的财政政策和货币政策”在去年十一月召开的中央会议上,决定今年要实行稳健的和货币政策,这标志着实施已近7年的积极财政政策调整了取向。
对于“稳健的财政政策和货币政策”的英译,许多媒体都是用prudent fiscal and monetary policies来表达的:1. A high-level meeting of the Community Party of China (CPC) held Wednesday set the tone for China's economic policy next year, declaring that China will exercise prudent fiscal and monetary policies in 2005.2. The policy shift from 'proactive to prudent' fiscal and monetary policies was made 'to conform with changes in China's macro-economic situation and consolidate the achievements of macro-control,'3. China's proactive fiscal policy, in place since 1998, has resulted in seven years of world-stunning economic growth. A prudent policy is the logical choice to curb overheating of the economy, maintain steady development and improve the efficiency of the economy.4. China has begun to shift to a prudent financial policy for economic development after having adopted a proactive fiscal policy for securing sustainable growth during the past seven years.5. In line with the prudent policy, the Chinese government will cut budget deficit and public investment, reform expenditure structure and push financial reform while carrying out macro-control measures, he said.但是,prudent(谨慎)有消极保守的意思:Definition of PRUDENT: careful and sensible; marked by sound judgment; "a prudent manager"; "prudent rulers"; "prudent hesitation"; "more prudent to hide than to fight"1. US prudent policy about climate change:(谨慎且消极的态度)The US Administration has come under criticism within many European countries and within the American community of environmentalists for adopting what is considered to be too relaxed a view toward the question of global climate change, more particularly toward the prospect of a substantial warming of the surface of the earth sometime during the next century.。
曼昆经济学原理英文版习题答案35章THE SHORT-RUN TRADE-OFF BETWEEN INFLATION AND UNEMPLOYMENT
WHAT’S NEW IN THE SEVENTH EDITION:The section on ”A Financial Crisis Takes Us for a Ride Along t he Phillips Curve” has been updated.LEARNING OBJECTIVES:By the end of this chapter, students should understand:why policymakers face a short-run trade-off between inflation and unemployment.why the inflation-unemployment trade-off disappears in the long run.how supply shocks can shift the inflation-unemployment trade-off.the short-run cost of reducing inflation.how policymakers’ credibility might affect the cost of reducing inflation.CONTEXT AND PURPOSE:Chapter 22 is the final chapter in a three-chapter sequence on the economy’s short-run fluctuations around its long-term trend. Chapter 20 introduced aggregate supply and aggregate demand. Chapter 21 developed how monetary and fiscal policies affect aggregate demand. Both Chapters 20 and 21 addressed the relationship between the price level and output. Chapter 22 will concentrate on a similar relationship between inflation and unemployment.The purpose of Chapter 22 is to trace the history of economists’ thinking about the relationship between inflation and unemployment. Students will see why there is a temporary trade-off between inflation and unemployment, and why there is no permanent trade-off. This result is an extension of the results produced by the model of aggregate supply and aggregate demand where a change in the price level induced by a change in aggregate demand temporarily alters output but has no permanent impact on output.389390❖Chapter 22/The Short-Run Trade-off between Inflation and UnemploymentKEY POINTS:∙ The Phillips curve describes a negative relationship between inflation and unemployment. By expanding aggregate demand, policymakers can choose a point on the Phillips curve with higher inflation and lower unemployment. By contracting aggregate demand, policymakers can choose apoint on the Phillips curve with lower inflation and higher unemployment.∙ The trade-off between inflation and unemployment described by the Phillips curve holds only in the short run. In the long run, expected inflation adjusts to changes in actual inflation, and the short-run Phillips curve shifts. As a result, the long-run Phillips curve is vertical at the natural rate ofunemployment.∙ The short-run Phillips curve also shifts because of shocks to aggregate supply. An adverse supply shock, such as an increase in world oil prices, gives policymakers a less favorable trade-off between inflation and unemployment. That is, after an adverse supply shock, policymakers have to accept a higher rate of inflation for any given rate of unemployment, or a higher rate of unemployment for any given rate of inflation.∙ When the Fed contracts growth in the money supply to reduce inflation, it moves the economy along the short-run Phillips curve, which results in temporarily high unemployment. The cost of disinflation depends on how quickly expectations of inflation fall. Some economists argue that a crediblecommitment to low inflation can reduce the cost of disinflation by inducing a quick adjustment of expectations.CHAPTER OUTLINE:I. The Phillips CurveA. Origins of the Phillips Curve1. In 1958, economist A. W. Phillips published an article discussing the negative correlationbetween inflation rates and unemployment rates in the United Kingdom.2. American economists Paul Samuelson and Robert Solow showed a similar relationshipbetween inflation and unemployment for the United States two years later.3. The belief was that low unemployment is related to high aggregate demand, and highaggregate demand puts upward pressure on prices. Likewise, high unemployment is relatedto low aggregate demand, and low aggregate demand pulls price levels down.4. Definition of Phillips curve: a curve that shows the short-run trade-off betweeninflation and unemployment.Chapter 22/The Short-Run Trade-off between Inflation and Unemployment❖ 3915. Samuelson and Solow believed that the Phillips curve offered policymakers a menu ofpossible economic outcomes. Policymakers could use monetary and fiscal policy to chooseany point on the curve.B. Aggregate Demand, Aggregate Supply, and the Phillips Curve1. The Phillips curve shows the combinations of inflation and unemployment that arise in theshort run as shifts in the aggregate-demand curve move the economy along the short-runaggregate-supply curve.2. The greater the aggregate demand for goods and services, the greater the economy’s outputand the higher the price level. Greater output means lower unemployment. The higher theprice level in the current year, the higher the rate of inflation.3. Example: The price level is 100 (measured by the Consumer Price Index) in the year 2020.There are two possible changes in the economy for the year 2021: a low level of aggregatedemand or a high level of aggregate demand.a. If the economy experiences a low level of aggregate demand, we would be at a short-run equilibrium like point A. This point also corresponds with point A on the Phillips curve.Note that when aggregate demand is low, the inflation rate is relatively low and theunemployment rate is relatively high.b. If the economy experiences a high level of aggregate demand, we would be at a short-run equilibrium like point B. This point also corresponds with point B on the Phillips curve.Note that when aggregate demand is high, the inflation rate is relatively high and theunemployment rate is relatively low.392❖Chapter 22/The Short-Run Trade-off between Inflation and Unemployment Figure 24. Because monetary and fiscal policies both shift the aggregate-demand curve, these policiescan move the economy along the Phillips curve.a. Increases in the money supply, increases in government spending, or decreases in taxesall increase aggregate demand and move the economy to a point on the Phillips curvewith lower unemployment and higher inflation.b. Decreases in the money supply, decreases in government spending, or increases in taxesall lower aggregate demand and move the economy to a point on the Phillips curve withhigher unemployment and lower inflation.II. Shifts in the Phillips Curve: The Role of ExpectationsA. The Long-Run Phillips Curve1. In 1968, economist Milton Friedman argued that monetary policy is only able to choose acombination of unemployment and inflation for a short period of time. At the same time,economist Edmund Phelps wrote a paper suggesting the same thing.2. In the long run, monetary growth has no real effects. This implies that it cannot affect thefactors that determine the economy’s long-run unemployment rate.Chapter 22/The Short-Run Trade-off between Inflation and Unemployment ❖ 3933. Thus, in the long run, we would not expect there to be a relationship between unemployment and inflation. This must mean that, in the long run, the Phillips curve is vertical.4. The vertical Phillips curve occurs because, in the long run, the aggregate supply curve is vertical as well. Thus, increases in aggregate demand lead only to changes in the price leveland have no effect on the economy’s level of output. Thus, in the long run, unemployment will not change when aggregate demand changes, but inflation will.5. The long-run aggregate-supply curve occurs at the economy’s natural level of output. Thismeans that the long-run Phillips curve occurs at the natural rate of unemployment.394❖Chapter 22/The Short-Run Trade-off between Inflation and UnemploymentB. The Meaning of “Natural”1. Friedman and Phelps considered the natural rate of unemployment to be the rate towardwhich the economy gravitates in the long run.2. The natural rate of unemployment may not be the socially desirable rate of unemployment.3. The natural rate of unemployment may change over time.C. Reconciling Theory and Evidence1. The conclusion of Friedman and Phelps that there is no long-run trade-off between inflationand unemployment was based on theory, while the correlation between inflation andunemployment found by Phillips, Samuelson, and Solow was based on actual evidence.2. Friedman and Phelps believed that an inverse relationship between inflation andunemployment exists in the short run.3. The long-run aggregate-supply curve is vertical, indicating that the price level does notinfluence output in the long run.4. But, the short-run aggregate-supply curve is upward sloping because of misperceptionsabout relative prices, sticky wages, and sticky prices. These perceptions, wages, and pricesadjust over time, so that the positive relationship between the price level and the quantity ofgoods and services supplied occurs only in the short run.5. This same logic applies to the Phillips curve. The trade-off between inflation andunemployment holds only in the short run.6. The expected level of inflation is an important factor in understanding the difference betweenthe long-run and the short-run Phillips curves. Expected inflation measures how much peopleexpect the overall price level to change.7. The expected rate of inflation is one variable that determines the position of the short-runaggregate-supply curve. This is true because the expected price level affects the perceptionsof relative prices that people form and the wages and prices that they set.8. In the short run, expectations are somewhat fixed. Thus, when the Fed increases the moneysupply, aggregate demand increases along the upward sloping short-run aggregate-supplycurve. Output grows (unemployment falls) and the price level rises (inflation increases).9. Eventually, however, people will respond by changing their expectations of the price level.Specifically, they will begin expecting a higher rate of inflation.Chapter 22/The Short-Run Trade-off between Inflation and Unemployment ❖ 395D. The Short-Run Phillips Curve1. We can relate the actual unemployment rate to the natural rate of unemployment, the actual inflation rate, and the expected inflation rate using the following equation:a. Because expected inflation is already given in the short run, higher actual inflation leadsto lower unemployment.b. How much unemployment changes in response to a change in inflation is determined by the variable a, which is related to the slope of the short-run aggregate-supply curve.2. If policymakers want to take advantage of the short-run trade-off between unemployment and inflation, it may lead to negative consequences.a. Suppose the economy is at point A and policymakers wish to lower the unemploymentrate. Expansionary monetary policy or fiscal policy is used to shift aggregate demand tothe right. The economy moves to point B, with a lower unemployment rate and a higherrate of inflation.b. Over time, people get used to this new level of inflation and raise their expectations ofinflation. This leads to an upward shift of the short-run Phillips curve. The economy ends up at point C, with a higher inflation rate than at point A, but the same level ofunemployment.396 ❖ Chapter 22/The Short-Run Trade-off between Inflation and UnemploymentE. The Natural Experiment for the Natural-Rate Hypothesis1. Definition of the natural-rate hypothesis: the claim that unemployment eventually returns to its normal, or natural rate, regardless of the rate of inflation .2. Figure 6 shows the unemployment and inflation rates from 1961 to 1968. It is easy to see the inverse relationship between these two variables.3. Beginning in the late 1960s, the government followed policies that increased aggregate demand.a. Government spending rose because of the Vietnam War.b. The Fed increased the money supply to try to keep interest rates down.4. As a result of these policies, the inflation rate remained fairly high. However, even thoughinflation remained high, unemployment did not remain low.a. Figure 7 shows the unemployment and inflation rates from 1961 to 1973. The simple inverse relationship between these two variables began to disappear around 1970.b. Inflation expectations adjusted to the higher rate of inflation and the unemployment rate returned to its natural rate of around 5% to 6%.III. Shifts in the Phillips Curve: The Role of Supply ShocksA. In 1974, OPEC increased the price of oil sharply. This increased the cost of producing many goods and services and therefore resulted in higher prices.1. Definition of supply shock : an event that directly alters firms’ costs and prices,shifting the economy’s aggregate -supply curve and thus the Phillips curve .2. Graphically, we could represent this supply shock as a shift in the short-run aggregate-supplycurve to the left.3. The decrease in equilibrium output and the increase in the price level left the economy with stagflation.Chapter 22/The Short-Run Trade-off between Inflation and Unemployment ❖ 397B. Given this turn of events, policymakers are left with a less favorable short-run trade-off between unemployment and inflation.1. If they increase aggregate demand to fight unemployment, they will raise inflation further.2. If they lower aggregate demand to fight inflation, they will raise unemployment further. C. This less favorable trade-off between unemployment and inflation can be shown by a shift of theshort-run Phillips curve. The shift may be permanent or temporary, depending on how people adjust their expectations of inflation.D. During the 1970s, the Fed decided to accommodate the supply shock by increasing the supply of money. This increased the level of expected inflation. Figure 9 shows inflation and unemploymentin the United States during the late 1970s and early 1980s.IV. The Cost of Reducing InflationA. The Sacrifice Ratio1. To reduce the inflation rate, the Fed must follow contractionary monetary policy.a. When the Fed slows the rate of growth of the money supply, aggregate demand falls.b. This reduces the level of output in the economy, increasing unemployment.c. The economy moves from point A along the short-run Phillips curve to point B, which hasa lower inflation rate but a higher unemployment rate.Price Unemployment Rate398❖Chapter 22/The Short-Run Trade-off between Inflation and Unemploymentd. Over time, people begin to adjust their inflation expectations downward and the short-run Phillips curve shifts. The economy moves from point B to point C, where inflation islower and the unemployment rate is back to its natural rate.2. Therefore, to reduce inflation, the economy must suffer through a period of highunemployment and low output.3. Definition of sacrifice ratio: the number of percentage points of annual output lostin the process of reducing inflation by one percentage point.4. A typical estimate of the sacrifice ratio is five. This implies that for each percentage pointinflation is decreased, output falls by 5%.B. Rational Expectations and the Possibility of Costless Disinflation1. Definition of rational expectations: the theory according to which people optimallyuse all the information they have, including information about governmentpolicies, when forecasting the future.2. Proponents of rational expectations believe that when government policies change, peoplealter their expectations about inflation.3. Therefore, if the government makes a credible commitment to a policy of low inflation,people would be rational enough to lower their expectations of inflation immediately. Thisimplies that the short-run Phillips curve would shift quickly without any extended period ofhigh unemployment.C. The Volcker Disinflation1. Figure 11 shows the inflation and unemployment rates that occurred while Paul Volckerworked at reducing the level of inflation during the 1980s.2. As inflation fell, unemployment rose. In fact, the United States experienced its deepest recession since the Great Depression.3. Some economists have offered this as proof that the idea of a costless disinflation suggested by rational-expectations theorists is not possible. However, there are two reasons why we might not want to reject the rational-expectations theory so quickly.a. The cost (in terms of lost output) of the Volcker disinflation was not as large as many economists had predicted.b. While Volcker promised that he would fight inflation, many people did not believe him.Few people thought that inflation would fall as quickly as it did; this likely kept the short-run Phillips curve from shifting quickly.D. The Greenspan Era1. Figure 12 shows the inflation and unemployment rate from 1984 to 2005, called the Greenspan era because Alan Greenspan became the chairman of the Federal Reserve in 1987.2. In 1986, OPEC’s agreement with its members b roke down and oil prices fell. The result of this favorable supply shock was a drop in both inflation and unemployment.3. The rest of the 1990s witnessed a period of economic prosperity. Inflation gradually dropped, approaching zero by the end of the decade. Unemployment also reached a low level, leadingmany people to believe that the natural rate of unemployment had fallen.4. The economy ran into problems in 2001 due to the end of the dot-com stock market bubble,the 9-11 terrorist attacks, and corporate accounting scandals that reduced aggregate demand. Unemployment rose as the economy experienced its first recession in a decade.5. But a combination of expansionary monetary and fiscal policies helped end the downturn,and by early 2005, the unemployment rate was close to the estimated natural rate.6. In 2005, President Bush nominated Ben Bernanke as the Fed chairman. E. A Financial Crisis Takes Us for a Ride Along the Phillips Curve1. In his first couple of years as Fed chairman, Bernanke faced some significant economicchallenges.a. One challenge arose from problems in the housing and financial markets.b. The resulting financial crisis led to a large drop in aggregate demand and high rates of unemployment.c. Figure 13 shows the implications of these events for inflation and unemployment.d. From 2007 to 2009, as the decline in aggregate demand raised unemployment, it alsoreduced the inflation rate from about 3 percent to about 1 percent.e. From 2010 to 2012, unemployment fell and the inflation rate rose from about 1 percentto about 2 percent.f. In essence, the economy first rode down the Phillips curve and then rode back up.g. Note that expected inflation and the position of the short-run Phillips curve wererelatively stable during this period.SOLUTIONS TO TEXT PROBLEMS:Quick Quizzes1. The Phillips curve is shown in Figure 1.Figure 1To see how policy can move the economy from a point with high inflation to a point with lowinflation, suppose the economy begins at point A in Figure 2. If policy is used to reduceaggregate demand (such as a decrease in the money supply or a decrease in governmentpurchases), the aggregate-demand curve shifts from AD1 to AD2, and the economy movesfrom point A to point B with lower inflation, a reduction in real GDP, and an increase in theunemployment rate.Figure 22. Figure 3 shows the short-run Phillips curve and the long-run Phillips curve. The curves aredifferent because in the long run, monetary policy has no effect on unemployment, which tends toward its natural rate. However, in the short run, monetary policy can affect the unemployment rate. An increase in the growth rate of money raises actual inflation above expected inflation, causing firms to produce more since the short-run aggregate supply curve is positively sloped, which reduces unemployment temporarily.Figure 33. Examples of favorable shocks to aggregate supply include improved productivity and adecline in oil prices. Either shock shifts the aggregate-supply curve to the right, increasing output and reducing the price level, moving the economy from point A to point B in Figure 4.As a result, the Phillips curve shifts to the left, as the figure shows.Figure 44. The sacrifice ratio is the number of percentage points of annual output lost in the process ofreducing inflation by 1 percentage point. The credibility of the Fed’s commitment to reduceinflation might affect the sacrifice ratio because it affects the speed at which expectations ofinflati on adjust. If the Fed’s commitment to reduce inflation is credible, people will reducetheir expectations of inflation quickly, the short-run Phillips curve will shift downward, andthe cost of reducing inflation will be low in terms of lost output. But if the Fed is not credible,people will not reduce their expectations of inflation quickly, and the cost of reducinginflation will be high in terms of lost output.Questions for ReviewFigure 51. Figure 5 shows the short-run trade-off between inflation and unemployment. The Fed canmove the economy from one point on this curve to another by changing the money supply.An increase in the money supply reduces the unemployment rate and increases the inflation rate, while a decrease in the money supply increases the unemployment rate and decreases the inflation rate.Figure 62. Figure 6 shows the long-run trade-off between inflation and unemployment. In the long run,there is no trade-off, as the economy must return to the natural rate of unemployment on the long-run Phillips curve. In the short run, the economy can move along a short-run Phillips curve, like SRPC1 shown in the figure. But over time (as inflation expectations adjust) the short-run Phillips curve will shift to return the economy to the long-run Phillips curve, for example shifting from SRPC1 to SRPC2.3. The natural rate of unemployment is natural because it is beyond the influence of monetarypolicy. The rate of unemployment will move to its natural rate in the long run, regardless of the inflation rate.The natural rate of unemployment might differ across countries because countries havevarying degrees of union power, minimum-wage laws, collective-bargaining laws,unemployment insurance, job-training programs, and other factors that influence labor-market conditions.4. If a drought destroys farm crops and drives up the price of food, the short-run aggregate-supply curve shifts to the left and the short-run Phillips curve shifts to the right, because the costs of production have increased. The higher short-run Phillips curve means the inflation rate will be higher for any given unemployment rate.5. When the Fed decides to reduce inflation, the economy moves down along the short-runPhillips curve, as shown in Figure 7. Beginning at point A on short-run Phillips curve SRPC1, the economy moves down to point B as inflation declines. Once people's expectations adjust to the lower rate of inflation, the short-run Phillips curve shifts to SRPC2, and the economy moves to point C. The short-run costs of disinflation, which arise because the unemployment rate is temporarily above its natural rate, could be reduced if the Fed's action was credible, so that expectations would adjust more rapidly.Figure 7Quick Check Multiple Choice1. b2. d3. c4. a5. b6. dProblems and Applications1. Figure 8 shows two different short-run Phillips curves depicting these four points. Points aand d are on SRPC1 because both have expected inflation of 3%. Points b and c are onSRPC2 because both have expected inflation of 5%.Figure 82. a. A rise in the natural rate of unemployment shifts both the long-run Phillips curve and theshort-run Phillips curve to the right, as shown in Figure 9. The economy is initially onLRPC1 and SRPC1 at an inflation rate of 3%, which is also the expected rate of inflation.The increase in the natural rate of unemployment shifts the long-run Phillips curve toLRPC2 and the short-run Phillips curve to SRPC2, with the expected rate of inflationremaining equal to 3%.Figure 9b. A decline in the price of imported oil shifts the short-run Phillips curve to the left, asshown in Figure 10, from SRPC1 to SRPC2. For any given unemployment rate, theinflation rate is lower, because oil is such a significant aspect of production costs in the economy.Figure 10c. A rise in government spending represents an increase in aggregate demand, so it movesthe economy along the short-run Phillips curve, as shown in Figure 11. The economy moves from point A to point B, with a decline in the unemployment rate and an increase in the inflation rate.Figure 11d. A decline in expected inflation causes the short-run Phillips curve to shift to the left, asshown in Figure 12. The lower rate of expected inflation shifts the short-run Phillips curve from SRPC1 to SRPC2.Figure 12Figure 133. a. Figure 13 shows how a reduction in consumer spending causes a recession in both anaggregate-supply/aggregate-demand diagram and a Phillips-curve diagram. In bothdiagrams, the economy begins at full employment at point A. The decline in consumerspending reduces aggregate demand, shifting the aggregate-demand curve to the leftfrom AD1 to AD2. The economy initially remains on the short-run aggregate-supply curve AS1, so the new equilibrium occurs at point B. The movement of the aggregate-demand curve along the short-run aggregate-supply curve leads to a movement along short-run Phillips curve SRPC1, from point A to point B. The lower price level in the aggregate-supply/aggregate-demand diagram corresponds to the lower inflation rate in the Phillips-curve diagram. The lower level of output in the aggregate-supply/aggregate-demanddiagram corresponds to the higher unemployment rate in the Phillips-curve diagram.b. As expected inflation falls over time, the short-run aggregate-supply curve shifts to theright from AS1 to AS2, and the short-run Phillips curve shifts to the left from SRPC1 toSRPC2. In both diagrams, the economy eventually gets to point C, which is back on thelong-run aggregate-supply curve and long-run Phillips curve. After the recession is over, the economy faces a better set of inflation-unemployment combinations.Figure 144. a. Figure 14 shows the economy in long-run equilibrium at point a, which is on both thelong-run and short-run Phillips curves.b. A wave of business pessimism reduces aggregate demand, moving the economy to pointb in the figure. The unemployment rate increases and the inflation rate declines. If theFed undertakes expansionary monetary policy, it can increase aggregate demand,offsetting the pessimism and returning the economy to point a, with the initial inflationrate and unemployment rate.c. Figure 15 shows the effects on the economy if the price of imported oil rises. The higherprice of imported oil shifts the short-run Phillips curve to the right from SRPC1 to SRPC2.The economy moves from point a to point c, with a higher inflation rate and higherunemployment rate. If the Fed engages in expansionary monetary policy, it can returnthe economy to its original unemployment rate at point d, but the inflation rate will behigher. If the Fed engages in contractionary monetary policy, it can return the economy to its original inflation rate at point e, but the unemployment rate will be higher. Thissituation differs from that in part (b) because in part (b) the economy stayed on thesame short-run Phillips curve, but in part (c) the economy moved to a higher short-runPhillips curve, which gives policymakers a less favorable trade-off between inflation and unemployment.。
China’s monetarypolicy and fiscal policy中国的货币政策和财政政策
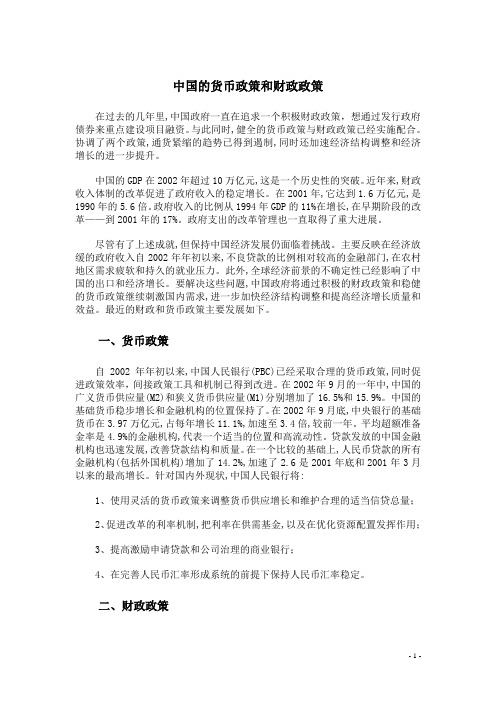
中国的货币政策和财政政策在过去的几年里,中国政府一直在追求一个积极财政政策,想通过发行政府债券来重点建设项目融资。
与此同时,健全的货币政策与财政政策已经实施配合。
协调了两个政策,通货紧缩的趋势已得到遏制,同时还加速经济结构调整和经济增长的进一步提升。
中国的GDP在2002年超过10万亿元,这是一个历史性的突破。
近年来,财政收入体制的改革促进了政府收入的稳定增长。
在2001年,它达到1.6万亿元,是1990年的5.6倍。
政府收入的比例从1994年GDP的11%在增长,在早期阶段的改革——到2001年的17%。
政府支出的改革管理也一直取得了重大进展。
尽管有了上述成就,但保持中国经济发展仍面临着挑战。
主要反映在经济放缓的政府收入自2002年年初以来,不良贷款的比例相对较高的金融部门,在农村地区需求疲软和持久的就业压力。
此外,全球经济前景的不确定性已经影响了中国的出口和经济增长。
要解决这些问题,中国政府将通过积极的财政政策和稳健的货币政策继续刺激国内需求,进一步加快经济结构调整和提高经济增长质量和效益。
最近的财政和货币政策主要发展如下。
一、货币政策自2002年年初以来,中国人民银行(PBC)已经采取合理的货币政策,同时促进政策效率,间接政策工具和机制已得到改进。
在2002年9月的一年中,中国的广义货币供应量(M2)和狭义货币供应量(M1)分别增加了16.5%和15.9%。
中国的基础货币稳步增长和金融机构的位置保持了。
在2002年9月底,中央银行的基础货币在3.97万亿元,占每年增长11.1%,加速至3.4倍,较前一年。
平均超额准备金率是4.9%的金融机构,代表一个适当的位置和高流动性。
贷款发放的中国金融机构也迅速发展,改善贷款结构和质量。
在一个比较的基础上,人民币贷款的所有金融机构(包括外国机构)增加了14.2%,加速了2.6是2001年底和2001年3月以来的最高增长。
针对国内外现状,中国人民银行将:1、使用灵活的货币政策来调整货币供应增长和维护合理的适当信贷总量;2、促进改革的利率机制,把利率在供需基金,以及在优化资源配置发挥作用;3、提高激励申请贷款和公司治理的商业银行;4、在完善人民币汇率形成系统的前提下保持人民币汇率稳定。
高三政治经济英语阅读理解20题

高三政治经济英语阅读理解20题1<背景文章>The market economy is an economic system in which decisions regarding production, distribution, and consumption are guided by the interactions of supply and demand. One of the key characteristics of a market economy is the freedom of individuals and businesses to make economic decisions. In a market economy, producers are free to produce goods and services that they believe will be profitable, and consumers are free to choose which goods and services to purchase.Another important characteristic of a market economy is competition. Competition among producers leads to lower prices, better quality products, and more innovation. Consumers benefit from competition as they have more choices and can get better value for their money.However, a market economy also has its challenges. One of the main challenges is inequality. In a market economy, those who are more talented, educated, or have more resources are likely to earn more and accumulate more wealth. This can lead to a wide gap between the rich and the poor.Another challenge is market failures. Market failures occur when the market does not allocate resources efficiently. For example, externalities such as pollution can cause market failures as the costs of pollution are notreflected in the price of goods and services.1. What is one of the key characteristics of a market economy?A. Government control of production.B. Lack of freedom for businesses.C. Freedom of individuals and businesses to make economic decisions.D. Equal distribution of wealth.答案:C。
国际经济学第九版英文课后答案 第19单元

CHAPTER 19PRICES AND OUTPUT IN AN OPEN ECONOMY:AGGREGATE DEMAND AND AGGREGATE SUPPLY OUTLINE19.1 Introduction19.2 Aggregate Demand, Aggregate Supply, and Equilibrium in a Closed Economy19.2a Aggregate Demand in a Closed Economy19.2b Aggregate Supply in the Long Run and in the Short Run19.2c Short-Run and Long-Run Equilibrium in a Closed EconomyCase Study 19-1: Deviations of Short-Run Outputs from the Natural Level in the U.S.19.3 Aggregate Demand in an Open Economy Under Fixed and Flexible Exchange Rates19.3a Aggregate Demand in an Open Economy Under Fixed Exchange Rates19.3b Aggregate demand in an Open Economy Under Flexible Exchange Rates19.4 Effect of Economic Shocks and Macroeconomic Policies on Aggregate Demandin Open Economies with Flexible Prices19.4a Real-Sector Shocks and Aggregate Demand19.4b Monetary Shocks and Aggregate Demand19.4c Fiscal and Monetary Policies and Aggregate Demand in Open Economies19.5 Effect of Fiscal and Monetary Policies in Open Economies with Flexible PricesCase Study 19.2: Central Bank Independence and Inflation in Industrial Countries19.6 Macroeconomic Policies to Stimulate Growth and to Adjust to Supply Shocks19.6a Economic Policies for Growth19.6b Economic Policies to Adjust to Supply ShocksCase Study 19.3: Petroleum Shocks and Stagflation in the United StatesCase Study 19.4: Actual and Natural Unemployment Rate, and Inflation in United StatesCase Study 19.5: Actual and Natural Unemployment Rate, and Inflation in United StatesCase Study 19.6: Has the U.S. Economy Become Recession Proof? Key TermsAggregate demand curve (AD)Aggregate supply curve (AS)Long-run aggregate supply curve (LRAS)Natural level of output (YN)Short-run aggregate supply curve (SRAS)Expected pricesStagflationLecture Guide1. This is not a core chapter and I would omit it in a one-semester undergraduate course in international economics.2. If I were to cover this chapter, I would cover two sections in each of three lectures and assign the end-of-chapter problems.Answer to Problems1. See Figure 1.2. See Figure 2.3. See Figure 3.4. See Figure 4.5. An unexpected increase in prices in the face of sticky wages means that real wages temporarily fall. This leads firms to hire more workers and thus increase output in the short run. In the long-run, however, money wages fully adjust to (i.e., increase in the same proportion as) the increasein prices. As a result, real wages return to their previous higher level, firms reduce employment to their original lower level, and the nation's output returns to its lower long-runnatural level, but at the new higher price level.6. Starting from point C in Figure 19-3, an unexpected decrease in aggregate demand from AD' to AD causes prices to fall and firms to temporarily reduce their output, giving the new short-run equilibrium point where the AD' curve intersects the SRAS' curve. In the long run, however, as expected prices fall to match actual prices, the short-run aggregate supply curve shifts down by the amount of the price reduction (i.e., from SRAS' to SRAS) and defines new long- run equilibrium point E at the natural level of output YN, but lower price level of PE.Another way of saying this is that at point to the left of the LRAS curve, actual prices are lower than expected prices. Expected prices then fall and this shifts the SRAS curve downward until expected prices are equal to the lower actual prices, and the economy returns to its long-run natural level of output equilibrium.7. An unexpected decrease in aggregate demand causes prices to fall. If wages are sticky and do not immediately fall in the same proportion as the fall in prices, real wages will temporarily increase. This leads firms to hire fewer workers and thus reduce output in the short run. In the long-run, however, money wages fully adjust to (i.e., fall in the same proportion as) the fall in prices. As a result, real wages return to their previous lower level, firms increase employment to their original higher level, and the nation's output returns to its higher long-run or naturallevel, but at the new higher lower level.8. If the LM' curve intersected the IS' curve at a point below the BP' curve in the left panel of Figure 19-5, the interest rate in the nation would be lower than required for balance of payments equilibrium. The nation would then have a deficit in its balance of payments. Under a fixed exchange rate system, the deficit in the nation's balance of payments would result in an outflow of international reserves and thus a reduction in the nation's money supply, which would shift up the LM' curve sufficiently to intersect the IS' curve on the BP' curve, so that the nationwould be simultaneously in equilibrium in the goods and money markets and in the balance of payments, as at point E".9. See Figure 5.10. Starting from equilibrium in the goods and services sector, in the monetary sector, and in the balance of payments, an autonomous worsening of the nation's trade balance at unchanged domestic prices, causes the IS and BP curves to shift to the left and opens a deficit in the nation's balance of payments under fixed exchange rates. This leads to a leftward shift of the LM curve and a reduction in national income. Thus, the nation's aggregate demand curve shifts to the left.11. With flexible exchange rates, the autonomous worsening of the nation's trade balance at unchanged domestic prices, causes the IS and BP curves to shift to the left (just as in the case of fixed rates). Now, however, the tendency of the nation's balance of payments to go into deficit leads to a depreciation of the nation's currency and a deterioration in the nation's trade balance, so that the BP and IS curves shift to the left, back to their original position along the unchanged LM curve. Thus, the nation returns to the original equilibrium position and point on its original aggregate demand curve.12. Expansionary fiscal policy under fixed exchange rates or easy monetary policy under flexible rates can correct a recession but only the expense of higher prices or inflation. If prices are flexible downward in the nation, however, the recession can be corrected automatically and in a relatively short time by falling domestic prices, which would stimulate the domestic and foreign demand for the nation's goods and services. If domestic prices are sticky or not too flexible downward, however, relying on market force (i.e., falling prices in the nation) to automatically correct the recession may take too long, and this may justify the use of expansionary fiscal or monetary policies.13. The nation would reach the long-run equilibrium point where the AD' curve crosses the unchanged LRAS curve. The SRAS curve would also shift and cross the LRAS curve at the same point. The nation's natural level of output and employment would then be the same as before the supply (petroleum) shock, but prices would be higher.14. The concept of the natural rate of unemployment is useful as long as no structural changes take place in the economy. When structural changes do occur (and globalization may just be such a structural change), then the rate of natural unemployment will change. With globalization the natural rate of unemployment may well be 5 percent or lower in the United States today.Multiple-Choice Questions1. In general, as the economy expends or contracts over the business cycle *a. prices changeb. prices remain unchanged except in a recessionc. prices remain unchanged until the economy reaches full employmentd. all of the above2. The aggregate demand curve (AD) for closed economy is derived from thea. IS curveb. LM curvec. FE curve*d. IS and LM curves3. A reduction in the general price level with a constant money supply is shown by aa. leftward shift in the LM curve*b. movement down along a given aggregate demand curvec. rightward shift in the aggregate supply curved. a rightward shift in the IS curve4. An increase in the money supply with constant prices leads to aa. leftward shift in the LM curveb. movement along a given aggregate demand curve*c. rightward shift in the aggregate demand curved. rightward shift in the IS curve5. An increase in government expenditures leads toa. a rightward shift in the IS curveb. a rightward shift in the AD curvec. an increase in the level of national income*d. all of the above6. A nation's output in the short-run cana. exceed its natural levelb. fall short of its natural levelc. equal to its natural level*d. any of the above7. Which of the following statements is false?a. a nations' natural level of output can increase as a result of growthb. imperfection in product markets can lead to temporary deviations in a nation's output from its long-run natural level*c. sticky wages cannot lead to temporary deviations in a nation's outputfrom its long-run natural leveld. none of the above.8. Output in the short run exceeds the natural level of output if expected prices*a. exceed actual pricesb. are lower than actual pricesc. are equal to actual pricesd. any of the above9. The aggregate demand curve (AD) for an open economy is derived from thea. IS curveb. LM curvec. BP curve*d. all of the above10. The aggregate demand curve for an open economy under fixed exchange rates isa. less elastic than if the economy were closed*b. more elastic than in the economy were closedc. more elastic than in the economy operated with flexible exchange ratesd. all of the above11. An autonomous improvement in the nation's trade balance under fixed exchange rates will cause the nation's aggregate demand curve to*a. shift to the rightb. shift to the leftc. remain unchangedd. any of the above12. An autonomous short-term capital outflow under flexible exchange rates causes the nation's aggregate demand curve to*a. shift to the rightb. shift to the leftc. remain unchangedd. any of the above13. With high short-term international capital flows, fixed exchange rates, and flexible pricesa. monetary policy is effective*b. fiscal policy is effectivec. both fiscal and monetary policies are effectived. neither fiscal policy nor monetary policies are effective14. Which of the following statements is false?a. expansionary fiscal or monetary policy can increase the nation's outputtemporarily above its natural levelb. expansionary fiscal or monetary policy can used to correct a recession but only at the expense of higher prices in the nation*c. a recession cannot be eliminated automatically even if domestic prices are flexible downwardd. when prices are not flexible downward inflation may be less costly that recession15. Which of the following statements is false with regard to the effect of macroeconomic policies?a. they generally cause shifts in the aggregate demand curveb. they can possibly increase long-run growthc. they can help correct supply shocks that increases production costs but only at the expense of even higher inflation*d. they always cause shifts in the long-run aggregate supply curve。
货币与财政政策之间的差异
完
谢谢
一般来说,由政府的立法和 行政部门来控制财政政策, 而中央银行(如中国人民银 行等)负责货币政策。
二、财政政策与货币政策的功能和执行手段不同
Fiscal policy includes the government's range of taxation and expenditure options by which it can affect the course of a nation's economy. Governments may, for example, attempt to stimulate a sluggish economy through a combination of fiscal policy tools such as tax cuts and spending increases.
货币政策是指政府管理全国 的货币供应的一系列政策工 具 。货币政策工具包括购买 和出售政府债券(称为公开 市场业务),改变存款准备 金比例及贷款利率以收紧银 根。所有的货币政策工具都 可以扩大或收缩货币供应。 所有的货币政策工具,目标 都是努的影响效果不同
The Differences Between Fiscal Policy & Monetary Policy
财政政策与货币政策之间的差异
Governments try to manage their nations' economies through their control of fiscal and monetary policy. Fiscal policy relates to government taxation and spending, while monetary policy affects a nation's money supply and interest rates. Fiscal and monetary policies both have short- and long-term effects.
经济学专业英语教程(精编版)(第二版)课件:Fiscal and Monetary Policy
3.1 Definition of fiscal policy 3.2 Composition of fiscal policy 3.3 Fiscal policy as a stabilization tool: Three qualifications 3.4 Reasons for fiscal policy as a stabilizing force
Transfer payments are payments made by the government to the public, for which no current goods or services are received. Examples of transfer payments are unemployment insurance benefits, Social Security benefits, and income support payments to farmers.
Changes in the level of taxes or transfers can be used to affect planned aggregate expenditure and thus eliminate output gaps.
3.3.1 Fiscal policy and the supply side 3.3.2 The problem of deficits 3.3.3 The relative inflexibility of fiscal policy
经济英语作文模板
经济英语作文模板Introduction:In the realm of global affairs, economics plays a pivotal role, shaping the destinies of nations and the lives of individuals. The following essay will delve into theintricate dynamics of the economic landscape, exploring key concepts such as economic growth, inflation, and unemployment, and their implications on society.Paragraph 1: Economic GrowthEconomic growth is often measured by the increase in acountry's Gross Domestic Product (GDP). It is a fundamental indicator of a nation's prosperity and is driven by factors such as technological advancements, investment in infrastructure, and a skilled workforce. The essay will examine the strategies employed by governments to foster economic growth and the challenges they face in achieving sustainable development.Paragraph 2: InflationInflation, the rate at which the general level of prices for goods and services is rising, and subsequently, purchasing power is falling, is a critical economic concern. Thissection will elucidate the causes of inflation, its impact on consumers and businesses, and the measures that central banks take to control it through monetary policy.Paragraph 3: UnemploymentUnemployment, defined as the percentage of the workforce that is willing and able to work but cannot find employment, is a significant economic issue. The essay will discuss the various types of unemployment, the social and economic consequences of high unemployment rates, and the policiesthat governments can implement to reduce joblessness.Paragraph 4: International TradeInternational trade, the exchange of goods and services across international borders, is a cornerstone of modern economies. This part of the essay will explore the benefits and drawbacks of globalization, the role of trade agreements, and the challenges posed by trade imbalances andprotectionist policies.Paragraph 5: Fiscal and Monetary PolicyFiscal and monetary policy are the primary tools used by governments and central banks to influence economic activity. The essay will analyze how fiscal policy, which involves government spending and taxation, and monetary policy, which involves controlling the money supply and interest rates, can be used to stabilize the economy.Conclusion:In conclusion, the essay has provided an overview of the key components that make up the economic landscape. It has underscored the importance of understanding economic principles to navigate the complexities of the global market and the necessity for informed decision-making by policymakers to ensure economic stability and growth.This template can be used as a starting point for students to write an essay on economic topics, providing a structured approach to discussing various economic issues and their implications.。
高三英语经济学原理与案例分析阅读理解20题
高三英语经济学原理与案例分析阅读理解20题1<背景文章>Supply and demand is one of the fundamental principles of economics. It governs the way markets work and influences the prices of goods and services. The law of supply and demand states that when the supply of a product increases, other things being equal, the price of the product will tend to fall. Conversely, when the demand for a product increases, the price will tend to rise.In our daily lives, we can see the effects of supply and demand everywhere. For example, when a new smartphone is released, there is often a high demand for it. As a result, the price may be relatively high. However, as more and more of these smartphones are produced and supplied to the market, the price may start to come down.Another example is the housing market. When there is a high demand for housing in a particular area and a limited supply, the prices of houses will go up. On the other hand, if there is an oversupply of houses and not enough demand, the prices will drop.The relationship between supply and demand is not always straightforward. There are many factors that can influence both supply and demand. For instance, changes in consumer preferences, technologicaladvancements, and government policies can all have an impact on the supply and demand for a particular product or service.1. According to the passage, when the supply of a product increases, what will happen to the price?A. The price will definitely go up.B. The price will remain the same.C. The price will tend to fall.D. The price will fluctuate randomly.答案:C。
- 1、下载文档前请自行甄别文档内容的完整性,平台不提供额外的编辑、内容补充、找答案等附加服务。
- 2、"仅部分预览"的文档,不可在线预览部分如存在完整性等问题,可反馈申请退款(可完整预览的文档不适用该条件!)。
- 3、如文档侵犯您的权益,请联系客服反馈,我们会尽快为您处理(人工客服工作时间:9:00-18:30)。
National insurance 16%
GOVERNMENT SPENDING BY FUNCTION
Other health and personal social services 4% NHS 15%
Social security 27%
Other expenditure 12%
Housing & environment 5% Law & order 6% Defence Industry, agriculture & 6% employment Debt interest 5% 4%
Problems of Government Spending
A rise in govt spending on social services could lead to a fall in private consumer spending. A rise in govt spending on research and development or training may make firms feel less need to invest in these areas themselves.
Question
For the following areas of government expenditure construct a list of what you consider to be possible good and bad points for each area. -- Social Security --Defence --Health Services --Education
Effects of government spending
Redistribute income and wealth so that solve the poverty problem for low income people. Regulate economic activity through regulation, such as taxation, etc. Influence macroeconomic activity by using a multiplier effect, such as savings, consumption and the balance of payment. Provision of public goods and services.
Байду номын сангаас
The Budget Deficit
A government’s budget deficit is the difference between what it spends (G) and what it collects in taxes (T) in a given period:
Budget deficit ≡ G − T
What is Fiscal Policy?
Fiscal policy is the deliberate manipulation of government purchases, transfer payments, taxes, and borrowing in order to influence macroeconomic variables such as employment, the price level, and the level of GDP
Government in the Economy
Discretionary fiscal policy refers to deliberate changes in taxes or spending. The government can not control certain aspects of the economy related to fiscal policy. For example:
Impact of Fiscal Policy
Balanced budget is the situation where a government’s expenditure and revenues are equal A budget surplus is when a government’s revenues exceed expenditures A budget deficit is when a government’s expenditure exceeds revenues Size of a government’s surplus or deficit in relation to the economy’s overall GDP gives clues to what type of discretionary fiscal policy in operation, as well as the automatic stabilizers
The Spending Multiplier
• The impact policies have on the economy is like a ripple effect • Assuming that price is constant, multiplier effect is the magnified impact of a spending change on aggregate demand • Marginal Propensity to Consume answers the question: “If income increases this amount, how much extra will be spent on domestic goods and services?” •MPC = change in consumption on domestic items change in income Marginal Propensity to Withdraw is the effect on withdrawals of a change in income MPW = change in total withdraws change in income
Transport 3% Education 13%
Government Spending
Social Security Law and Order Emergency Services Health Education Defence Foreign Aid Environment Agriculture Industry Transport Regions Culture, Media and Sport
Fiscal policy is the manipulation of government spending and taxation to control aggregate demand. Monetary policy refers to the behavior of the Federal Reserve regarding the nation’s money supply.
• If G exceeds T, the government must borrow from the public to finance the deficit. It does so by selling Treasury bonds and bills. In this case, a part of household saving (S) goes to the government.
The government can control tax rates but not tax revenue. Tax revenue depends on household income and the size of corporate profits. Government spending depends on government decisions and the state of the economy.
The Balanced-Budget Multiplier
The balanced-budget multiplier is the ratio of change in the equilibrium level of output to a change in government spending where the change in government spending is balanced by a change in taxes so as not to create any deficit.
Outcome 3
Fiscal Policy and Monetary Policy
Government in the Economy
Nothing arouses as much controversy as the role of government in the economy. Government can affect the macroeconomy in two ways:
Structure of Public Revenue in the UK
GOVERNMENT RECEIPTS
Business rates 5% Other 13% Council tax 4%
VAT 16%
Corporation tax 8% Excise duties 9%
Income tax 29%
Instruments of Fiscal Policy
Taxes Direct (income, wealth) Indirect (VAT, Excise, Tariff and duties) Subsidies (consumption and production) Government Spending Pure Public goods ( defence, law and order, roads) Semi-public goods (education, health, sanitation) Debt Borrowing from the private sector