国际经济学Chapter 3

- 1、下载文档前请自行甄别文档内容的完整性,平台不提供额外的编辑、内容补充、找答案等附加服务。
- 2、"仅部分预览"的文档,不可在线预览部分如存在完整性等问题,可反馈申请退款(可完整预览的文档不适用该条件!)。
- 3、如文档侵犯您的权益,请联系客服反馈,我们会尽快为您处理(人工客服工作时间:9:00-18:30)。
CHAPTER 3
Specific Factors and Income Distribution
* The failures of the Ricardian model
·A n extreme degree of specialization.
·W ithout effects on the income distribution.
( because it supposes labor is the only factor )
* There are two main reasons why international trade has strong effects on the distribution of income.
·S hort-term: specific factor, chapter3.
·L ong-term: relative abundance and relative intensity, chapter4.
(resource endowment theory or factor proportions theory ). * What is a specific factor?
Specific factor: --- can be used only in the particular sector. Mobile factor: --- can move between sectors.
·Think of factor specificity as a matter of time.
·Labor is less specific than most kinds of capital.
§1. The Specific Factors Model
1.Assumptions of the model : 2×3×
2.
·America and Japan;
·Labor (L)、Capital (K)、Terrain (T) ;
mobile factor specific factor
Q M=Q M(K,L M)、Q F=Q F(T,L F)、L=L M+L F
·Manufacture and Food.
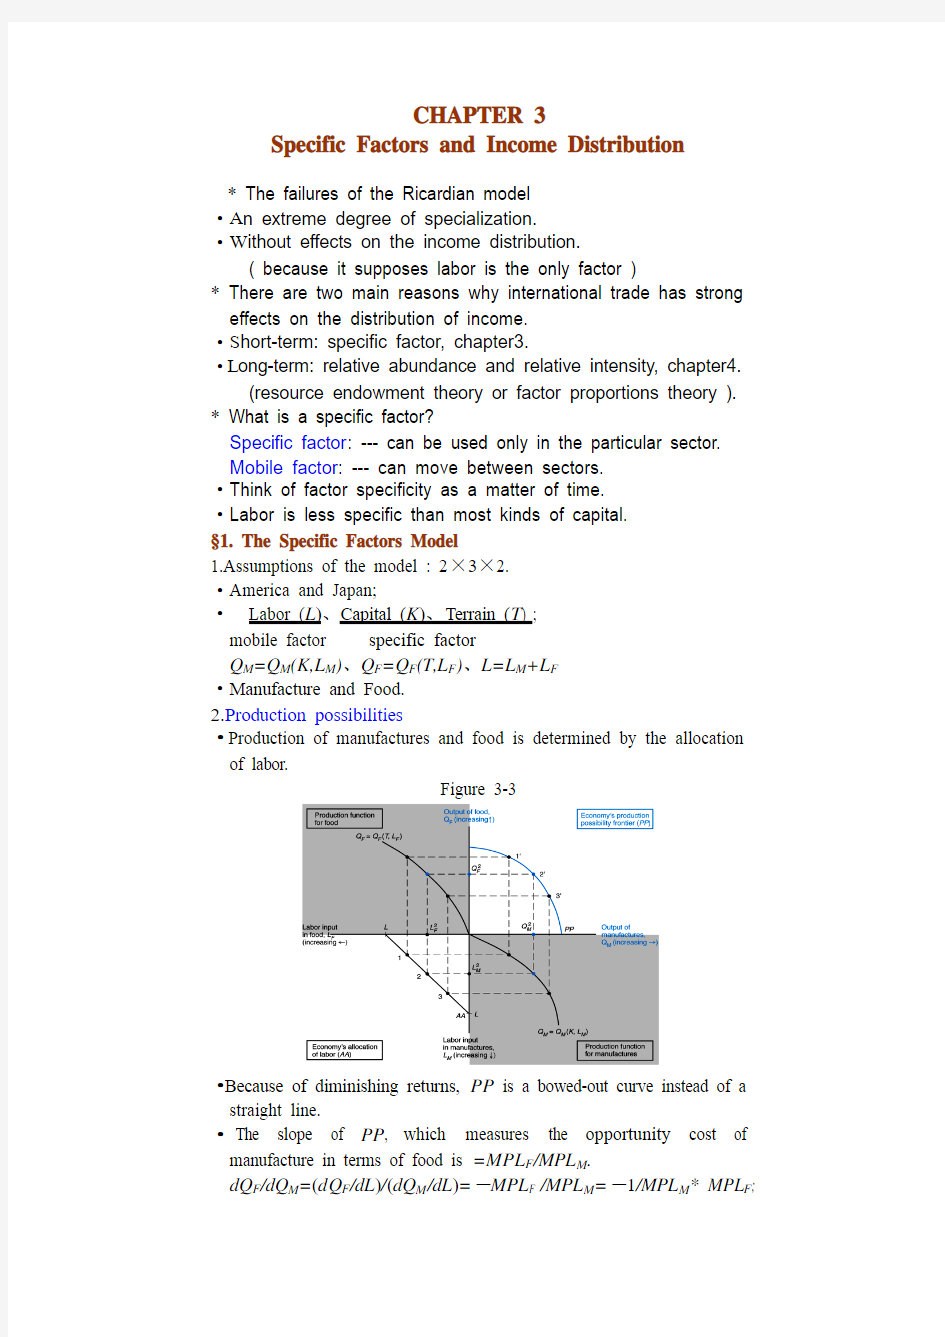
2.Production possibilities
·Production of manufactures and food is determined by the allocation of labor.
Figure 3-3
·Because of diminishing returns, PP is a bowed-out curve instead of a straight line.
·The slope of PP, which measures the opportunity cost of manufacture in terms of food is =MPL F/MPL M.
dQ F/dQ M=(dQ F/dL)/(dQ M/dL)=-MPL F /MPL M=-1/MPL M* MPL F;
(MPL F↑/ MPL M↓)↑
3.Prices, wages, and labor allocation
·The demand for labor: MPL M*P M=W M , MPL F*P F=W F ·The allocation of labor: W M=W F , L=L M+L F
Figure3—4
、P F L M、L F Q M、Q F
P
·The production of specific factor model
MPL M*P M=MPL F*P F MPL F/MPL M=P M/P F
(opportunity cost=relative price)
Figure 3-5
4.The distribution of income within the manufacturing sector
Figure 3-2
total income: Q M=∫L
MPL M*dL M
wages: (W/P M)*L M
income of capitalists: ∫L MPL M*dL M (W/P M)*L M
·What happens to the allocation of labor and the distribution of income when P M and P F change? ( Figure3-6. 3-7. 3-8 )
①Notice that any price change can be broken into two parts : an equal proportional change in P M and P F , and a change in only one price.
Eg: P M↑M↑10% + P M↑7%
P F↑P F↑10%
② A equal proportional change in price have no real effects on the real wage, real income of capital owner and land owner.
Figure 3-6
③ A change in relative price
Figure 3-7
·Wage rate rise less than the increase in P M.
·Labor shifts from the food sector to the manufacturing sector and
Q M rises while Q F falls.
Figure 3-8 P M/P F↑
