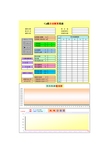
cpk表格模板
CPK模板

CPK模板品名尺寸编号规格上值 1.5规格标准 1.200规格下值0.9公差0.6样本总数211.348 1.248 1.29 1.296 1.464 1.825 1.473 1.3 1.131 1.3931.274 1.228 1.199 1.08 1.422 1.212 1.214 1.41 1.225 1.3221.275正态线0 1.5E-20002.60000最大值1.825分布中心1.453平均数1.316最小值1.080极差0.745偏离度0.3855556样本方差0.1553944UCL 1.782SL 1.316LSL 0.849-0.8-0.30.20.7 1.2 1.7 2.2 2.7 3.23Cpk 0.3954095Cp 0.6435236总不良率12.150%PPM 121503直通率87.850%000032021212121评价建议6组组距7组组距8组组距9组组距10组组距实际分组实际组距0.1240.1060.0930.0830.0750.5000组中值-0.800-0.3000.2000.700 1.200 1.700 2.200 2.700 3.200频数0003171000直方图作相应对照分析;EPT信息框1。
本项统计只适用于单次抽样后的CPK 计算与分析;2。
正态曲线图是以"标准规格"与"样本标准方差"为基础,主要用于与输入框统计值参考值图形值Cpk<0.67工序能力太低1.修定标准; 2.加强培训,增强质量意识; 3.定期维护保养设备; 根据各组组距,决定组距之值(末位数建议为0或5);数据表中红底色数值为超出规格标准CPK 统计分析14500N 断开压力024681012141618-0.800 -0.300 0.200 0.700 1.200 1.700 2.200 2.700 3.200 频数正态线#REF!taiyn811得力制作当分布范围取为μ±3σ时,产品质量合格的概率可达99.7%工序能力是处于稳定生产状态下的实际加工能力X=规格值,C P=(Tu-Tl)/(6S) CPK=(1-Ca)Cp单侧公差情况下,C PK=C P。
cpk表格模版

cpk表格模版The Power of Positive Thinking。
Positive thinking is a powerful tool that can improve our mental and physical well-being. It has the ability to transform our lives and help us achieve our goals. The power of positive thinking lies in its ability to change our mindset and outlook on life, allowing us to approach challenges with optimism and confidence.One of the key benefits of positive thinking is its impact on our mental health. When we focus on the positive aspects of our lives, we are better able to manage stress and anxiety. Positive thinking can help us reframe negative situations and find the silver lining in difficult circumstances. This can lead to a greater sense of resilience and inner strength, allowing us to bounce back from setbacks and move forward with a positive attitude.In addition to its mental health benefits, positivethinking can also have a positive impact on our physical health. Research has shown that a positive outlook can lead to lower levels of stress hormones and a stronger immune system. This can result in a reduced risk of chronic diseases and a better overall sense of well-being. By maintaining a positive mindset, we can improve our overall health and increase our longevity.Furthermore, positive thinking can also improve our relationships with others. When we approach interactions with a positive attitude, we are more likely to build strong and meaningful connections with those around us. Positive thinking can lead to greater empathy, understanding, and compassion, which can strengthen our relationships and create a more supportive and harmonious environment.So, how can we cultivate a positive mindset in ourdaily lives? One way is to practice gratitude. By focusing on the things we are grateful for, we can shift our attention away from negativity and towards the positive aspects of our lives. Keeping a gratitude journal or simplytaking a few moments each day to reflect on the things we are thankful for can help us maintain a positive outlook.Another way to foster positive thinking is to surround ourselves with positive influences. This can include spending time with uplifting and supportive people, reading inspirational books, or listening to motivational speakers. By surrounding ourselves with positivity, we can reinforce our own positive mindset and stay focused on our goals.It's important to remember that positive thinking does not mean ignoring or denying the challenges anddifficulties we may face. Instead, it means approaching these challenges with a hopeful and optimistic attitude, believing in our ability to overcome them. By maintaining a positive mindset, we can build resilience, improve our mental and physical health, and create stronger connections with others.In conclusion, the power of positive thinking is undeniable. By cultivating a positive mindset, we can improve our mental and physical well-being, strengthen ourrelationships, and achieve our goals. With the right mindset, we can overcome obstacles, embrace new opportunities, and live a more fulfilling and meaningful life. So, let's embrace the power of positive thinking and watch as it transforms our lives for the better.。
CPK模板(直方图)

0.029988 0.0300153 2.22 2.51 1.93 1.93 2.36 2.67 2.05 2.05 0.56 -0.07 1.19 -0.07 0.53 -0.07 1.14 -0.07
0.072121 0.1150155 1.0562475 0.46 0.13 0.79 0.13 0.50 0.14 0.85 0.14 * * 0.27 0.27 * * 0.30 0.30 * * 0.57 * 0.57 * 0.52 * 0.52 43406.45 * 43406.45
12
产品名称 aa 产品描述 试产1 5 尺寸 1 8 30 25 20 15 10 5 0 3.76 3.84 3.93 频率 上、下限界线
客
户
aa
人员设备 2#机 张三 图表 整体 组内
编号1 的直方图
4.02
4.11
4.20
16 14 12 10 8 6 4 2 0 9.85 9.89
编号2 的直方图
制程能力报表
产品编号 生产工序 规格编号 规格描述 子组大小 规格值 上公差 下公差 上限值 下限值 序号 1 2 3 4 5 6 7 8 9 10 11 12 13 14 15 16 17 18 19 20 21 22 23 24 25 26 27 28 29 30 31 32 33 34 35 36 37 38 39 40 41 42 43 44 45 46 47 48 49 50 样本数 平均值 最大值 最小值 极差 标准差(整体) 标准差(组内) Pp (整体) PPL (整体) PPU (整体) PpK (整体) Cp (组内) CPL (组内) CPU (组内) Cpk (组内) 预期整体PPM<下限 预期整体PPM>上限 合计PPM 123 aa 1 长度 1 4 0.2 -0.2 4.2 3.8 测量值 4.05043 4.04411 4.06679 4.0192 4.04506 4.04162 4.05493 4.05408 4.04105 4.03584 4.00465 4.02052 3.97883 4.05915 4.00664 3.97397 4.05678 4.02391 4.00482 4.03765 4.03066 4.02009 4.01724 4.04028 4.00943 4.0244 3.96437 3.9936 4.07019 4.04006 4.04752 4.0716 4.02016 3.98222 3.98232 4.04025 4.03551 3.96778 4.00124 4.04367 4.00203 4.0276 4.04905 4.03546 4.02892 3.98852 4.00259 4.11054 4.0462 3.99268 50 4.0261242 4.11054 3.96437 0.14617 2 孔径 1 10 0.05 -0.05 10.05 9.95 测量值 9.944 9.9211 9.9248 10.0081 9.8685 9.8948 9.9733 9.9326 9.9526 9.9871 9.9077 9.9756 9.937 9.9501 9.9561 9.9617 9.9167 9.9451 9.9782 9.9544 9.9299 10.0117 9.8994 9.9258 9.9283 9.9229 9.9564 9.9497 9.947 9.9386 9.9323 9.9687 9.9752 9.9288 9.9506 9.9512 9.9614 9.8993 9.9313 9.9092 9.9798 9.9102 9.939 9.945 9.9682 9.9835 9.891 9.9099 9.9681 9.9628 50 10.0117 9.8685 0.1432 3 厚度 1 100 0.2 0 100.2 100 测量值 100.058 99.962 99.978 99.993 99.978 100.12 99.96 99.989 100.037 100.058 99.985 100.023 100.14 100.011 100.071 100.04 100.044 100.113 100.046 100.034 99.976 99.997 100.046 99.984 100.123 100.141 100.078 99.901 99.977 100.001 100.083 99.88 99.99 100.244 100.027 99.975 99.907 100.014 99.996 100.005 100 99.996 100.018 99.948 100.123 100.113 100.036 100.177 100.101 99.932 50 100.244 99.88 0.364 0.3 * 测量值 0.3 0.2 0.1 0 0.2 0.3 0.1 0.2 0.2 0 0.2 0.2 0.2 0.1 0.3 0.3 0.1 0.1 0.2 0.4 0.4 0.3 0.2 0 0.4 0.1 0.3 0.4 0.2 0.2 0.2 0.2 0.1 0.3 0.3 0 0 0.2 0.4 0.3 0.3 0.3 0.2 0 0.2 0.3 0.1 0.2 0.2 0.3 50 0.206 0.4 0 0.4 4 尺寸 1 0.3 0 0 * 8 测量值 8.9664 12.0354 8.5259 9.0799 10.3134 11.2894 8.8717 10.8088 9.5732 7.9177 8.9744 10.898 9.1509 9.6822 8.9207 8.6744 10.3684 9.8528 10.7878 8.2292 12.4574 8.2399 10.3513 11.1751 9.8249 9.4695 11.2272 9.7911 8.8306 8.6902 8.6776 10.1656 9.7234 9.4065 9.8901 10.1753 9.8861 9.8458 12.2528 8.5514 10.017 11.1971 10.7053 9.4089 10.7356 9.7589 9.3851 9.0092 8.9021 9.7672 50 9.808776 12.4574 7.9177 4.5397 14
cpk计算表格
实线 --- 样 本 μ正态分布图 虚线 --- 无偏移 M 正态分布图
0.00 0.00 0.00 0.00 0.00 0.00 0.00 0.00
Cp值自动测算用表
测算日期 测 算 者 测算目的 过程能力指数
规格设定 双侧公差 2 上限公差
供 应 商 零部件图号 零部件名称 Cp 组别 1 上限规范 下限规范 公差范围 TU TL T M x n σ ε K max min 0 0 0 0 2 3 4 5 6 7 8 9 10 11 12 13 14 15 16 17 18 19 20 样本检测数据 χ1 χ2 χ3 χ4 χ5
过程能力修正值 Cpk
下限公差
公差中心值 样本均值 样本数 样本标准方差 样本偏移量 样本偏移度 样本最大值 样本最小值
公称(规格)值 0 上公差 下公差 0 测算尺寸简述
西格玛水平Z
估算不良率 P 上限估算不良率 Pu 下限估算不良率 Pl
#VALUE!
样本数据散布图
1.000 0.900 0.800 0.700 0.600 0.500 0.400 0.300 0.200 0.100 0.000
0
变量
0.00
0.00
0.00
0.000
0.00
分布密度
正 态 分布图
0.00
0.00
0.00
0.00
0.00
0.00
0.00
0.00
0.00
0.00
0.00
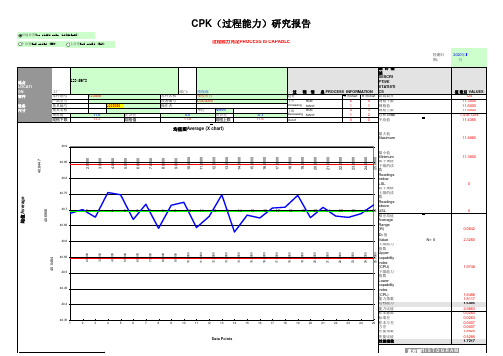
CPK表格
2.0000 3.0000 4.0000 5.0000 6.0000 7.0000 8.0000 9.0000 10.0000 11.0000 12.0000 13.0000 14.0000 15.0000 16.0000 17.0000 18.0000 19.0000 20.0000 21.0000 22.0000 23.0000 24.0000 25.0000
16 11.42 11.40 11.44
17 11.41 11.42 11.45
18 11.41 11.40 11.44
19 11.40 11.41 11.43
20 11.41 11.45 11.42
21 11.47 11.43 11.42
数据点Data Points
分布曲线Distribution Shape
1
1
下降
R次U数NHOW
超 De出cr控ea制sin限g MANY
4
3
1
2
Out of
0
0
统计描 述
DESCRI
PTIVE
STATISTI
CS 读数数目 规格下限 规格值 规格上限 总和Total 平均值
均值图Average (X chart)
最大值 Maximum
40.9 40.85
40.8 40.75
40.7 40.65
40.6 40.55
40.5 40.45
40.4 40.35
1
最小值
2.0000 3.0000 4.0000 5.0000 6.0000 7.0000 8.0000 9.0000 10.0000 11.0000 12.0000 13.0000 14.0000 15.0000 16.0000 17.0000 18.0000 19.0000 20.0000 21.0000 22.0000 23.0000 24.0000 25.0000
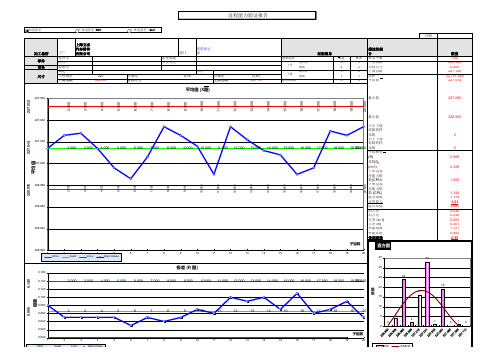
中文cpk,xbar最新计算表格
227.02 227.06 227.02 226.98 226.98 227.01 227.03 227.03 227.01 227.05 226.98 227.02 227.01 227.02 227.05 227.06 227.01 227.05 227.02 227.06
227.06 227.01 227.03 227.01 227.01 226.98 227.01 227.06 227.02 226.98 226.96 226.98 227.02 226.98 227.01 226.95 227.01 227.05 227.02 227.06
0.080 0.060
2
3
4
5
6
7
8
9
10
11
12
13
14
15
16
17
18
19 20
0.040
0.020
子组数
0.000
1
2
3
4
5
6
7
8
9
10
11
12
13
14
15
16
17
18
19
20
UCLr
AveR
LCLr
Data Values
频数
30
25
24
20 16
15
10
5
4
2
0 0
矩形
分布形状
19
1
010
0.140
227.040
227.020
227.000
226.980
226.960
226.940
226.920 1 UCLx
过程能力CPK分析表
公司名称 部门
测量仪器 测量特性
品质部 影像测量仪 外径尺寸
广州三目电子有限公司 产品名称 仪器编号 标准值
O形圈 JC-04 20.40
产品规格 产品编号 测量单位 标准上限
φ20×2.4 CHR-81960
mm 20.50
样本容量 评估日期 测量人员 标准下限
5 2021年9月2日
子组极差
0.04 0.07 0.04 0.06 0.05 0.03 0.05 0.06 0.05 0.04 0.07 0.05 0.06 0.05 0.03 0.05 0.04 0.06 0.04 0.05 0.06 0.05 0.07 0.04 0.05
均值 X= 20.398
极差 R= 0.050
20.40 20.40 20.40 20.40 20.40 20.40 20.40 20.40 20.40 20.40 20.40 20.40 20.40 20.40 20.40 20.40 20.40 20.40 20.40 20.40 20.40 20.40 20.40 20.40 20.40 0.0504 0.0504 0.0504 0.0504 0.0504 0.0504 0.0504 0.0504 0.0504 0.0504 0.0504 0.0504 0.0504 0.0504 0.0504 0.0504 0.0504 0.0504 0.0504 0.0504 0.0504 0.0504 0.0504 0.0504 0.0504
σ=R/d2= 0.02
Cpu =(USL -均值)/(3σ)= 1.56
Cpl =(均值-LSL )/(3σ)= 1.51
过程能力指数:CPK=min(Cpu,Cpl)=
Cpk分析表格
Cp 离散趋势精确度 (USL-LSL) / 6σ Ca 集中趋势精确度 (X-U)/(T/2) Cpk
1
#DIV/0! #DIV/0! #DIV/0!
标准差 σ 最大值 CPK
0.00 最小值 #DIV/0! CPK
Cp * ( 1 - |Ca|)
1
0
0.00 0.00 0.00 0.00 0.00 0.00 0.00 0.00 0.00 0.00 0.00 0.00
有限公司
Cpk数据分析表
产品名称 产品图号
数据表 公差上限 USL 公差下限 LSL 规格中心 U 规格公差 T X 平均值 标准差 σ 最大值 最小值 CPKU CPKL CPK
采集时间 加工内容
双上限规格 879.00 878.60 (USL+LSL)/2 USL-LSL na STDEV MAX Min ( USL-ˉx ) / 3σ ( ˉx -LSL )/ 3σ Min(CPKU ,CPKL)
←输入上限值 ←输入下限值
生产设备 设备编号
只有上限规格 公差上限 USL
←输入上限值
特征值 公称尺寸
只有下限规格 公差下限 USL
←输入下限值
878.8 0.4 #DIV/0! #DIV/0! 0.00 0.00 #DIV/0! #DIV/0! #DIV/0! X 平均值 AVERAGE STDEV MAX (USL-ˉx ) / 3σ #DIV/0! X 平均值 #DIV/0! 标准差 σ AVERAGE STDEV MIN ( ˉx -LSL )/ 3σ #DIV/0! #DIV/0! 0.00 #DIV/0!
测量/日期
分析/日期
审核/日期
XX-X-XXX-RXXAX
- 1、下载文档前请自行甄别文档内容的完整性,平台不提供额外的编辑、内容补充、找答案等附加服务。
- 2、"仅部分预览"的文档,不可在线预览部分如存在完整性等问题,可反馈申请退款(可完整预览的文档不适用该条件!)。
- 3、如文档侵犯您的权益,请联系客服反馈,我们会尽快为您处理(人工客服工作时间:9:00-18:30)。
cpk表格模板
在工业生产过程中,为了保证产品质量,常常需要对生产过程
进行监控和控制。
其中,CPK控制图是常用的一种方法,它可以
帮助我们评估生产过程的稳定性和能力。
在制作CPK控制图时,
有很多参数需要计算,这个时候,使用CPK表格模板可以极大地
简化运算过程,提高计算效率。
一、CPK控制图概述
CPK控制图是一种统计分析工具,用于评估生产过程的稳定性
和能力。
它能够展示出生产过程的分布情况及其与制定产品规格
之间的偏差程度。
CPK控制图中包含的参数主要有直方图、正态
概率图、控制图和能力指数。
二、CPK表格模板介绍
在制作CPK控制图时,需要对数据进行多项参数计算,这个
过程相对复杂,费时费力。
CPK表格模板的作用就是简化这一过程。
它是一个预先设计好的Excel表格,内含多项参数的计算公式,
只需要将输入数据填入表格中相应的位置,就能轻松快捷地得到各项计算结果。
三、CPK表格模板的使用步骤
1. 下载CPK表格模板,并用Excel打开。
2. 填写数据收集表,将采集到的数据填入相应表格中。
3. 在CPK表格中,填入上一步骤中的采集数据,根据实际情况填写表格所需要的其他信息。
4. 根据表格内的公式进行运算,得到各项参数的计算结果,将结果填入控制图模板相应位置。
四、CPK表格模板的优势
1. 简单易用。
只需要将数据填入相应位置,就能轻松获得各项参数的计算结果,省时省力。
2. 精度高。
CPK表格模板内含多项精确的计算公式,能够保证计算结果的准确性。
3. 多功能。
CPK表格模板可以根据不同的情况进行调整,扩展功能,满足用户不同的需求。
五、总结
CPK表格模板是一种非常实用的工具,能够极大地提高进行CPK控制图计算的效率和准确性,为工业生产过程的质量管理提供了重要的支持。
需要注意的是,不同厂家生产的产品规格可能存在差异,应根据实际情况进行调整,调整后的CPK表格模板才能更好地满足用户的需求。