Transition of super-hydrophobic states of droplet on rough surface
聚多巴胺亲水改性 -锂硫电池

2015/10/52012-10-12
2015/10/52012-10-12
2015/10/52012-10-12
Results
S的利用率提高
typical discharge potential plateau at about 2.30 V and 2.0 V (vs Li/Li+) can be easily observed in the initial cycle for the two comparative cells, assigned to the reduction from sulfur to lithium polysulfides and further reduction to Li2S2/Li2S and in consistent with the CVs. For the cell using PDA modified separator, obvious decreasing of discharge capacity can be observed in the second cycle, which may relate to the dissolution of polysulfide and will be further disscussed in the below
2015/10/52012-10-12
Results
It can be seen that only the peak of C1s can be observed, while for the PDA modified seperator, two additional peaks attributed to N1s and O1s appear at 400.4 and 532.7 eV, respectively, indicating that PDA coating layer is generated on the surface of seperator to produce a hydrophilic seperator
JACS
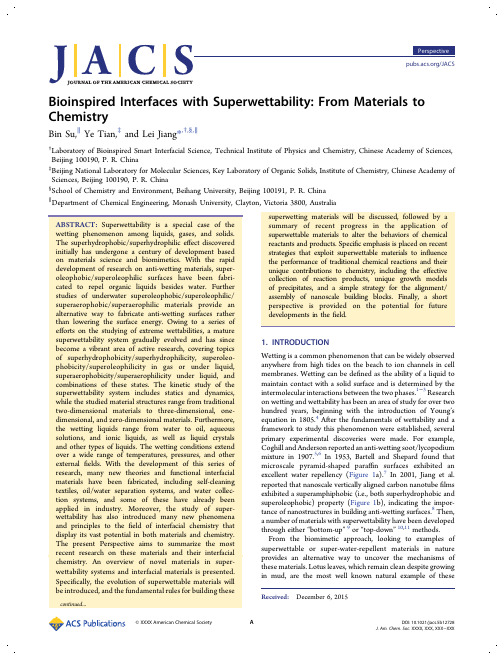
1. INTRODUCTION Wetting is a common phenomenon that can be widely observed anywhere from high tides on the beach to ion channels in cell membranes. Wetting can be defined as the ability of a liquid to maintain contact with a solid surface and is determined by the intermolecular interactions between the two phases.1−3 Research on wetting and wettability has been an area of study for over two hundred years, beginning with the introduction of Young’s equation in 1805.4 After the fundamentals of wettability and a framework to study this phenomenon were established, several primary experimental discoveries were made. For example, Coghill and Anderson reported an anti-wetting soot/lycopodium mixture in 1907.5,6 In 1953, Bartell and Shepard found that microscale pyramid-shaped paraffin surfaces exhibited an excellent water repellency (Figure 1a).7 In 2001, Jiang et al. reported that nanoscale vertically aligned carbon nanotube films exhibited a superamphiphobic (i.e., both superhydrophobic and superoleophobic) property (Figure 1b), indicating the importance of nanostructures in building anti-wetting surfaces.8 Then, a number of materials with superwettability have been developed through either “bottom-up” 9 or “top-down” 10,11 methods. From the biomimetic approach, looking to examples of superwettable or super-water-repellent materials in nature provides an alternative way to uncover the mechanisms of these materials. Lotus leaves, which remain clean despite growing in mud, are the most well known natural example of these
表面引发原子转移自由基聚合(SI-ATRP)法制备超疏水膜及其膜蒸馏应用
表面引发原子转移自由基聚合(SI-ATRP )法制备超疏水膜及其膜蒸馏应用刘振1,2,高靖霓1,2(1.天津工业大学材料科学与工程学院,天津300387;2.天津工业大学省部共建分离膜与膜过程国家重点实验室,天津300387)摘要:为探究对膜结构控制行之有效的制膜法,采用表面引发原子转移自由基聚合(SI-ATRP )法制备真空膜蒸馏(VMD )用超疏水膜;以聚丙烯中空纤维膜为基膜,用过硫酸铵溶液活化膜表面,随后引发甲基丙烯酸缩水甘油酯(GMA )的多次SI-ATRP 聚合,并使用全氟辛酰氯对接枝层进行修饰;之后对改性膜表面化学组成、表面粗糙度、抗润湿性、孔径及孔隙率进行了表征;同时比较了改性前后膜在高进料浓度下以及长期运行时间内的VMD 性能。
结果表明:改性后,膜表面SEM 结果显示出明显的接枝层覆盖,且共聚焦显微镜(CSM )、水接触角(WCA )结果证实当初始单体用量为膜质量的20倍时,制得表面具备多孔拓扑结构,水接触角高达179.0毅的超疏水膜L-PP-20;孔径分布及孔隙率结果显示L-PP-20的孔径分布变窄、孔隙率增大;通过短期高进料浓度及21h 的长期VMD 实验,表明L-PP-20的短期性能尚可,长期平均通量为11.01kg/渊m 2窑h冤,超出原膜4.53kg/渊m 2窑h冤,通量及截留率长期稳定性好,为SI-ATRP 法制膜在VMD 中提供良好范例。
关键词:膜蒸馏;超疏水膜;ATRP 聚合;抗湿性中图分类号:TS102.54;O632.52文献标志码:A 文章编号:员远苑员原园圆源载(圆园21)园4原园园01原10Preparation of superhydrophobic membrane via SI-ATRP method andits application in membrane distillationLIU Zhen 1,2,GAO Jing-ni 1,2(1.School of Material Science and Engineering ,Tiangong University ,Tianjin 300387,China ;2.State Key Laboratory of Separation Membranes and Membrane Processes ,Tiangong University ,Tianjin 300387,China )Abstract :In order to explore an effective method for controlling membrane structure,surface-initiated atom transfer radicalpolymerization (SI-ATRP)was employed to prepare superhydrophobic membranes for vacuum membrane distilla鄄tion (VMD).The polypropylene hollow fiber membrane was used as the base membrane,the surface was activated with ammonium persulfate solution,followed by multiple SI-ATRP polymerizations of glycidyl methacrylate (GMA),and the graft layer was modified with perfluorooctanoyl chloride.Then,the surface chemical composition,surface roughness,anti-wetting property,pore size and porosity of the modified membrane were characterized.At the same time,the VMD performance of the modified membrane under high feed concentration and long-term running time was compared.The results showed that after modification袁the SEM images of the membrane surface demonstrated prominent graft layer coverage.The results of CSM and WCA reveal that when the initial monomer content was 20times the mass of membranes袁the surface exhibited porous topology and the water contact angle was as high as179.0毅袁indicating superhydrophobic membrane was acquired袁the corresponding sample was L-PP-20.The pore size distribution and porosity suggested that the pore size distribution of L-PP-20was narrowed and the porosity increased.When the short-term high feed concentration and 21h long-term VMD were tested袁the results indi鄄cated that the short-term performance of L-PP-20was acceptable and long-operation average flux was 11.01kg/渊m 2窑h冤袁exceeding the original membrane by 4.53kg/渊m 2窑h冤.The long-term stability of flux and rejection rateDOI :10.3969/j.issn.1671-024x.2021.04.001第40卷第4期圆园21年8月Vol.40No.4August 2021天津工业大学学报允韵哉砸晕粤蕴韵云栽陨粤晕GONG 哉晕陨灾耘砸杂陨栽再收稿日期:2020-12-30基金项目:国家自然科学基金资助项目(51273147)通信作者:刘振(1972—),男,博士,研究员,主要研究方向为膜分离技术。
紫外光刻技术制备各向异性超疏水表面

紫外光刻技术制备各向异性超疏水表面占彦龙;李文;李宏;胡良云【摘要】结合紫外光刻技术与湿化学刻蚀法,将掩模板上的条纹结构转移到锌基体上;然后利用月桂酸修饰降低表面能,制备出具有不同间距条纹结构的各向异性超疏水表面.使用接触角测量仪表征其浸润性、偏光显微镜表征其形貌结构、傅里叶红外光谱仪分析表面成分,利用接触角测量仪搭建简易的平台探究制备的具有条纹结构的各向异性超疏水表面的减阻性能.掩模板上5、10、15、30μm间距的条纹图案很好地转移到了锌基体上,经月桂酸修饰后接触角最高达156.26°.当间距d=30μm时,各向异性浸润性最显著,ΔCA=9.93°.实验表明可通过调节条纹间距来控制各向异性浸润性,各向异性浸润性程度ΔCA随条纹间距的增加而增加,平行于各向异性超疏水表面的条纹结构方向有一定的减阻性能.利用该方法可制备特殊结构的各向异性超疏水表面,用于流体定向减阻与运输,微流体器件等领域.%The stripe structure on the mask plate was transferred to the zinc substrate by combining ultraviolet ( UV ) photolithography and wet chemical etching , and the anisotropic superhydrophobic surfaces with different stripe spacing were prepared by modifying the surface with lauric acid to lower down surface energy .The wettability was measured by the contact angle measurement instrument , and its morphology was characterized by polarizing mi-croscope , the surface composition was analyzed by Fourier transform infrared spectrometer .The drag-reduction per-formance of as-prepared anisotropic superhydrophobic surface with stripe structure was explored by a simple plat -form built with contact angle measurement instrument .The stripe pattern with the spacing of 5, 10, 15, 30μm on themask plate was well transferred to the zinc substrate , and the contact angle was as high as 156.26 °after being modified by lauric acid.Whend=30 μm, the degree of anisotropy is most significant ,ΔCA=9.93°.The experi-mental results show that the anisotropic wettability can be controlled by adjusting the stripe spacing , the degree of anisotropic wettability increases with the increase of stripe spacing , and the as-prepared anisotropic superhydropho-bic surface has a certain drag reduction performance .Anisotropic superhydrophobic surface with special structure can be prepared by this method for applications in the filed of fluid directional drag-reduction and transportation , microfluidic devices and other fields .【期刊名称】《科学技术与工程》【年(卷),期】2017(017)032【总页数】5页(P50-54)【关键词】紫外光刻技术;条纹结构;各向异性;超疏水;浸润性;减阻【作者】占彦龙;李文;李宏;胡良云【作者单位】湖北师范大学物理与电子科学学院,黄石 435002;湖北理工学院矿区环境污染控制与修复重点实验室,黄石435003;湖北理工学院矿区环境污染控制与修复重点实验室,黄石435003;湖北师范大学物理与电子科学学院,黄石 435002;湖北师范大学物理与电子科学学院,黄石 435002;湖北理工学院矿区环境污染控制与修复重点实验室,黄石435003【正文语种】中文【中图分类】TB342仿生超疏水表面具有优异的疏水性能,使得其拥有防水[1]、防覆冰[2]、防污染[3]、防腐蚀[4]等特性,在很多领域有着潜在的应用前景[5—9],如输电线路防冰雪,运输管道减阻,轮船增加浮力,金属防腐蚀,建筑外墙防水自清洁等。
滑移长度与接触角关系
5352012,24(4):535-540DOI: 10.1016/S1001-6058(11)60275-8NUMERICAL STUDY OF THE RELATIONSHIP BETWEEN APPARENT SLIP LENGTH AND CONTACT ANGLE BY LATTICE BOLTZMANN METHOD*ZHANG Ren-liang, DI Qin-feng, WANG Xin-liang, DING Wei-peng, GONG WeiShanghai Institute of Applied Mathematics and Mechanics and Shanghai Key Laboratory of Mechanics in Energy Engineering, Shanghai University, Shanghai 200072, China, E-mail: zhrleo@(Received December 9, 2011, Revised March 1, 2012)Abstract: The apparent slip between solid wall and liquid is studied by using the Lattice Boltzmann Method (LBM) and the Shan-Chen multiphase model in this paper. With a no-slip bounce-back scheme applied to the interface, flow regimes under different wall wettabilities are investigated. Because of the wall wettability, liquid apparent slip is observed. Slip lengths for different wall wettabilities are found to collapse nearly onto a single curve as a function of the static contact angle, and thereby a relationship between apparent slip length and contact angle is suggested. Our results also show that the wall wettability leads to the formation of a low-density layer between solid wall and liquid, which produced apparent slip in the micro-scale.Key words: Lattice Boltzmann Method (LBM), wettability, apparent slip, contact angle, nano-particles adsorbing methodIntroductionThe no-slip boundary condition, which states that the fluid velocity at a fluid-solid interface equals that of the solid surface has been proven valid at macro- scopic scales, but is not fulfilled at microscopic scales[1]. A series of experiments[2,3] and numerical results[4,5] have found fluid slip at the boundaries of the flow channels in microfluidics. As the typical length scale of the micro-fluid flows gets smaller, the effect of boundary slip becomes more prominent, and has been paid more attention in engineering applica- tions[6]. Based on this slip boundary effect, artificial super-hydrophobic surfaces have been widely used in industrial production and daily life. For example, self- *Project supported by the National Natural Science Foun- dation of China (Grant No. 50874071), the National High Technology Research and Development of China (863 Program, Grant No. 2008AA06Z201), the Key Program of Science and Technology Commission of Shanghai Municipality (Grant No. 071605102) and the Leading Talent Funding of Shanghai. Biography: ZHANG Ren-liang (1982-), Male,Ph. D. CandidateCorresponding author: DI Qin-feng,E-mail: qinfengd@ cleaning paints, roof tiles, fabrics and glass windows that can be cleaned by a simple rainfall and the nano- particles adsorbing method[2] in improving oil reco- very are all in practice.Slip length is of great importance in calculation of drag and other hydrodynamic properties of fluid flowing through micro-channels or over nano-scale patterned surfaces, but it is very difficult to directly measure the apparent slip length accurately in experi- ments. In 1823, Navier proposed a slip boundary con- dition that the fluid velocity at a point on a surface is proportional to the shear rate at the same point, but the value of slip length is hard to be determined. Chen et al.[7] investigated the Couette flows by means of a two-phase mesoscopic Lattice Boltzmann Method (LBM), and the results showed that there is a strong relationship between the magnitude of slip length and the solid-fluid interaction, but it is a very difficult or even impossible task to compute the exact slip length in dependence of interaction and it is also difficult to be applied to engineering.In this work, we focus on investigating the effe- cts of wall wettabilities on the slip length in order to get a slip length model governed by contact angle. Using this model, it is easy to estimate the slip length because the contact angle is a parameter that can be536 easily measured.1. Numerical modelTo simulate non-ideal multiphase fluid flows, the attractive or repulsive interaction among molecules, which is referred to as the non-ideal interaction, should be included in the LBM. There are many app- roaches to incorporate non-ideal interactions, such as the color-fluid model, interparticle-potential model, free-energy model, mean-field theory model and so on. The interparticle-potential model proposed by Shan and Chen [8,9] is to mimic microscopic interaction forces between the fluid components. This model modified the collision operator by using an equili- brium velocity that includes an interactive force. This force guarantees phase separation and introduces sur- face-tension effects. This model has been applied with considerable success in measuring contact angles [10] and examining the effect of wall wettabilities, topo- graphy and micro-structure on drag reduction of fluid flow through micro-channels [11]. As an extension of the Shan-Chen model, Benzi et al.[12] first derived an analytical expression for the contact angle and the sur- face energy between any two of the liquid, solid and vapor phases.The LBM, which involves a single relaxation time in the Bhatnagar-Gross-Krook (BGK) collision operator, is used here. The time evolution of this model can be written as+,+,i i i =f t t t f t '' x c x1(,)(,)eq i i f t f t W ª ¬x x º¼(1) herew (,)i f t x r fluid p i is the single-particle distribution fun-ction fo articles moving in the direction i c at (,)t x , (,)eq f t x the equilibrium distribution un- ' e step of simulation, and parameter f ction, t the tim W the relaxation time characterizing the collision pro- sses by which the distribution functions relax to- wards their equilibrium distributions.In the two-dimensional (2-D) squ ce are lattice with nine velocities model [13], the equilibrium distribution function, (,)eq i f t x , d pends only on local density and veloci n be chosen as the following forme ty and ca 224()=1++22i i eqii s s f c c c Z U ªº«» «»¬¼c u c u u u 2s (2)rewhe=0,0i c c (= 0)i 1)1)=cos ,sin 22i i i c S S ªº«»¬¼c (3b) (=1,...,4)i2-92-9=cos ,sin 44i i i c S S º»¼c(=5,...,8)i (3c)4=9i Z (=0)i(4a)1=9i Z (=1,2,3,4)i (4b)1=36i Z (=5,6,7,8)i (4c)221=3s c c (5)t =/c x '' is the lattice velocity, x ' the lattice dis- tance, and t ' the time step of simulation, and U the fluid density, which can be ned from obtai =Uiif¦.The macroscopic velocity u is given by=++i i ads if U W ¦u c F F (6)Eq In .(6), F and ads F are th d-fluid interact e flui ionforce and fluid-solid inter y. The fluid-fluid interaction is obtained by using an ctive short-range force [8]action force, respectivel attra()=(,)+,i i i iG t t t \ 'w \¦F x x x c c (7)where G is the interaction strength, which is used to ontrol the two-phase liqui in c d teraction, and is nega- tive for icle attraction, part \ is the in ntial, which is defined as [14]teraction pote-/0(,)e t =UU\\ x (8)0\ and 0U are constants As in Ref.[14] i w istaken as 1/9 for =1,2,4i , (3a). as 0 fo It is simple to and a wall by introducing an extra force, and thise as T to induce hase separatio in this pape ond equation is [14],3i w 1/36 for i =5,6,7,8, and r =0i .describe the interaction between a luid f m thod w first used by Martys and Chen [15].he idea is to create an analogue to the particle-particle in- teraction force used p n, and r the corresp ing537()=(,)(+,)ads ads i i i iG t w s t t \ '¦x x x c c (9)Here =0,1s for the fluid and the solid phase, respe- ctively, and the adhesion parameter ads G is used to control the wettability behavior of the li u F q surfaces. I t can be seen that Eq.(9) incor dhesive interaction between fluid and surfaces.nd the as id at solid porates an a A relaxation time tunes the kinematic vis- cosity21=2s v c t W §· '¨¸©¹ (10)The equation of state in the Shan-Chen model s [14] i>@2,)=+(36G P t U \x (11)where P isthe pressure.ig erent value.in a 2-D o simula- on-sl sche s employed for the solid-fluid interfaces, nd periodic boundary conditions were applied at both let and outlet ends along the horizontal direction. A he middle betwFig.1 Static contact angleF .2 Contact angles as a function of absG for diff of GNumerical simulation of contact angleThe LBM simulations were carried out main. The grid mesh used is 50×200. In the2d tion, as in Ref.[11], the general n ip bounce-back me [16] wa a in droplet with the diameter of 30, is set at t een two ends. After 30 000 time steps, the result tends to be stabilized. Figure 1 shows an example ofstatic contact angle, which is 127.6o when =120G , =130abs G and 200/(,)=4e x t U \ in Eqs.(7) and (9). The values of parameters G and abs G and the simulated contact angles for each case are listed in Fig.2.As is shown in Fig.2, abs G and G determine the value of contact angle. abs G represen - action d solid surface andG the strength of interaction tweenparticles. A negative abs G indicates attractive interaction. When ts fluid e ma the stre gnitude of ngth of inter G between fluid an be ven, the greater th is gi abs G , the stronger the reac , thus resulting in smaller contact angle. The act angle is a static parameter of measuring the wettability of a liquid on a lid surface, and it can be easily measured. I n our simulation, we also change the parameter abs G to simulat rbitrary contact angle, and then easily obtain ent wall wettabilities. Form Fig.2, we also see that both parameters of abs G and G have signifi- cant impact on the simulated contact angle.tion cont n ed in Figs.3 and 4 (g so diff ca e a er ig.3 V ig.4 . Nu wettabi- ti mu- ti ensity Poiseuilleows are displayF elocity profiles with different contact anglesF Density profiles with different contact anglesmerical simulation of slip lengthIn order to investigate the effects of wall es on the slip length, we conducted numerical si ons for the 2-D Poiseuille flows. Typical d3li la and velocity profiles of the pressure-driven fl iven G =120 ).538 The ordinate in both figures represents the distanceto the other. The from one of the solid surface boundary abscissa in Fig.3 is the normalized velocity, where 0v is the max velocity measured at the center in the channel for the case of no slip. The abscissa in Fig.4 is the normalized fluid density, where 0U is the liquid density for the case of no slip. The pressure gra- dient is specified as 5×10⁻³ in lattice unit for both cases. Different contact angles (as shown in both Figs.3 and 4) can be simulated by specifying different values of the adhesion parameter (abs G ). All simula- tions were run until static equilibrium was nearly attained, and then a pressure gradient of 5×–3 was applied in the x -direction (flow direction).10ary d at y i e bo ig.5 V A pproa-hes ) or nt with e bo the o bo daries. However, the flu locit ncrea- th undary. he l the b plotted in Fig.3 e obtained from LBM i the contact the intera-t ter ). s, mb of reseF elocity profiles of simulated and fitteds is shown in Fig.3, the fluid velocity a zero as 24.5y o (the lower bound (the upper boundary), which is consiste unce-back boundary condition specifiec y o th tw un id ve ses dramatically in a very thin layer near T ayer is so thin that it is hard to see its details nearoundary, and velocity at the boundary looks likenon-zero when a larger scale, as shown in . I n a macro-scale, velocity at a boundary is nearly zero, but in a micro-scale, the velocity appears non-zero (so called apparent slip). Plots shown in Fig.3 clearly indicate that the slip velocity at the boun- dary increases as contact angle increases. I n order to understand the physical mechanism of such kind ofphenomenon, the density profiles of fluid with diffe-rent contact angles is drawn in Fig.4. One should notethat the density of the fluid with zero contact angle isconstant (as shown by the circle symbol vertical linein Fig.4). However, a sharp reduction of fluid densitynear the boundary is observed for a fluid with non-zero contact angle, which clearly indicates a layer ofmuch less dense fluid (most probably gas) is inducedbetween the dense liquid and solid surface. Fitting forthe velocity data points where the density is approxi- mately constant, we can get a parabolic of velocity profiles, and extrapolating the fitted profiles to zerovelocity yields a slip length as shown in Fig.5. Given an interaction strength (G ), different slip lengths can be obtained by using a series values of the adhesion parameter (abs G ), as shown in Fig.6. As was discussed above, the parameter of abs G controls the interactionbetween the fluid and solid surface. I ncreasing abs G decreases the attraction (or increases the repulsion) between the liquid and solid surface, and thus attracts more gas to the surface. The less dense of the fluid at the surface, less viscous shear force, and the more significant slippage appeaFrom Figs.3 and 4 one can see that the wetting properties of the wall have an important influenc the velocity profile, especially the slip velocity at the boundary. There is a low-density layer between the bulk liquid and the wall, and the more hydrophobic the wall is, the lower density of fluid is (see Fig.4). This result is similar to thos the rs. e onother simulation [17] and observed in MDS [18]. Compa- red with the macroscopic flow, the ratio of the low- density layer region to the inner region is larger in the microscopic flow, and this is the main difference between micro-flow and macro-flow. Thus, the slip cannot be ignored in the micro-flow.F g.6 Slip length as a function of absG for different From Figs.2 and 6, we can see that ngle and slip length are associated with ion strength (G ) and adhesion parame umerical results of contact angles and slip lengt G a c (abs G h Fig.7,N represented by different sy ols shown in orrespond to different values G , respectively, re-c p nted by squares (=120G ), circle (=125G ),delta (=130G ) and gradient (=135G ). The numerical results shown in Fig.7 cover a wide range of contact angles, ranging from 18o to 150o . Results shown in Fig.7 clearly indicate that slip length is a function of contact angle. The relationship between slip length and contact angle can b easily obtained by fitting those numerical Eq.(12)) a y the solid Fig.7.e data (see s shown b curve in539/56.06=0.1441e 1L T G (12)where T is contact angle and L G is slip length.i on i o a gle h ed above, the slip length is the result of interaction ace, and it depe- ds on the properties of the liquid (e.g., ) and the lu n fluid articles (controlled by a parameter of ) and the in- raction between a fluid and a soli ontrolled by al ng, SHEN Chen and WANG Zhang-hong et al.Experimental research on drag reduction of flow in micro-channels of rocks using nano-particle adsorption . Acta Petrolei Sinica, 2009, 30(1): 125- ese).[4] [5] AT T. and WANG Y. Slip effects on[6] 2008, 25(1): [8] [9] [10] ., THORNE D. T. Jr and SCHAAP M. G. et07, 76(6): on drag reduction effect in micro-channel flow [12] of boundaries: The contact angle[J]. Physical [14] [15] lation of multicompo-F g.7 The slip length against contact angleForm Fig.7 we can see that the slip lengths fferent surfaces are found to collapse nearly ont ngle curve as a function of the static contact an aracterizing the surface wettability. As was discu-d si c ss between the liquid and the wall surf n G wall surface (e.g., abs G ). So the simulation of slip length should take into account all parameters of the interaction objects, but it is a very hard task [19] to do this. I n fact, the contact angle is a more comprehe- nsive expression of interactions between liquid and solid surface, and the weaker the solid-f id intera- ction is, the larger the contact angle is. So it may be a feasible and advisable way to use contact angle as control parameter to simulate the slip length.4. ConclusionThe LBM has been successfully applied in this work to simulate contact angle of a fluid on a solid surface and slip length of a fluid flowing over a solid surface. Both the non-ideal interaction betwee p G d (c te another parameter of abs G ) have significant impact on the contact angle and slip length. However, they have little influence on the relationship between the contact angle and slip length. Our numerical results confirm that there is a low-density layer between the bulk liquid, and that the wetting properties of the wall have an important influence on the velocity profile. The more hydrophobic the w l is, the lower density of fluid is. Thus, the slip cannot be ignored in the micro- flow.References[1] HYVALUOMA J., HARTI NG J. Slip flow over stru-ctured surfaces with entrapped microbubbles[J]. Physi- cal Review Letters, 2008, 100(24): 246001.[2]DI Qin-fe method[J]128(in Chin [3] BURTON Z., BHUSHAN B. Hydrophobicity, adhesion,and friction properties of nanopatterned polymers and scale dependence for micro-and nanoelectromechanical systems[J]. Nano Letters, 2005, 5(8): 1607-1613.ZHANG J. Lattice Boltzmann method for microfluidics:Models and applications[J]. Microfluidics and Nano- fluidics, 2010, 10(1): 1-28.KHAN M., HAY shearing flows in a porous medium[J]. Acta Mechan- nic Sinica, 2008, 24(1): 51-59.WANG Xin-liang, DI Qin-feng and ZHANG Ren-lianget al. Progress in theories of super-hydrophobic surface slip effect and its application to drag reduction techno- logy[J]. Advances in Mechanics, 2010, 40(3): 241- 249(in Chinese).[7] CHEN Yan-yan, YI Hou-hui and LI Hua-bing Boun-dary slip and surface interaction: A lattice Boltzmann simulation[J]. Chinese Physics Letters,184-187.SHAN X., CHEN H. Lattice Boltzmann model for simu-lating flows with multiple phases and components[J]. Physical Review E, 1993, 47(3): 1815-1819.SHAN X., CHEN H. Simulation of nonideal gases andliquid-gas phase transitions by the lattice Boltzmann equation[J]. Physical Review E, 1994, 49(4): 2941- 2948.HUANG H al. Proposed approximation for contact angles in Shan- and-Chen-type multicomponent multiphase lattice Boltzmann models[J]. Physical Review E, 201-6.[11] ZHANG Ren-liang, DI Qin-feng and WANG Xin-liang,et al. Numerical study of wall wettabilities and topo- graphy by lattice Boltzmann method[J]. Journal of Hydro- dynamics, 2010, 22(3): 366-372.BENZI R., BIFERALE L. and SBRAGAGLIA M. et al.Mesoscopic modeling of a two-phase flow in the pre- sence Review E, 2006, 74(2): 021509.[13] QIAN Y. H., DމHUMIERES D. and LALLEMAND P.Lattice BGK models for Navier-Stokes equations[J]. Europhysics Letters, 1992, 17(6): 479-484.SUKOP M. C., THORNE D. T. Lattice Boltzmannmodeling: An introduction for geoscientists and engineers [M]. Berlin, Heidelberg, Germany: Springer- Verlag, 2006.MARTYS N. S., CHEN H. Simu nent fluids in complex three-dimensional geometries by the lattice Boltzmann method[J]. Physical Review E, 1996, 53(1): 743-750.[16] GUO Zhao-li, ZHENG Chu-guang. The principle andapplication of the method [M]. Beijing: Science Press, 2009(in Chinese).540[17]04, 70(5): 1-4.06, 55(10): 5305-5310(in Chinese). 9] HARTI NG J., KUNERT C. and HERRMANN H. J.Lattice Boltzmann simulations of apparent slip in hydrophobic microchannels[J]. Europhysics Letters,2006, 75(2): 328-334.ZHANG J., KWOK D. Y. Apparent slip over a solid-liquid interface with a no-slip boundary condition[J].Physical Review E, 20[18] CAO Bing-Yang, CHEN Min and GUO Zeng-Yuan.Velocity slip of liquid flow in nanochannels[J]. ActaPhysica Sinica, 20[1。
Mach_数和壁面温度对HyTRV_边界层转捩的影响
第9卷㊀第2期2024年3月气体物理PHYSICSOFGASESVol.9㊀No.2Mar.2024㊀㊀DOI:10.19527/j.cnki.2096 ̄1642.1098Mach数和壁面温度对HyTRV边界层转捩的影响章录兴ꎬ㊀王光学ꎬ㊀杜㊀磊ꎬ㊀余发源ꎬ㊀张怀宝(中山大学航空航天学院ꎬ广东深圳518107)EffectsofMachNumberandWallTemperatureonHyTRVBoundaryLayerTransitionZHANGLuxingꎬ㊀WANGGuangxueꎬ㊀DULeiꎬ㊀YUFayuanꎬ㊀ZHANGHuaibao(SchoolofAeronauticsandAstronauticsꎬSunYat ̄senUniversityꎬShenzhen518107ꎬChina)摘㊀要:典型的高超声速飞行器流场存在着复杂的转捩现象ꎬ其对飞行器的性能有着显著的影响ꎮ针对HyTRV这款接近真实高超声速飞行器的升力体模型ꎬ采用数值模拟方法ꎬ研究Mach数和壁面温度对HyTRV转捩的影响规律ꎮ采用课题组自研软件开展数值计算ꎬMach数的范围为3~8ꎬ壁面温度的范围为150~900Kꎮ首先对γ ̄Re~θt转捩模型和SST湍流模型进行了高超声速修正:将压力梯度系数修正㊁高速横流修正引入到γ ̄Re~θt转捩模型ꎬ并对SST湍流模型闭合系数β∗和β进行可压缩修正ꎻ然后开展了网格无关性验证ꎬ通过与实验结果对比ꎬ确认了修正后的数值方法和软件平台ꎻ最终开展Mach数和壁面温度对HyTRV边界层转捩规律的影响研究ꎮ计算结果表明ꎬ转捩区域主要集中在上表面两侧㊁下表面中心线两侧ꎻ增大来流Mach数ꎬ上下表面转捩起始位置均大幅后移ꎬ湍流区大幅缩小ꎬ但仍会存在ꎬ同时上表面层流区摩阻系数不断增大ꎬ下表面湍流区摩阻系数不断减小ꎻ升高壁面温度ꎬ上下表面转捩起始位置先前移ꎬ然后快速后移ꎬ最终湍流区先后几乎消失ꎮ关键词:转捩ꎻHyTRVꎻ摩阻ꎻMach数ꎻ壁面温度㊀㊀㊀收稿日期:2023 ̄12 ̄13ꎻ修回日期:2024 ̄01 ̄02基金项目:国家重大项目(GJXM92579)ꎻ广东省自然科学基金-面上项目(2023A1515010036)ꎻ中山大学中央高校基本科研业务费专项资金(22qntd0705)第一作者简介:章录兴(1998 )㊀男ꎬ硕士ꎬ主要研究方向为高超声速空气动力学ꎮE ̄mail:184****8082@163.com通信作者简介:张怀宝(1985 )㊀男ꎬ副教授ꎬ主要研究方向为空气动力学ꎮE ̄mail:zhanghb28@mail.sysu.edu.cn中图分类号:V211ꎻV411㊀㊀文献标志码:AAbstract:Thereisacomplextransitionphenomenonintheflowfieldofatypicalhypersonicvehicleꎬwhichhasasignifi ̄cantimpactontheperformanceofthevehicle.TheeffectsofMachnumberandwalltemperatureonthetransitionofHyTRVwerestudiedbynumericalsimulationmethods.Theself ̄developedsoftwareoftheresearchgroupwasusedtocarryoutnu ̄mericalcalculations.TherangeofMachnumberwas3~8ꎬandtherangeofwalltemperaturewas150~900K.Firstlyꎬthehypersoniccorrectionsoftheγ ̄Re~θttransitionmodelandtheSSTturbulencemodelwerecarriedout.Thepressuregradientcoefficientcorrectionandthehigh ̄speedcross ̄flowcorrectionwereintroducedintotheγ ̄Re~θttransitionmodelꎬandthecom ̄pressibilitycorrectionsoftheclosurecoefficientsβ∗andβoftheSSTturbulencemodelwerecarriedout.Thenꎬthegridin ̄dependenceverificationwascarriedoutꎬandthemodifiednumericalmethodandsoftwareplatformwereconfirmedbycom ̄paringwithexperimentalresults.FinallyꎬtheeffectsofMachnumberandwalltemperatureonthetransitionlawoftheHyTRVboundarylayerwerestudied.Theresultsshowthatthetransitionareaismainlyconcentratedonbothsidesoftheuppersurfaceandthecenterlineofthelowersurface.WiththeincreaseoftheincomingMachnumberꎬthestartingpositionoftransitionontheupperandlowersurfacesisgreatlybackwardꎬandtheturbulentzoneisgreatlyreducedꎬbutitstillex ̄ists.Atthesametimeꎬthefrictioncoefficientofthelaminarflowzoneontheuppersurfaceincreasescontinuouslyꎬandthefrictioncoefficientoftheturbulentzoneonthelowersurfacedecreases.Asthewalltemperatureincreasesꎬthestartingposi ̄tionoftransitionontheupperandlowersurfacesshiftsforwardꎬthenrapidlyshiftsbackwardꎬandfinallytheturbulentzonealmostdisappears.气体物理2024年㊀第9卷Keywords:transitionꎻHyTRVꎻfrictionꎻMachnumberꎻwalltemperature引㊀言高超声速飞行器具有突防能力强㊁打击范围广㊁响应迅速等显著优势ꎬ正逐渐成为各国空天竞争的热点[1]ꎮ高超声速飞行器边界层转捩是该类飞行器气动设计中的重要问题[2]ꎮ在边界层转捩过程中ꎬ流态由层流转变为湍流ꎬ飞行器的表面摩阻急剧增大到层流时的3~5倍ꎬ严重影响飞行器的气动性能与热防护系统ꎬ转捩还会导致飞行器壁面烧蚀㊁颤振加剧㊁飞行姿态控制难度大等一系列问题ꎬ对飞行器的飞行安全构成严重的威胁[3 ̄5]ꎬ开展高超声速飞行器边界层转捩研究具有十分重要的意义ꎮ影响边界层转捩的因素很多ꎬ例如ꎬMach数㊁Reynolds数㊁湍流强度㊁表面传导热等ꎮ在高超声速流动条件下ꎬ强激波㊁强逆压梯度㊁熵层等高超声速现象及其相互作用ꎬ会使得转捩流动的预测和研究难度进一步增大[6]ꎮ目前高超声速飞行器转捩数值模拟方法主要有直接数值模拟(DNS)㊁大涡模拟(LES)和基于Reynolds平均Navier ̄Stokes(RANS)的转捩模型方法ꎬ由于前两种计算量巨大ꎬ难以推广到工程应用ꎬ基于Reynolds平均Navier ̄Stokes的转捩模型在工程实践中应用最为广泛ꎬ其中γ ̄Re~θt转捩模型基于局部变量ꎬ与现代CFD方法良好兼容ꎬ目前已经有多项研究尝试从一般性的流动问题拓展到高超声速流动转捩模拟[6 ̄9]ꎮ目前高超声速流动转捩的研究对象主要是结构相对简单的构型ꎮMcDaniel等[10]研究了扩口直锥在高超声速流动条件下的转捩现象ꎮPapp等[11]研究了圆锥在高超声速流动条件下的转捩特性ꎮ美国和澳大利亚组织联合实施的HIFiRE计划[12]ꎬ研究了圆锥形状的HIFiRE1和椭圆锥形的HIFiRE5的转捩问题ꎮ杨云军等[13]采用数值模拟方法ꎬ分析了椭圆锥的转捩影响机制ꎬ并研究了Reynolds数对转捩特性的影响规律ꎮ另外ꎬ袁先旭等[14]于2015年成功实施了圆锥体MF ̄1航天模型飞行试验ꎮ以上对高超声速流动的转捩研究ꎬ都取得了比较理想的结果ꎬ然而所采用的模型都是圆锥㊁椭圆锥等简单几何外形ꎬ这与真实高超声速飞行器有较大差异ꎬ较难反映真实的转捩特性ꎮ为了有效促进对真实高超声速飞行器的转捩问题研究ꎬ中国空气动力研究与发展中心提出并设计了一款接近真实飞行器的升力体模型ꎬ即高超声速转捩研究飞行器(hypersonictransitionresearchvehicleꎬHyTRV)[15]ꎬ模型详细的参数见参考文献[16]ꎮHyTRV外形如图1所示ꎬ其整体外形较为复杂ꎬ不同区域发生转捩的情况也不尽相同ꎮ对HyTRV的转捩问题研究能够显著提高对真实高超声速飞行器转捩特性的认识水平ꎮLiu等[17]采用理论分析㊁数值模拟和风洞实验3种方法对HyTRV的转捩特性进行了研究ꎻ陈坚强等[15]分析了HyTRV的边界层失稳特征ꎻChen等[18]对HyTRV进行了多维线性稳定性分析ꎻQi等[19]在来流Mach数6㊁攻角0ʎ的条件下对HyTRV进行了直接数值模拟ꎻ万兵兵等[20]结合风洞实验与飞行试验ꎬ利用eN方法预测了HyTRV升力体横流区的转捩阵面形状ꎮ目前ꎬ相关研究主要集中在HyTRV的稳定性特征及转捩预测两个方面ꎬ而对若干关键参数ꎬ特别是Mach数和壁面温度对转捩的影响研究还比较少ꎮ(a)Frontview(b)Sideview㊀㊀㊀图1㊀HyTRV外形Fig.1㊀ShapeofHyTRV基于此ꎬ本文采用数值模拟方法ꎬ应用课题组自研软件开展Mach数和壁面温度对HyTRV转捩流动的影响规律研究ꎮ1㊀数值方法1.1㊀控制方程和数值方法控制方程为三维可压缩RANS方程ꎬ采用结构网格技术和有限体积方法ꎬ变量插值方法采用2阶MUSCL格式ꎬ通量计算采用低耗散的通量向量差分Roe格式ꎬ黏性项离散采用中心格式ꎬ时间推进方法采用LU ̄SGS格式ꎮ壁面采用等温㊁无滑移壁面条件ꎬ入口采用Riemann远场边界条件ꎬ出口采用零梯度外推边界条件ꎮ1.2㊀γ ̄Re~θt转捩模型γ ̄Re~θt转捩模型是Menter等[21ꎬ22]于2004年提01第2期章录兴ꎬ等:Mach数和壁面温度对HyTRV边界层转捩的影响出的一种基于拟合公式的间歇因子转捩模型ꎬ在2009年公布了完整的拟合公式及相关参数[23]ꎮ许多学者也开发了相应的程序ꎬ并进行了大量的算例验证[24 ̄28]ꎬ证明了该模型具有较好的转捩预测能力ꎬ预测精度较高ꎻ通过合适的标定ꎬγ ̄Re~θt转捩模型可以适用于多种情况下的转捩模拟ꎮ该模型构建了关于间歇因子γ的输运方程和关于转捩动量厚度Reynolds数Re~θt的输运方程ꎮ具体来说ꎬγ表示该位置是湍流流动的概率ꎬ取值范围为0<γ<1ꎮ关于γ的控制方程为Ə(ργ)Ət+Ə(ρujγ)Əxj=Pγ-Eγ+ƏƏxjμ+μtσfæèçöø÷ƏγƏxjéëêêùûúú其中ꎬPγ为生成项ꎬEγ为破坏项ꎮ关于Re~θt的输运方程为Ə(ρRe~θt)Ət+Ə(ρujRe~θt)Əxj=Pθt+ƏƏxjσθt(μ+μt)ƏRe~θtƏxjéëêêùûúú其中ꎬPθt为源项ꎬ其作用是使边界层外部的Re~θt等于Reθtꎬ定义式为Pθt=cθtρt(Reθt-Re~θt)(1.0-Fθt)Reθt采用以下经验公式Reθt=1173.51-589 428Tu+0.2196Tu2æèçöø÷F(λθ)ꎬTuɤ0.3Reθt=331.50(Tu-0.5658)-0.671F(λθ)ꎬTu>0.3ìîíïïïïF(λθ)=1+(12.986λθ+123.66λ2θ+405.689λ3θ)e-(Tu1.5)1.5ꎬ㊀λθɤ0F(λθ)=1+0.275(1-e-35.0λθ)e-(Tu0.5)ꎬλθ>0ìîíïïïï在实际计算中ꎬ通过γ ̄Re~θt转捩模型获得间歇因子ꎬ再通过间歇因子来控制SSTk ̄ω湍流模型中湍动能的生成ꎮγ ̄Re~θt转捩模型与SSTk ̄ω湍流模型耦合为Ə(ρk)Ət+Ə(ρujk)Əxj=γeffτijƏuiƏxj-min(max(γeffꎬ0.1)ꎬ1.0)ρβ∗kω+ƏƏxjμ+μtσkæèçöø÷ƏkƏxjéëêêùûúúƏ(ρω)Ət+Ə(ρujω)Əxj=γvtτijƏuiƏxj-βρω2+ƏƏxj(μ+σωμt)ƏωƏxjéëêêùûúú+2ρ(1-F1)σω21ωƏkƏxjƏωƏxj模型中具体参数定义见文献[23]ꎮ1.3㊀高超声速修正原始SST湍流模型及γ ̄Re~θt转捩模型都是基于不可压缩流动发展的ꎬ为了更好地预测高超声速流动转捩ꎬ本节引入了3种重要的高超声速修正方法ꎮ1.3.1㊀压力梯度修正压力梯度对边界层转捩的影响较大ꎬ在高Mach数情况下ꎬ边界层厚度较大ꎬ进而影响压力梯度的大小ꎬ因此在模拟高超声速流动时应该考虑Mach数对压力梯度的影响ꎮ本文采用张毅峰等[29]提出的压力梯度修正方法ꎬ具体修正形式如下λᶄθ=λθ1+γᶄ-12Maeæèçöø÷其中ꎬMae为边界层外缘Mach数ꎬγᶄ为比热比ꎮ1.3.2㊀高速横流修正在原始γ ̄Re~θt转捩模型中ꎬ没有考虑横流不稳定性对转捩的影响ꎬ对于横流模态主导的转捩ꎬ原始转捩模型计算的结果并不理想ꎮLangtry等[30]在2015年对γ ̄Re~θt转捩模型进行了低速横流修正ꎬ向星皓等[9]在Langtry低速横流修正的基础上ꎬ对高超声速椭圆锥转捩DNS数据进行了拓展ꎬ提出了高速横流转捩判据ꎬ本文直接采用向星皓提出的高速横流转捩方法ꎮLangtry将横流强度引入转捩发生动量厚度Reynolds数输运方程中Ə(ρRe~θt)Ət+Ə(ρujRe~θt)Əxj=Pθt+DSCF+ƏƏxjσθt(μ+μt)ƏRe~θtƏxjéëêêùûúú式中ꎬDSCF为横流源项ꎬLangtry低速横流修正为DSCF=cθtρtccrossflowmin(ReSCF-Re~θtꎬ0.0)Fθt2其中ꎬReSCF为低速横流判据ReSCF=θtρUlocal0.82æèçöø÷μ=-35.088lnhθtæèçöø÷+319.51+f(+ΔHcrossflow)-f(-ΔHcrossflow)其中ꎬh为壁面粗糙度高度ꎬθt为动量厚度ꎬ11气体物理2024年㊀第9卷ΔHcrossflow是横流强度抬升项ꎮ向星皓提出的高速横流转捩判据ꎬ其中高速横流源项DSCF ̄H为DSCF ̄H=cCFρmin(ReSCF ̄H-Re~θtꎬ0)FθtReSCF ̄H=CCF ̄1lnhlμ+CCF ̄2+(Hcrossflow)其中ꎬCCF ̄1=-9.618ꎬCCF ̄2=128.33ꎻlμ为粗糙度参考高度ꎬlμ=1μmꎻf(Hcrossflow)为抬升函数f(Hcrossflow)=60000.1066-ΔHcrossflow+50000(0.1066-ΔHcrossflow)2其中ꎬΔHcrossflow与Langtry低速横流修正中保持一致ꎮ1.3.3㊀SST可压缩修正高超声速流动具有强可压缩性ꎬ所以在进行高超声速计算时ꎬ应该对湍流模型进行可压缩修正ꎮSarkar[31]提出了膨胀耗散修正ꎬ对SST湍流模型中的闭合系数β∗ꎬβ进行了可压缩修正ꎬWilcox[32]在Sarkar修正的基础上考虑了可压缩生成项产生时的延迟效应ꎬ使得可压缩修正在湍流Mach数较小的近壁面关闭ꎬ在湍流Mach数较大的自由剪切层打开ꎬ本文采用Wilcox提出的可压缩性修正β∗=β∗0[1+ξ∗F(Mat)]β=β0-β∗0ξ∗F(Mat)其中ꎬβ0ꎬβ∗均为原始模型中的系数ꎬξ∗=1.5ꎮF(Mat)=[Mat-Mat0]H(Mat-Mat0)Mat0=1/4ꎬH(x)=0ꎬxɤ01ꎬx>0{其中ꎬMat=2k/a为湍流Mach数ꎬa为当地声速ꎮ2㊀网格无关性验证及数值方法确认2.1㊀网格无关性验证计算采用3套网格ꎬ考虑到HyTRV的几何对称性ꎬ生成3套半模网格ꎬ第1层网格高度为1ˑ10-6mꎬ确保y+<1ꎬ流向ˑ法向ˑ周向的网格数分别为:网格1是301ˑ201ˑ201ꎬ网格2是301ˑ301ˑ201ꎬ网格3是401ˑ381ˑ281ꎮ全模下表面如图2所示ꎬ选取y/L=0中心线和x/L=0.5处ꎬ对比3套网格的表面摩阻系数ꎬ计算结果如图3所示ꎮ采用网格1时ꎬ表面摩阻系数分布与另外两个结果存在明显差异ꎻ而采用网格2和网格3时ꎬ表面摩阻系数曲线基本重合ꎬ表明在流向㊁法向和周向均满足网格无关性ꎬ后续数值计算采用网格2ꎮ图2㊀截取位置示意图Fig.2㊀Schematicdiagramoftheinterceptionlocation(a)Surfacefrictionaty/L=0(b)Surfacefrictionatx/L=0.5图3㊀采用3套网格计算得到的摩阻对比Fig.3㊀Comparisonofthefrictiondragcalculatedusingthreesetsofgrids2.2㊀数值方法和自研软件的确认采用修正后的转捩模型对HyTRV开展计算ꎬ计算工况为Ma=6ꎬ来流温度Tɕ=97Kꎬ单位21第2期章录兴ꎬ等:Mach数和壁面温度对HyTRV边界层转捩的影响Reynolds数为Re=1.1ˑ107/mꎬ攻角α=0ʎꎬ来流湍流度FSTI=0.8%ꎬ壁面温度T=300Kꎮ为方便对比分析ꎬ计算结果与参考结果均采用上下对称形式布置ꎬ例如ꎬ图4是模型下表面计算结果与实验结果对比:对于下表面两侧转捩的起始位置ꎬ高超声速修正前的转捩位置在x=0.68m附近ꎬ高超声速修正后的计算结果与实验结果吻合良好ꎬ均在x=0.60m附近ꎬ并且湍流边界层区域形状基本一致ꎬ说明修正后的转捩模型能够较好地预测HyTRV转捩的位置ꎮ(a)Calculationofthefrictiondistribution(beforehypersoniccorrection)(b)Calculationofthefrictiondistribution(afterhypersoniccorrection)(c)Experimentalresultsoftheheatfluxdistribution[17]图4㊀下表面计算结果和实验结果对比Fig.4㊀Comparisonofthecalculatedandexperimentalresultsonthelowersurface3㊀HyTRV转捩的基本流动特性计算工况采用Ma=6ꎬ攻角α=0ʎꎬ来流湍流度FSTI=0.6%ꎬ分析HyTRV转捩的基本流动特性ꎮ从图5可以看出ꎬ模型两侧和顶端均出现高压区ꎬ高压区之间为低压区ꎬ横截面上存在周向压力梯度ꎬ流动从高压区向低压区汇集ꎬ从而在下表面中心线附近和上表面两侧腰部区域均形成流向涡结构(见图6)ꎬ沿流动方向ꎬ高压区域逐渐扩大ꎬ流向涡结构的影响范围也越大ꎮ在流向涡结构的边缘位置ꎬ壁面附近的低速流体被抬升到外壁面区域ꎬ外壁面区域的高速流体又被带入到近壁面区域ꎬ进而导致流向涡结构边缘处壁面的摩阻显著增加ꎬ最终诱发转捩ꎬ这些流动特征与文献[15]的结果一致ꎮ图7显示了上下表面摩阻的分布情况ꎬ其中上表面两侧区域在x/L=0.80附近ꎬ摩阻显著增加ꎬ出现明显的转捩现象ꎬ转捩区域分布在两侧边缘位置ꎻ而下表面两侧区域在x/L=0.75附近ꎬ也出现明显的转捩ꎬ转捩区域相对集中在中心线两侧ꎮ图5㊀不同截面位置处的压力云图Fig.5㊀Pressurecontoursatdifferentcross ̄sectionlocations图6㊀不同截面位置处的流向速度云图Fig.6㊀Streamwisevelocitycontoursatdifferentcross ̄sectionlocations31气体物理2024年㊀第9卷(a)Uppersurface㊀㊀㊀㊀㊀(b)Lowersurface图7㊀上下表面摩阻分布云图Fig.7㊀Frictioncoefficientcontoursontheupperandlowersurfaces4㊀不同Mach数对HyTRV转捩的影响保持来流湍流度FSTI=0.6%不变ꎬMach数变化范围为3~8ꎮ图8是不同Mach数条件下HyTRV上下表面的摩阻分布云图ꎬ从图中可知ꎬ随着Mach数的增加ꎬ上下表面的湍流区域均逐渐减少ꎬ其中上表面两侧转捩起始位置由x/L=0.56附近后移至x/L=0.92附近ꎬ下表面两侧转捩起始位置由x/L=0.48附近后移至x/L=0.99附近ꎬ上下表面两侧转捩起始位置均大幅后移ꎬ说明Mach数对HyTRV转捩的影响很大ꎮuppersurface㊀㊀㊀㊀㊀㊀㊀㊀㊀㊀㊀㊀㊀㊀㊀㊀lowersurface(a)Ma=3uppersurface㊀㊀㊀㊀㊀㊀㊀㊀㊀㊀㊀㊀㊀㊀㊀㊀lowersurface(b)Ma=4uppersurface㊀㊀㊀㊀㊀㊀㊀㊀㊀㊀㊀㊀㊀㊀㊀㊀lowersurface(c)Ma=541第2期章录兴ꎬ等:Mach数和壁面温度对HyTRV边界层转捩的影响uppersurface㊀㊀㊀㊀㊀㊀㊀㊀㊀㊀㊀㊀㊀㊀㊀㊀lowersurface(d)Ma=6uppersurface㊀㊀㊀㊀㊀㊀㊀㊀㊀㊀㊀㊀㊀㊀㊀㊀lowersurface(e)Ma=7uppersurface㊀㊀㊀㊀㊀㊀㊀㊀㊀㊀㊀㊀㊀㊀㊀㊀lowersurface(f)Ma=8图8㊀不同Mach数条件下摩阻系数分布云图Fig.8㊀FrictioncoefficientcontoursatdifferentMachnumbers上表面选取图7中z/L=0.12的位置ꎬ下表面选取z/L=0.10的位置进行分析ꎮ从图9中可以分析出ꎬ随着Mach数的增加ꎬ上表面转捩起始位置不断后移ꎬ当Mach数增加到7时ꎬ由于湍流区的缩小ꎬ此处位置不再发生转捩ꎬ此外ꎬMach数越高层流区摩阻系数越大ꎻ下表面转捩起始位置也不断后移ꎬ当Mach数增加到8时ꎬ此处位置不再发生转捩ꎬ此外ꎬMach数越高ꎬ湍流区的摩阻系数越小ꎬ这些结论与关于来流Mach数对转捩位置影响的普遍研究结论一致ꎮ(a)Uppersurface㊀㊀㊀㊀㊀(b)Lowersurface图9㊀不同位置摩阻系数随Mach数的变化Fig.9㊀VariationoffrictioncoefficientwithMachnumberatdifferentlocations51气体物理2024年㊀第9卷5㊀不同壁面温度对HyTRV转捩的影响保持来流湍流度FSTI=0.6%及Ma=6不变ꎬ壁面温度的变化范围为150~900Kꎮ图10是不同壁面温度条件下HyTRV上下表面的摩阻分布云图ꎬ可以看出随着壁面温度的增加ꎬ上表面两侧湍流区域先是缓慢扩大ꎬ在壁面温度为500K时湍流区域快速缩小ꎬ增加到900K时ꎬ已无明显湍流区域ꎻ下表面两侧湍流区域先是无明显变化ꎬ同样当壁面温度升高到500K时ꎬ湍流区域快速缩小ꎬ当壁面温度升高到700K时ꎬ两侧已经无明显的湍流区域ꎬ相比上表面两侧湍流区域ꎬ下表面湍流区域消失得更早ꎮ由此可以得出壁面温度对转捩的产生有较大的影响ꎬ壁面温度增加到一定程度将导致HyTRV没有明显的转捩现象ꎮuppersurface㊀㊀㊀㊀㊀㊀㊀㊀㊀㊀㊀㊀㊀㊀㊀㊀lowersurface(a)T=150Kuppersurface㊀㊀㊀㊀㊀㊀㊀㊀㊀㊀㊀㊀㊀㊀㊀㊀lowersurface(b)T=200Kuppersurface㊀㊀㊀㊀㊀㊀㊀㊀㊀㊀㊀㊀㊀㊀㊀㊀lowersurface(c)T=300Kuppersurface㊀㊀㊀㊀㊀㊀㊀㊀㊀㊀㊀㊀㊀㊀㊀㊀lowersurface(d)T=500K61第2期章录兴ꎬ等:Mach数和壁面温度对HyTRV边界层转捩的影响uppersurface㊀㊀㊀㊀㊀㊀㊀㊀㊀㊀㊀㊀㊀㊀㊀㊀lowersurface(e)T=700Kuppersurface㊀㊀㊀㊀㊀㊀㊀㊀㊀㊀㊀㊀㊀㊀㊀㊀lowersurface(f)T=900K图10㊀不同壁面温度条件下摩阻系数分布云图Fig.10㊀Frictioncoefficientcontoursatdifferentwalltemperatureconditions上表面选取z/L=0.125的位置ꎬ下表面选取z/L=0.100的位置进行分析ꎮ从图11中可以分析出ꎬ随着壁面温度的增加ꎬ上表面转捩起始位置先前移ꎬ当壁面温度增加到500K时ꎬ转捩起始位置后移ꎬ转捩区长度逐渐增加ꎬ层流区域的摩阻系数逐渐增加ꎬ当壁面温度增加到700K时ꎬ该位置已不再出现转捩ꎻ下表面转捩起始位置先小幅后移ꎬ当壁面温度增加到300K时ꎬ转捩起始位置开始后移ꎬ当壁面温度增加到700K时ꎬ由于湍流区域的减小ꎬ该位置不再发生转捩ꎮ(a)Uppersurface㊀㊀㊀㊀㊀(b)Lowersurface图11㊀不同位置摩阻系数随壁面温度的变化Fig.11㊀Variationoffrictioncoefficientwithwalltemperatureatdifferentlocations为进一步分析壁面温度的影响ꎬ本文分别在上下表面湍流区选取一点(0.9ꎬ0.029ꎬ0.14)ꎬ(0.97ꎬ-0.34ꎬ0.12)ꎬ分析边界层湍动能剖面ꎬ结果如图12所示ꎮ从图中可以看到ꎬ随着壁面温度升高ꎬ边界层厚度先略微变厚ꎬ再变薄ꎬ当壁面温度升高到700K时ꎬ边界层厚度迅速降低ꎮ这些结果与转捩位置先前移再后移的结论相符合ꎬ因为边界层厚度会影响不稳定波的时间和空间尺度ꎬ边界层厚度低时ꎬ不稳定波增长速度变慢ꎬ延迟转捩发生ꎮ需要指出的是ꎬ仅采用当前使用的方法ꎬ无法从更深层71气体物理2024年㊀第9卷次揭示转捩反转的流动机理ꎬ而须另外借助稳定性分析方法ꎬ例如ꎬ使用eN方法开展基于模态的稳定性研究ꎮ文献[33]采用该手段研究了大掠角平板钝三角翼随壁温比变化出现转捩反转的内在机理:壁温比升高促进横流模态和第1模态扰动增长ꎬ抑制第2模态发展ꎬ在第1㊁2模态联合作用影响下ꎬ出现转捩反转现象ꎮ我们将在后续开展进一步研究ꎮ(a)Uppersurface(b)Lowersurface图12㊀不同位置湍动能剖面随壁面温度的变化Fig.12㊀Variationofturbulentkineticenergywithwalltemperatureatdifferentlocations6㊀结论针对HyTRV转捩问题ꎬ在Mach数Ma=3~8ꎬ壁面温度T=150~900K的条件下ꎬ基于课题组自研软件ꎬ对γ ̄Re~θt转捩模型和SST湍流模型进行了高超声速修正ꎬ研究了Mach数和壁面温度对HyTRV转捩的影响ꎬ得出以下结论:1)经过高超声速修正后的γ ̄Re~θt转捩模型和SST湍流模型能够较为准确地预测HyTRV转捩位置ꎬ并且湍流边界层区域形状与实验结果基本一致ꎻHyTRV存在多个不同的转捩区域ꎬ上表面两侧转捩区域分布在两侧边缘位置ꎬ下表面两侧转捩区域分布在中心线两侧ꎮ2)Mach数的增加会导致上下表面转捩起始位置均大幅后移ꎬ湍流区大幅缩小ꎬ但当Mach数增加到8时ꎬ湍流区仍然存在ꎬ并没有消失ꎻ上表面层流区摩阻不断增加ꎬ下表面湍流区摩阻不断减小ꎮ3)壁面温度的增加会导致上下表面转捩起始位置先前移ꎬ再后移ꎬ这与边界层厚度变化规律一致ꎬ当壁面温度增加到700K时ꎬ下表面湍流区已经基本消失ꎬ当壁面温度增加到900K时ꎬ上表面湍流区也基本消失ꎻ上表面在层流区域的摩阻系数逐渐增大ꎬ在湍流区的摩阻系数逐渐减小ꎮ致谢㊀感谢中国空气动力研究与发展中心和空天飞行空气动力科学与技术全国重点实验室提供的HyTRV模型数据和实验数据ꎮ参考文献(References)[1]㊀OberingIIIHꎬHeinrichsRL.Missiledefenseforgreatpowerconflict:outmaneuveringtheChinathreat[J].Stra ̄tegicStudiesQuarterlyꎬ2019ꎬ3(4):37 ̄56. [2]ChengCꎬWuJHꎬZhangYLꎬetal.Aerodynamicsanddynamicstabilityofmicro ̄air ̄vehiclewithfourflappingwingsinhoveringflight[J].AdvancesinAerodynamicsꎬ2020ꎬ2(3):5.[3]BertinJJꎬCummingsRM.Fiftyyearsofhypersonics:whereweᶄvebeenꎬwhereweᶄregoing[J].ProgressinAerospaceSciencesꎬ2003ꎬ39(6/7):511 ̄536. [4]陈坚强ꎬ涂国华ꎬ张毅锋ꎬ等.高超声速边界层转捩研究现状与发展趋势[J].空气动力学学报ꎬ2017ꎬ35(3):311 ̄337.ChenJQꎬTuGHꎬZhangYFꎬetal.Hypersnonicboundarylayertransition:whatweknowꎬwhereshallwego[J].ActaAerodynamicaSinicaꎬ2017ꎬ35(3):311 ̄337(inChinese).[5]段毅ꎬ姚世勇ꎬ李思怡ꎬ等.高超声速边界层转捩的若干问题及工程应用研究进展综述[J].空气动力学学报ꎬ2020ꎬ38(2):391 ̄403.DuanYꎬYaoSYꎬLiSYꎬetal.Reviewofprogressinsomeissuesandengineeringapplicationofhypersonicboundarylayertransition[J].ActaAerodynamicaSinicaꎬ2020ꎬ38(2):391 ̄403(inChinese).[6]ZhangYFꎬZhangYRꎬChenJQꎬetal.Numericalsi ̄81第2期章录兴ꎬ等:Mach数和壁面温度对HyTRV边界层转捩的影响mulationsofhypersonicboundarylayertransitionbasedontheflowsolverchant2.0[R].AIAA2017 ̄2409ꎬ2017. [7]KrauseMꎬBehrMꎬBallmannJ.Modelingoftransitioneffectsinhypersonicintakeflowsusingacorrelation ̄basedintermittencymodel[R].AIAA2008 ̄2598ꎬ2008. [8]YiMRꎬZhaoHYꎬLeJL.Hypersonicnaturalandforcedtransitionsimulationbycorrelation ̄basedintermit ̄tency[R].AIAA2017 ̄2337ꎬ2017.[9]向星皓ꎬ张毅锋ꎬ袁先旭ꎬ等.C ̄γ ̄Reθ高超声速三维边界层转捩预测模型[J].航空学报ꎬ2021ꎬ42(9):625711.XiangXHꎬZhangYFꎬYuanXXꎬetal.C ̄γ ̄Reθmodelforhypersonicthree ̄dimensionalboundarylayertransitionprediction[J].ActaAeronauticaetAstronauticaSinicaꎬ2021ꎬ42(9):625711(inChinese).[10]McDanielRDꎬNanceRPꎬHassanHA.Transitiononsetpredictionforhigh ̄speedflow[J].JournalofSpacecraftandRocketsꎬ2000ꎬ37(3):304 ̄309.[11]PappJLꎬDashSM.Rapidengineeringapproachtomodelinghypersoniclaminar ̄to ̄turbulenttransitionalflows[J].JournalofSpacecraftandRocketsꎬ2005ꎬ42(3):467 ̄475.[12]JulianoTJꎬSchneiderSP.InstabilityandtransitionontheHIFiRE ̄5inaMach ̄6quiettunnel[R].AIAA2010 ̄5004ꎬ2010.[13]杨云军ꎬ马汉东ꎬ周伟江.高超声速流动转捩的数值研究[J].宇航学报ꎬ2006ꎬ27(1):85 ̄88.YangYJꎬMaHDꎬZhouWJ.Numericalresearchonsupersonicflowtransition[J].JournalofAstronauticsꎬ2006ꎬ27(1):85 ̄88(inChinese).[14]袁先旭ꎬ何琨ꎬ陈坚强ꎬ等.MF ̄1模型飞行试验转捩结果初步分析[J].空气动力学学报ꎬ2018ꎬ36(2):286 ̄293.YuanXXꎬHeKꎬChenJQꎬetal.PreliminarytransitionresearchanalysisofMF ̄1[J].ActaAerodynamicaSinicaꎬ2018ꎬ36(2):286 ̄293(inChinese).[15]陈坚强ꎬ涂国华ꎬ万兵兵ꎬ等.HyTRV流场特征与边界层稳定性特征分析[J].航空学报ꎬ2021ꎬ42(6):124317.ChenJQꎬTuGHꎬWanBBꎬetal.Characteristicsofflowfieldandboundary ̄layerstabilityofHyTRV[J].ActaAeronauticaetAstronauticaSinicaꎬ2021ꎬ42(6):124317(inChinese).[16]陈坚强ꎬ刘深深ꎬ刘智勇ꎬ等.用于高超声速边界层转捩研究的标模气动布局及设计方法.中国:109969374B[P].2021 ̄05 ̄18.ChenJQꎬLiuSSꎬLiuZYꎬetal.Standardmodelaero ̄dynamiclayoutanddesignmethodforhypersonicboundarylayertransitionresearch.CNꎬ109969374B[P].2021 ̄05 ̄18(inChinese).[17]LiuSSꎬYuanXXꎬLiuZYꎬetal.Designandtransitioncharacteristicsofastandardmodelforhypersonicboundarylayertransitionresearch[J].ActaMechanicaSinicaꎬ2021ꎬ37(11):1637 ̄1647.[18]ChenXꎬDongSWꎬTuGHꎬetal.Boundarylayertran ̄sitionandlinearmodalinstabilitiesofhypersonicflowoveraliftingbody[J].JournalofFluidMechanicsꎬ2022ꎬ938(408):A8.[19]QiHꎬLiXLꎬYuCPꎬetal.Directnumericalsimulationofhypersonicboundarylayertransitionoveralifting ̄bodymodelHyTRV[J].AdvancesinAerodynamicsꎬ2021ꎬ3(1):31.[20]万兵兵ꎬ陈曦ꎬ陈坚强ꎬ等.三维边界层转捩预测HyTEN软件在高超声速典型标模中的应用[J].空天技术ꎬ2023(1):150 ̄158.WanBBꎬChenXꎬChenJQꎬetal.ApplicationsofHyTENsoftwareforpredictingthree ̄dimensionalboundary ̄layertransitionintypicalhypersonicmodels[J].AerospaceTechnologyꎬ2023(1):150 ̄158(inChinese). [21]MenterFRꎬLangtryRBꎬLikkiSRꎬetal.Acorrelation ̄basedtransitionmodelusinglocalvariables PartⅠ:modelformulation[J].JournalofTurbomachineryꎬ2006ꎬ128(3):413 ̄422.[22]LangtryRBꎬMenterFRꎬLikkiSRꎬetal.Acorrelation ̄basedtransitionmodelusinglocalvariables PartⅡ:testcasesandindustrialapplications[J].JournalofTur ̄bomachineryꎬ2006ꎬ128(3):423 ̄434.[23]LangtryRBꎬMenterFR.Correlation ̄basedtransitionmodelingforunstructuredparallelizedcomputationalfluiddynamicscodes[J].AIAAJournalꎬ2009ꎬ47(12):2894 ̄2906.[24]孟德虹ꎬ张玉伦ꎬ王光学ꎬ等.γ ̄Reθ转捩模型在二维低速问题中的应用[J].航空学报ꎬ2011ꎬ32(5):792 ̄801.MengDHꎬZhangYLꎬWangGXꎬetal.Applicationofγ ̄Reθtransitionmodeltotwo ̄dimensionallowspeedflows[J].ActaAeronauticaetAstronauticaSinicaꎬ2011ꎬ32(5):792 ̄801(inChinese).[25]牟斌ꎬ江雄ꎬ肖中云ꎬ等.γ ̄Reθ转捩模型的标定与应用[J].空气动力学学报ꎬ2013ꎬ31(1):103 ̄109.MouBꎬJiangXꎬXiaoZYꎬetal.Implementationandcaliberationofγ ̄Reθtransitionmodel[J].ActaAerody ̄namicaSinicaꎬ2013ꎬ31(1):103 ̄109(inChinese). [26]郭隽ꎬ刘丽平ꎬ徐晶磊ꎬ等.γ ̄Re~θt转捩模型在跨声速涡轮叶栅中的应用[J].推进技术ꎬ2018ꎬ39(9):1994 ̄2001.91气体物理2024年㊀第9卷GuoJꎬLiuLPꎬXuJLꎬetal.Applicationofγ ̄Re~θttran ̄sitionmodelintransonicturbinecascades[J].JournalofPropulsionTechnologyꎬ2018ꎬ39(9):1994 ̄2001(inChinese).[27]郑赟ꎬ李虹杨ꎬ刘大响.γ ̄Reθ转捩模型在高超声速下的应用及分析[J].推进技术ꎬ2014ꎬ35(3):296 ̄304.ZhengYꎬLiHYꎬLiuDX.Applicationandanalysisofγ ̄Reθtransitionmodelinhypersonicflow[J].JournalofPropulsionTechnologyꎬ2014ꎬ35(3):296 ̄304(inChi ̄nese).[28]孔维萱ꎬ阎超ꎬ赵瑞.γ ̄Reθ模式应用于高速边界层转捩的研究[J].空气动力学学报ꎬ2013ꎬ31(1):120 ̄126.KongWXꎬYanCꎬZhaoR.γ ̄Reθmodelresearchforhigh ̄speedboundarylayertransition[J].ActaAerody ̄namicaSinicaꎬ2013ꎬ31(1):120 ̄126(inChinese). [29]张毅锋ꎬ何琨ꎬ张益荣ꎬ等.Menter转捩模型在高超声速流动模拟中的改进及验证[J].宇航学报ꎬ2016ꎬ37(4):397 ̄402.ZhangYFꎬHeKꎬZhangYRꎬetal.ImprovementandvalidationofMenterᶄstransitionmodelforhypersonicflowsimulation[J].JournalofAstronauticsꎬ2016ꎬ37(4):397 ̄402(inChinese).[30]LangtryRBꎬSenguptaKꎬYehDTꎬetal.Extendingtheγ ̄Reθtcorrelationbasedtransitionmodelforcrossfloweffects(Invited)[R].AIAA2015 ̄2474ꎬ2015. [31]SarkarS.Thepressure ̄dilatationcorrelationincompressi ̄bleflows[J].PhysicsofFluidsAꎬ1992ꎬ4(12):2674 ̄2682.[32]WilcoxDC.Dilatation ̄dissipationcorrectionsforadvancedturbulencemodels[J].AIAAJournalꎬ1992ꎬ30(11):2639 ̄2646.[33]马祎蕾ꎬ余平ꎬ姚世勇.壁温对钝三角翼边界层稳定性及转捩影响[J].空气动力学学报ꎬ2020ꎬ38(6):1017 ̄1026.MaYLꎬYuPꎬYaoSY.Effectofwalltemperatureonstabilityandtransitionofhypersonicboundarylayeronabluntdeltawing[J].ActaAerodynamicaSinicaꎬ2020ꎬ38(6):1017 ̄1026(inChinese).02。
Self-Clean%20Materials
Application of Titanium Dioxide Photocatalysis to Create Self-Cleaning Building Materials
Roland Benedix1 Frank Dehn2
Jana Quaas, Marko Orgass3
SUMMARY To realize self-cleaning material surfaces there are two principal ways: the de-velopment of super-hydrophobic or super-hydrophilic materials. By transferring the microstructure of selected plant surfaces to practical materials like tiles and facade paints, super-hydrophobic surfaces were obtained (Lotus effect). Super-hydrophilic materials were developed by coating glass, ceramic tiles or plastics with the semiconducting photocatalyst titanium dioxide (TiO2). If TiO2 is illumi-
nated by light, grease, dirt and organic contaminants are decomposed and can easily be swept away by water (rain). Subject of our further research is a detailed study of the interaction between TiO2 and traditional building materials like con-
仿荷叶超疏水高分子材料设计综述
仿荷叶超疏水高分子材料设计综述摘要近年来,由于超疏水表面在自清洁表面、微流体系统和生物相容性等方面的潜在应用,有关超疏水表面的研究引起了极大的关注。
本文综述了超疏水表面研究的新进展:简单介绍了表面浸润性的表征手段和影响因素,归纳了超疏水表面的制备方法和相关的理论分析,对超疏水表面研究的发展进行了展望。
关键词超疏水仿荷叶多级结构滞后接触角滚动角Summary of lotus-like super-hydrophobicpolymer materials designAbstract In the last decade, surfaces with ultra hydrophobicity have aroused much research interests owing to their potential application in self-cleaning coatings , microfluidics and biocompatible materials and so on. The recent progress in the study of superhydrophobic surface is summarized in three parts. In the first part the characterization and influences of wettability are briefly introduced ; in the second part new development of superhydrophobic surfaces is summarized from both experimental and theoretical aspects ; in the third part the prospect of the development in this field is proposed.Key words superhydrophobic ; lotus-like ; hierarchical structure ; hysteresis ; contact angle ; sliding angle1.引言我们用扫描电子显微镜观察到荷叶表面存在着微米和纳米级的双微观结构 ,即乳突形成的表面微米结构和蜡晶体形成的纳米结构[1],乳突的直径为 5~15μm ,蜡晶体特征尺度为20~500nm。
单液滴撞击超疏水冷表面的反弹及破碎行为
单液滴撞击超疏水冷表面的反弹及破碎行为李栋;王鑫;高尚文;谌通;赵孝保;陈振乾【摘要】对直径2.8 mm的液滴撞击冷表面的动态行为进行快速可视化观测,对比研究单液滴撞击普通冷表面以及超疏水冷表面的动力学特性,同时对初始撞击速度以及冷表面温度对液滴动态演化行为的影响进行了对比分析.实验结果表明:与液滴撞击普通冷表面(温度-25~-5℃)发生瞬时冻结沉积相比,液滴撞击超疏水冷表面时均未发生冻结,而且伴随铺展、回缩、反弹以及破碎行为;撞击速度越大,普通冷表面上液滴铺展因子越大,而且液滴越易冻结.液滴低速(We≤76)撞击超疏水冷表面会发生反弹现象,但速度对液滴最大铺展时间无影响;液滴高速(We≥115)撞击超疏水冷表面后会产生明显液指,而且破碎为多组卫星液滴.此外,冷表面温度仅影响液滴反弹高度,对液滴最大铺展因子以及液滴铺展时间影响较小.结果表明超疏水表面可显著抑制液滴撞击冷表面的瞬时冻结沉积.%Dynamic behavior of a single water droplet with 2.8 mm in diameter impacting on cold surface was visually observed by high speed camera, the evolutional characteristics of water droplet impacting on cold superhydrophobic and bare aluminum surfaces were comparatively studied. Besides, the effect of initial impacting velocity and cold surface temperatures on the dynamic behavior of water droplet on cold surface were analyzed. The experimental result showed that compared with the instantly freezing of water droplet impacting on cold bare aluminum surface, the water droplet impacting on cold superhydrophobic surface (-25—-5℃) can not freeze along with spreading, retraction, rebound and smash behaviors. The higher the impacting velocity is, the bigger the spreading factor is and the more easily the waterdroplet freezes on cold bare aluminum surface. Moreover, rebounding behavior can be found when droplet impacts on the superhydrophobic surface with a low speed (We≤76) and velocity has no effect on the maximum spreading time. Also, obvious droplet fingers will appear and can be fragmented into many satellite droplets as droplet impacts on cold superhydrophobic surface wit h a high speed (We≥115). In addition, cold surface temperature has obvious effect on rebounding height but has little effect on the spreading factor and spreading time. The results indicate that the superhydrophobic surface can prevent the water droplet effectively from freezing instantly as the droplet impacts on cold surface.【期刊名称】《化工学报》【年(卷),期】2017(068)006【总页数】10页(P2473-2482)【关键词】超疏水;冷表面;铺展因子;反弹;破碎;成像;动力学;数值分析【作者】李栋;王鑫;高尚文;谌通;赵孝保;陈振乾【作者单位】南京师范大学能源与机械工程学院,江苏南京 210042;江苏省能源系统过程转化与减排技术工程实验室,江苏南京 210042;南京师范大学能源与机械工程学院,江苏南京 210042;南京师范大学能源与机械工程学院,江苏南京 210042;南京师范大学能源与机械工程学院,江苏南京 210042;南京师范大学能源与机械工程学院,江苏南京 210042;江苏省能源系统过程转化与减排技术工程实验室,江苏南京210042;东南大学能源与环境学院,江苏南京 210096【正文语种】中文【中图分类】TK124液滴撞击固体冷表面现象广泛存在于制冷空调、电力通讯以及航空航天领域。
How superhydrophobicity breaks down
How superhydrophobicity breaks downPeriklis Papadopoulos,Lena Mammen,Xu Deng,Doris Vollmer1,and Hans-Jürgen ButtPhysics at Interfaces,Max Planck Institute for Polymer Research,D-55128Mainz,GermanyEdited by Pablo Gaston Debenedetti,Princeton University,Princeton,NJ,and approved January4,2013(received for review October25,2012)A droplet deposited or impacting on a superhydrophobic surface rolls off easily,leaving the surface dry and clean.This remarkable property is due to a surface structure that favors the entrainment of air cushions beneath the drop,leading to the so-called Cassie state. The Cassie state competes with the Wenzel(impaled)state,in which the liquid fully wets the substrate.To use superhydrophobicity,im-palement of the drop into the surface structure needs to be pre-vented.To understand the underlying processes,we image the impalement dynamics in three dimensions by confocal microscopy. While the drop evaporates from a pillar array,its rim recedes via stepwise depinning from the edge of the pillars.Before depinning,finger-like necks form due to adhesion of the drop at the pillar’s circumference.Once the pressure becomes too high,or the drop too small,the drop slowly impales the texture.The thickness of the air cushion decreases gradually.As soon as the water–air interface touches the substrate,complete wetting proceeds within millisec-onds.This visualization of the impalement dynamics will facilitate the development and characterization of superhydrophobic surfaces. micropillars|pinning|wetting transition|contact angle|lithography| self-cleaning|hysteresisM any surfaces in nature,including several plant leaves(1), legs of the water striders(2),and the wings of some insects (3,4)are superhydrophobic.They display apparent contact angles with water greater than150°and low contact angle hysteresis(1–4).Tilting a superhydrophobic surface by a few degrees is already sufficient for a drop to overcome adhesion,roll off,and remove dirt(1–4).This has stimulated extensive research to design arti-ficial superhydrophobic surfaces.A variety of techniques are de-veloped,often stimulated by mimicking natural surfaces(5–10). Prospective applications include self-cleaning and antifouling surfaces(1,4,6,11)and textiles(12,13),membranes for oil–water separation(14),and drag reduction in microfluidics(15).Super-hydrophobic coatings can enhance(16)or reduce(17)adsorption of cells or proteins.Minute amounts of proteins or biomolecules can be deposited on arrays of micropillars,offering promising routes to sensitive high-throughput analysis on laboratory-on-chip benches(18).Patterned superhydrophobic coatings provide new strategies to guide drops(19)or to tune drop adhesion(20). Nanocrystals can be deposited(21)and grown(22)on the tips of a micropillar arrays.For all these applications,the robustness of a coating against complete wetting is crucial.To fabricate a superhydrophobic surface,two key features are required:a low surface energy of the material and a topography with roughness on the nanoscale and microscale.In this case,air can be entrained when placing a sessile drop on top,which leads to the low adhesion.In this so-called Cassie or fakir state,the drop rests on top of the asperities of the rough substrate(Fig.1B).As proposed by Cassie and Baxter(23,24),a water drop on a partially wetted surface should adopt an apparent contact angleθapp given by the weighted sum cosθapp=f cosθ−(1−f)(15,24–27).Here, f denotes the fractional area of contact of water with the solid.θis the contact angle on aflat surface of the same material.In the following,we distinguish between the macroscopically observed apparent contact angle and the material contact angle.The ap-parent contact angle is the one observed by eye or with a low-resolution microscope.It relates to a length scale much larger than the microstructures forming the superhydrophobic layer,thus typically larger than10μm.The material contact angle is thecontact angle formed by the liquid on a smooth surface.It is de-rived by extrapolating the liquid shape on the10nm to2μm scaleto the interface.The actual materials contact angle at the contactlineθCL has to be between the advancing and receding ones:θrec≤θCL≤θadv.The Cassie state competes with the Wenzel (impaled)state,in which the drop follows the topography of thesurface and no air is entrapped(28,29).The apparent contact anglein the Wenzel state can be almost as high as the one in the Cassie state(30).However,the two wetting states differ in the contact angle hysteresis,which is much lower in the Cassie state(31).Because the Cassie state minimizes the adhesion and the roll-off angle,the term Cassie state is often used as synonym for superhydrophobicity(14). The Cassie-to-Wenzel transition can be triggered by vibrations (32),squeezing(10),impact(33),rapid deceleration(34),ap-plication of an electricfield(35),or evaporation(33,36–39). Different impalement scenarios have been discussed.For sit-uations in which inertia is negligible,the two most important ones are depinning and sagging(31,34–36,38–43).In depinning, the three phase contact line,or briefly contact line,unpins from the edge of the asperity(37).Then the contact line slides down the pillar wall,beginning the transition to a fully wetted state.In the sag mechanism,the underside of the liquid surface sags until it reaches the substrate(36).The Cassie-to-Wenzel transition takes place as soon as the lowest point of the meniscus touches the bottom surface(31,40).To simplify the discussion,we discrim-inate between the“contact line”on the microscopic and the “rim”on the macroscopic length scale.Despite well-defined model systems,the transition dynamics isstill poorly understood due to difficulties in monitoring thetemporal evolution of the air cushion and the liquid–air meniscus between the asperities with sufficient special resolution(44). Even the timescale of the impalement transition remains un-clear.So far,most detailed information was obtained by high-speed video microscopy(18,40)and scanning electron micros-copy(18,25).However,neither of these techniques provides quantitative3D information.Detailed insight in the transition dynamics would sharpen the fundamental understanding of superhydrophobicity and be constitutive to optimize the robust-ness of superhydrophobic coatings.Here,we study the Cassie-to-Wenzel transition of water drops evaporating on arrays of hy-drophobic micropillars(Fig.1A).The transition dynamics and especially the evolution of the thickness of the air cushions are monitored by laser scanning confocal microscopy(briefly con-focal microscopy).The shape of the water–air cushion interface between the pillars and up to200μm above the substrate is imaged.Thus,we can measure both the macroscopic contact angle and the variation of the microscopic angle at the pillars.By varying the geometry of the substrate,we observe the impale-ment transition in both depinning and sagging modes.Author contributions:P.P.,D.V.,and H.-J.B.designed research;P.P.performed research; L.M.and X.D.contributed new reagents;P.P.analyzed data;and P.P.,D.V.,and H.-J.B. wrote the paper.The authors declare no conflict of interest.This article is a PNAS Direct Submission.1To whom correspondence should be addressed.E-mail:vollmerd@mpip-mainz.mpg.de. This article contains supporting information online at /lookup/suppl/doi:10. 1073/pnas.1218673110/-/DCSupplemental.3254–3258|PNAS|February26,2013|vol.110|/cgi/doi/10.1073/pnas.1218673110Results and DiscussionCassie-to-Wenzel Transition.A fluorescently labeled water drop isleft to evaporate on a labeled array of poly(dimethylsiloxane)(PDMS)pillars (Fig.1).The superposition of the fluorescence and re flection images accurately depicts the morphology of the water –air and pillar –air interfaces (Fig.1C and D ).Vertical sections of a drop in the Cassie state (Fig.1C )show two well-separated horizontal re flections between neighboring pillars.They result from light re flected at the PDMS –air and air –water interfaces.The space in between (black regions)is filled with air.The height difference of the two re flections denotes the thickness of the air cushion.As water evaporates,the apparent contact angle decreases.The rim is pinned and the drop remains in the Cassie state (Fig.1E ).Only when the apparent contact angle reaches θapp =128°,the drop suddenly wets the space between the pillars (Movie S1).The absence of re flection,supported by the fluorescence images of water and PDMS,proves the complete wetting of pillars,without entrained air (Fig.1D ).The Cassie-to-Wenzel transition is accompanied by a decrease of the apparent contact angle by 3°.The rim jumped outwards so that the volume of the drop,V ,was conserved.Assuming a spherical cap shape with radius R ,the contact radius is as follows (Fig.S1):b =R sin θapp= 3V π 1=3sin θapp ðcos 3θapp −3cos θapp +2Þ1=3:A jump of θapp from 128°to 125°leads to an increase of b by 4.7%.The actual rim of the drop resembles an octagon with rounded edges (28).The maximum radius of the contact area jumps from 960to 1,000μm.This increase of 4.2%is close to the calculated value.The contact line remains pinned during further evaporation,while the contact angle decreases continuously.Sag Impalement.To analyze the kinetics of the Cassie-to-Wenzeltransition in more detail,we use microarrays with larger height and spacing between the pillars.Although PDMS pillars are frequentlyused (33),high PDMS pillars easily deform under capillary forces.Therefore,we use stiffer SU-8pillars for these experiments.Fig.2shows a typical drop in the Cassie state.Because we did not fluo-rescently label the water in this case,the surface of the drop is detected from re flections.The almost spherical drop rests on 37pillars.More than 100horizontal sections of the re flection of light vertically spaced by 0.25μm are combined in a 3D image (Fig.2B ).The mean curvature of the drop 1/R is governed by the Laplace pressure P =2γ/R ,where γ=72mN/m is the surface tension of water.Flattening of the drop by gravity is small because the radius of the drop R <1mm is much smaller than the capillary length of 2.7mm.To quantify the decreasing thickness of the air cushion h air during evaporation,we extracted contour plots of the water –air interface (Fig.2C ).The variation of h air along the main axis and the diagonal is included (Fig.2D ).The lowest height h min is lo-cated at the center of each square,whereas a saddle point is formed along the main axis.The minimum of h air along themainFig.1.Model superhydrophobic surfaces.(A )Scanning electron microscopy image of a microstructured PDMS surface.Dimensions of the pillars:center-to-center distance d =40μm,diameter a =20μm,and height h =5μm,giving f PDMS =0.2.(B )Sketch of a drop deposited on the substrate in the Cassie (Left )and Wenzel (Right )state.(C )Typical confocal microscopy image of a vertical section of a water drop rim just before and (D )just after the Cassie-to-Wenzel transition induced by evaporation.Fluorescent emission from water and PDMS is shown in cyan and yellow,respectively,and re flection in magenta.(E )Change of the apparent contact angle θapp withtime.Fig.2.Cassie-to-Wenzel transition via sagging.(A )Re flection from the wa-ter –air cushion interface (blue)of a droplet deposited on the microstructured surface composed of SU-8pillars (yellow squares)taken by confocal micros-copy.(Scale bar:400μm.)This horizontal section through the drop is taken 2μm below the pillar surface.Dimensions of the pillars are as follows:d =200μm,a =50μm,and h =23μm.(B )Three-dimensional image of the re flection of light from the SU-8–air and air –water interfaces.(Scale bar:200μm.)An arti ficial pillar is shown for comparison (Movie S2).The z axis is 5×magni fied.(Inset )SEM image of the pillars.(C )Contour plot of the thickness of the air cushion.The minimum thickness h min is located at the center between four pillars.Contour lines corresponding to h air =19,17,15,and 13μm are shown.(D )Variation of the thickness of the air cushion along the diagonal (black)and main axis (red).The two axes are marked in C .The contact angle θCL obtained from extrapolating the thickness of the air cushion to the edge of the pillars is indicated.(E )Change of h min (hollow circles)and the thickness of the water –air cushion at the three phase contact line h CL (solid circles)with time.(F )Change of θCL and (G )Laplace pressure P with time.Papadopoulos et al.PNAS |February 26,2013|vol.110|no.9|3255A P P L I E D P H Y S I C A L S C I E N C E Saxis is almost 2μm higher than the minimal height of the air cushion along the diagonal.From the respective variation of h air ,the contact angle of water at the contact line θCL can be derived (Fig.S2).It is maximal along the diagonal.This is the material contact angle,which can vary in the range θrec −908≤θCL ≤θadv according to Gibbs ’criterion,if measured from the vertical (28).In this case θCL =106°just after deposition of the drop.As evaporation proceeds,the curvature of the drop decreases and the Laplace pressure increases.The Laplace pressure of the drop is extracted from the mean curvature of the surface by fitting the water –air interface coordinates with a 2D function (Fig.S3).The water –air interface below the drop sags downward,the air cushion decreases and the contact angle θCL increases (Fig.2E and F ).The water –air interface remains pinned,because the large pillar spacing prevents θCL from exceeding the advancing mate-rial contact angle,θadv =115°(Fig.2F )(44).The evolution of the 3D shape of the water –air interface is shown in Movie S2.At the first contact of the drop with the substrate,i.e.,h min =0,the drop spontaneously wets the full surface within milliseconds.The Laplace pressure just before the transition is 250Pa.Depinning Impalement.With decreasing interpillar distance,it becomes more likely that θCL exceeds its maximum value θadv before the water –air interface touches the substrate.The snapshot in Fig.3A shows the beginning of a depinning impalement (Movie S3).Depinning does not proceed simultaneously from all pillars but depends on detailed differences of the surface structure at the edge of the pillars.During impalement,the size of the drop and accordingly the pressure hardly change.Gradually,the curvature of the water –air interface beneath the drop increases (Fig.3B and C ).Therefore,θCL varies between pillars.The contact line slides downward with an average speed of 0.5μm/s until the drop touches the bottom surface and wets the whole substrate spontaneously.This velocity corresponds to the rate at which the drop evaporates.The radius of curvature of the drop decreases at roughly 0.7μm/s close to the transition.Simulations of drop collapse showed that the drop tends to acquire an overall spherical shape,outside and inside the sub-strate,and impalement does not cause a jump of the drop rim (44).Indeed,if impalement proceeds via depinning,it does not need not to be accompanied by a jump of the rim (Fig.3B and Movie S3).According to our observations,the rim jumps if the receding angle of the Cassie state exceeds the advancing angle of the wetted (Wenzel)state,which depends on the height and shape of the pillars.Therefore,a jump of the contact line is more likely if the Cassie-to-Wenzel transition proceeds via sagging than via depinning.Contact Angle Hysteresis.Finally,we discuss whether a drop in theCassie state always shows a low contact angle hysteresis.This would imply that a surface that keeps drops in the Cassie state is superhydrophobic (37).However,even for the array with 200-μm pillar –pillar distance (Fig.2;solid fraction f =6%)the drops show a high roll-off angle of α=17°(Movie S4).The reason for the high roll-off angle becomes clear when watching the rim of a drop more closely as water evaporates (Fig.4).Immediately after de-position,the drops are almost spherical,although pinning at the edges of a few pillars is visible (Fig.4A ).As water evaporates,the drop depins stepwise from the top of the pillars (Movie S5).Tiny water droplets are left on the top of the pillars (18,21)(Movie S6).The time between successive depinning events varies be-tween <1s and 10min.When the bottom surface of the drop gets into contact with the substrate,the whole drop spontaneously undergoes a Cassie-to-Wenzel transition.The contact line jumps outward (Fig.4B and C ).Part of the air remains trapped at the backside of the pillars with respect to the flow pro file (Fig.4C Inset ).Thus,from the position of the bubbles with respect to the pillar,the first contact can be localized.The size of the bubbles continuously decreases by diffusion through the water phase until after about 10min the bubbles disappear.The images show that wetting is dominated by pinning rather than thermodynamic equilibrium.The Cassie –Baxter equation cannot be valid because the drop is in a metastable state.Choi et al.(25)suggested a modi fied Cassie –Baxter equation to cal-culate the advancing and receding contact angles.Their model is based on the calculation of the local maxima and minima of the interfacial energy.For the receding contact angles on discrete pillars,the solid areal fraction is essentially replaced by the solid line fraction.Reyssat and Quéré(45)followed a geometric ap-proach to estimate the receding contact angle,based on the equivalence of macroscopic and microscopic pinning forces.With θCL measured at each pillar by confocal microscopy,the apparent contact angle can be calculated from the following balance of forces:the macroscopic horizontal component of the interfacial force at the rim per unit length is F app ,h =γð1+cos θapp Þ(Fig.4D ).This force is made up of the force of the individual pillars.Microscopically,each pillar supports a horizontal com-ponent of the pinning force of γa cos θrec at the rear side and nearly γa at the front side (for large drops θCL ≈908;Figs.2and 3)until just before depinning.If the contact line is pinned,this leads to the following:γd ð1+cos θapp Þ=γa ðcos θrec +1Þ⇒cos θapp =aðcos θrec +1Þ−1with respect to a movement along the main axis.With d =200μm,a =50μm,and θrec =85°,we get θapp =137°.This compares well to the measured value of 135°.Our approach can take the finite size of a drop and variations of the contact line into ac-count.The horizontal pinning force per pillar is 3.9μN.Fig.3.Cassie-to-Wenzel transition via depinning.(A )Three-dimensional im-age of a fluorescently labeled water drop on an array of SU-8pillars (d =20μm,a =5μm,h =5μm,z axis is 10×magni fied).A 3D image (300×300×20μm 3)was recorded every 0.90s.For better visualization,we replace the microscopic data of the fluorescently labeled pillars by arti ficial pillars (Fig.S4).(B )The same drop after the collapse of the Cassie state.(C )Pro files of the thickness of the air cushion measured along a diagonal and passing through the center of the drop.Pro files are measured every 3s (d =40μm,a =10μm,h =23μm).(D )Change of the height of the contact line at the side walls of the two pillars marked in C :1(solid circles)and 2(hollow circles).(E )Change of the micro-scopic contact angle θCL during evaporation;position 1(solid circles)and 2(hollow circles)and (F )Laplace pressure P with time.3256|/cgi/doi/10.1073/pnas.1218673110Papadopoulos et al.This pinning force also provides an estimate for the roll-off angle α.Therefore,we compare the pinning force to the force caused by the weight when tilting the plate (45).The component of the weight of the drop parallel to the surface is F k =V ρg sin α.Setting both forces equal leads to a roll off angle αof the following:V ρg sin α=n γa ðcos θrec +1Þ⇒sin α=n γaV ρgðcos θrec +1Þ:Here,n is the numbers of pillars holding the drop.With a drop volume V =6μL,the roll-off angle is α=4°for n =1and 19°for n =5.The latter is more plausible for a drop of this size (Figs.2and 3),hinting that for larger drops the roll-off angle is affected by simultaneous depinning from several pillars.Consequently,a stable Cassie state and a high apparent contact angle do not necessarily imply a low roll-off angle and superhydrophobicity.ConclusionsWe image the collapse of the Cassie state for a series of model surfaces.By confocal microscopy,details of the impalement dy-namics are resolved.In particular,the evolution of the thickness of the air cushion can be recorded in three dimensions.Depending on the geometry,impalement can extend over several minutes.The downward velocity of the meniscus is related to the evaporation rate.When the drops recede,we observe single depinning events and the formation and the breakage of finger-like necks.Calculated apparent receding contact and roll-off angles agree well with the measured data.We expect that con-focal microscopy will become a standard technique to charac-terize superhydrophobic surfaces,because this time-resolved 3D information can be gained for every transparent substrate Materials and MethodsLithography.Microarrays consisting of flat-top cylindrical pillars made of PDMS (Fig.1A )and rectangular pillars made of SU-8photoresist (Fig.2A and B )were fabricated using lithography (SI Materials and Methods ).Both were arranged on glass in a square lattice of center-to-center distance d .Thecorresponding surface fractions are f PDMS =π4ða =d Þ2and f SU À8=ða =d Þ2.Here,a denotes the diameter (PDMS)or edge length (SU-8),respectively (Figs.1A Inset and 2A and B ).The surface of the SU-8pillars was coated with a semi fluorinated silane to decrease the surface energy.Advancing and re-ceding contact angles for water on flat parts of the surface were θadv =112±2°,θrec =70±10°on PDMS,and θadv =118±2°,θrec =85±5°on SU-8.Hy-drophobic perylenemonoimide dye (PMI)(emission maximum at λPMI =540nm)was added to un –cross-linked PDMS or SU-8(28).Water-soluble per-ylenediimide (WS-PDI)was used to dye the water because of its negligible interfacial activity.Laser Scanning Confocal Microscopy.To visualize the Cassie and Wenzel state and to record the impalement dynamics,we deposited 7-μL water drops on the micropatterned surfaces (Fig.1B ).The confocal microscope used (Leica TCS SP5II –STED CW)has five detectors with adjustable spectral regions,which allowed us to simultaneously measure fluorescence from water and PDMS or SU-8,as well as the re flected light from the interfaces (Fig.1C and D )(28).To verify that the results are not in fluenced by the dye (46,47),some measurements were repeated with pure water in re flection mode.A dry objective (40×/0.85)was used because it allows to accurately measure the optical path length in air,i.e.,the thickness of the air cushion.The image resolution was about 0.25and 1.0μm in the horizontal and vertical direc-tions,respectively,except for areas closer than about 0.1d to the edges of the pillars.The coordinates of the water –air interface are extracted by fit-ting re flection or fluorescence pro files along the z axis with a Gaussian or sigmoidal function,respectively,with accuracy better than 0.3μm.ACKNOWLEDGMENTS.We thank A.Kaltbeizel, F.Schellenberger,and J.Morsbach for technical support,and J.Yeomans,C.Sembrebon,and M.Klapper for discussions.We also thank ndfester for providing the confocal microscope.Financial support is gratefully acknowledged from Schwerpunktprogramm 1420(H.-J.B.),Deutsche Forschungsgemeinschaft Bu 1556/27(H.-J.B.),Schwerpunktprogramm 8173(D.V.),and Sonderfor-schungsbereich-TR6(P.P).1.Barthlott W,Neinhuis C (1997)Purity of the sacred lotus,or escape from contami-nation in biological surfaces.Planta 202(1):1–8.2.Gao XF,Jiang L (2004)Biophysics:Water-repellent legs of water striders.Nature 432(7013):36.3.Parker AR,Lawrence CR (2001)Water capture by a desert beetle.Nature 414(6859):33–34.4.Wagner T,Neinhuis C,Barthlott W (1996)Wettability and contaminability of insect wings as a function of their surface sculptures.Acta Zoologica 77(3):213–225.5.Feng L,et al.(2002)Super-hydrophobic surfaces:From natural to arti ficial.Adv Mater 14(24):1857–1860.6.Li X-M,Reinhoudt D,Crego-Calama M (2007)What do we need for a super-hydrophobic surface?A review on the recent progress in the preparation of super-hydrophobic surfaces.Chem Soc Rev 36(8):1350–1368.7.Feng X,Jiang L (2006)Design and creation of superwetting/antiwetting surfaces.Adv Mater 18(23):3063–3078.8.Roach P,Shirtcliffe NJ,Newton MI (2008)Progess in superhydrophobic surface de-velopment.Soft Matter 4(2):224–240.9.Xia F,Jiang L (2008)Bio-inspired,smart,multiscale interfacial materials.Adv Mater 20(15):2842–2858.10.Yao X,et al.(2010)Bioinspired ribbed nanoneedles with robust superhydrophobicity.Adv Funct Mater 20(4):656–662.11.Deng X,et al.(2011)Transparent,thermally stable and mechanically robust super-hydrophobic surfaces made from porous silica capsules.Adv Mater 23(26):2962–2965.12.Artus GRJ,Zimmermann J,Rei fler FA,Brewer SA,Seeger S (2012)A superoleophobictextile repellent towards impacting drops of alkanes.Appl Surf Sci 258(8):3835–3840.13.Zhou H,et al.(2012)Fluoroalkyl silane modi fied silicone rubber/nanoparticle composite:A super durable,robust superhydrophobic fabric coating.Adv Mater 24(18):2409–2412.14.Kota AK,Kwon G,Choi W,Mabry JM,Tuteja A (2012)Hydro-responsive membranesfor effective oil-water separation.Nat Commun 3:1025.15.Quere D (2005)Non-sticking drops.Rep Prog Phys 68(11):2495–2532.16.Shiu JY,Kuo CW,Whang WT,Chen PL (2010)Observation of enhanced cell adhesionand transfection ef ficiency on superhydrophobic b Chip 10(5):556–558.17.Koc Y,et al.(2008)Nano-scale superhydrophobicity:Suppression of protein adsorp-tion and promotion of flow-induced b Chip 8(4):582–586.18.Dufour R,et al.(2012)Zipping effect on omniphobic surfaces for controlled de-position of minute amounts of fluid or colloids.Small 8(8):1229–1236.19.Mertaniemi H,et al.(2011)Superhydrophobic tracks for low-friction,guided trans-port of water droplets.Adv Mater 23(26):2911–2914.Fig.4.Drop depinning during evaporation.(A )Superposition of trans-mission (bluish)and the re flection from the drop –air cushion interface (cyan)on SU-8pillars (yellow)(d =200μm,a =50μm,h =25μm)just after de-position.(B )Rim of the drop just before the impalement transition.(Inset )Pinning-induced necks of the drop.(C )Horizontal section recorded just after the impalement transition.(Inset )Air bubbles are visible at the backside of the pillars.(D )Macroscopic pinning force F app at the receding part of the drop rim (black arrows).Its horizontal component must be equal to the sum of horizontal components of pinning forces F p at the pillars (red arrows).It is assumed that the mean curvature of the drop is zero.Papadopoulos et al.PNAS |February 26,2013|vol.110|no.9|3257A P P L I E D P H Y S I C A L S C I E N C E S20.Hong X,Gao X,Jiang L(2007)Application of superhydrophobic surface with highadhesive force in no lost transport of superparamagnetic microdroplet.J Am Chem Soc129(6):1478–1479.21.Krumpfer JW,McCarthy TJ(2011)Dip-coating crystallization on a superhydrophobic sur-face:A million mounted crystals in a1cm2array.J Am Chem Soc133(15):5764–5766. 22.Hatton BD,Aizenberg J(2012)Writing on superhydrophobic nanopost arrays:To-pographic design for bottom-up assembly.Nano Lett12(9):4551–4557.23.Cassie ABD,Baxter S(1945)Large contact angles of plant and animal surfaces.Nature155(3923):21–22.24.Cassie ABD,Baxter S(1944)Wettability of porous surfaces.Trans Faraday Soc40:0546–0550.25.Choi W,Tuteja A,Mabry JM,Cohen RE,McKinley GH(2009)A modified Cassie-Baxterrelationship to explain contact angle hysteresis and anisotropy on non-wetting tex-tured surfaces.J Colloid Interface Sci339(1):208–216.26.Extrand CW(2004)Criteria for ultralyophobic ngmuir20(12):5013–5018.27.Extrand CW(2002)Model for contact angles and hysteresis on rough and ultraphobicngmuir18(21):7991–7999.28.Papadopoulos P,et al.(2012)Wetting on the microscale:Shape of a liquid drop ona microstructured surface at different length ngmuir28(22):8392–8398.29.Verho T,et al.(2012)Reversible switching between superhydrophobic states ona hierarchically structured surface.Proc Natl Acad Sci USA109(26):10210–10213.30.Wenzel RN(1936)Resistance of solid surfaces to wetting by water.Ind Eng Chem28(8):988–994.fuma A,QuéréD(2003)Superhydrophobic states.Nat Mater2(7):457–460.32.Bormashenko E,Pogreb R,Whyman G,Erlich M(2007)Cassie-Wenzel wetting tran-sition in vibrating drops deposited on rough surfaces:Is the dynamic Cassie-Wenzel wetting transition a2D or1D affair?Langmuir23(12):6501–6503.33.Bartolo D,et al.(2006)Bouncing or sticky droplets:Impalement transitions on su-perhydrophobic micropatterned surfaces.Europhys Lett74(2):299–305.34.Kwon H-M,Paxson AT,Varanasi KK,Patankar NA(2011)Rapid deceleration-drivenwetting transition during pendant drop deposition on superhydrophobic surfaces.Phys Rev Lett106(3):036102.35.Manukyan G,Oh JM,van den Ende D,Lammertink RGH,Mugele F(2011)Electricalswitching of wetting states on superhydrophobic surfaces:A route towards reversible Cassie-to-Wenzel transitions.Phys Rev Lett106(1):014501.36.Reyssat M,Yeomans JM,Quere D(2008)Impalement of fakir drops.Europhys Lett81(2):26006.37.Kusumaatmaja H,Blow ML,Dupuis A,Yeomans JM(2008)The collapse transition onsuperhydrophobic surfaces.Europhys Lett81(3):36003.38.McHale G,Aqil S,Shirtcliffe NJ,Newton MI,Erbil HY(2005)Analysis of dropletevaporation on a superhydrophobic ngmuir21(24):11053–11060.39.Kwon DH,Lee SJ(2012)Impact and wetting behaviors of impinging microdroplets onsuperhydrophobic textured surfaces.Appl Phys Lett100(17):171601.40.Tsai P,Lammertink RGH,Wessling M,Lohse D(2010)Evaporation-triggered wettingtransition for water droplets upon hydrophobic microstructures.Phys Rev Lett 104(11):116102.41.Dorrer C,Ruhe J(2009)Some thoughts on superhydrophobic wetting.Soft Matter5(1):51–61.42.Whyman G,Bormashenko E,Stein T(2008)The rigorous derivation of Young,Cassie-Baxter and Wenzel equations and the analysis of the contact angle hysteresis phe-nomenon.Chem Phys Lett450(4-6):355–359.43.Susarrey-Arce A,et al.(2012)Absence of an evaporation-driven wetting transition onomniphobic surfaces.Soft Matter8(38):9765–9770.44.Oliver JF,Huh C,Mason SG(1977)Resistance to spreading of liquids by sharp edges.JColloid Interface Sci59(3):568–581.45.Reyssat M,QuéréD(2009)Contact angle hysteresis generated by strong dilute de-fects.J Phys Chem B113(12):3906–3909.46.Luo C,et al.(2010)Direct three-dimensional imaging of the buried interfaces be-tween water and superhydrophobic surfaces.Angew Chem Int Ed Engl49(48): 9145–9148.47.Wu J,Zhang M,Wang X,Li S,Wen W(2011)A simple approach for local contact angledetermination on a heterogeneous ngmuir27(10):5705–5708.3258|/cgi/doi/10.1073/pnas.1218673110Papadopoulos et al.。
- 1、下载文档前请自行甄别文档内容的完整性,平台不提供额外的编辑、内容补充、找答案等附加服务。
- 2、"仅部分预览"的文档,不可在线预览部分如存在完整性等问题,可反馈申请退款(可完整预览的文档不适用该条件!)。
- 3、如文档侵犯您的权益,请联系客服反馈,我们会尽快为您处理(人工客服工作时间:9:00-18:30)。
J.Cent.South Univ.Techno1.(20 1 O)1 7:554—559 DoI:10.1007/sll771—010-0522-4
Transition of super—hydrophobic states of droplet on rough surface
YE Xia( ̄r霞) 一,ZHOU Ming( ̄明) ,JIANG Da—lin(蒋大林) ,LI Jian(1伞健) ,CAI Lan(蔡兰)
鱼Springer
1.Photonics Fabrication Science Center,Jiangsu University,Zhenjiang 212013,China; 2.School ofMechanical Engineering,Jiangsu Teachers University ofTechnology,Changzhou 213015,China
◎Central South University Press and Springer—Verlag Berlin Heidelberg 20 1 0
Abstract:Twelve samples with periodic array square pillars microstructure were prepared on the silicon wafer by plasma etching techniques.on which space b of the square pillars increased行om 5 to 60 gm.In order to study the effect of b on the wettability of the rough surface,the effects of apparent contact angle(CA)and sliding angle(a)0f the droplet on the rough surface were measured with the contact angle meter.The results show that the experimental values of CA wel1 agree with the classical wetting theory and n decreases with the increase of b.TWo drop shapes exist on the samples’surface,corresponding to the Cassie state and the Wenzel state respectively.The contact state in which a drop would settle depends typically on the size of 6.On the role of gravitation,the irreversible transition of a drop from Cassie state to Wenzel state should occur at a certain space of the square pillars.Since the transition has implications on the application of super—hydrophobic rough surfaces,theoretically,the prediction of wetting state transition on square pillar array micro—structured surfaces provides an intuitionistic guidance for the design of steady super- hydrophobic surfaces.
Key words:square pillar microstructure;wetting mode transition;apparent contact angle;sliding angle
1 IntrOductiOn Wettability is a very important property of solid surfaces for both fundamental research and practical applications.When the contact angle of a water drop on a clean solid surface is greater than 1 50。.the surface is considered to be super-hydrophobic.Super・hydrophobic surfaces play an important role in many applications,and may be used not only to resist water and fog condensation,but also to prevent contamination.So they have attracted great attention.It is wel1 known that the roughness of a hydrophobic solid surface amplifies its hydrophobicity.The contact angle(CA)of water on the flat solid surfaces is typically of the order of 100。一l20。. but reaches values as high as 1 60。tO 1 75。if fhey are rough.This is frequently seen in nature[1-3]and has been demonstrated for micro—fabricated rough surfaces [4-9].Two distinct hypotheses are classically proposed to explain this effect.One is that liquid wets the grooves of the rough surface and the roughness increases the surface area of the solid(Fig.1(a)),which geometrically enhances hydrophobicitv(Wenze1 state).The other is that air can remain trapped underneath the drop inside the roughness grooves and the drop sits partially on air (Fig.1(b)),which leads to a super-hydrophobic behaviour (Cassie state).We shal1 refer to this as the composite contact with the rough substrate. (a) Fig.1 Drop on two rough surfaces state (b) (a)Wenzel state;(b)Cassie The CA of the drop that wets the grooves is expressed by the following equation: COS 0w=rcos 0Y (1) where 0y is the intrinsic CA on a smooth surface,also known as Young’s contact angle,0w is apparent CA on a rough surface made of the same materia1.and r is the roughness factor.namely,the ratio of the actual area of a rough surface to the geometric projected area. The CA of a drop that sits on the roughness peaks is given by Cassie’s equation: COS OcB=一1+/(1+cos Oy) (2) where B is the apparent CA assuming a composite surface,and f is an area fraction of solid in contact with the liquid. MARMUR[1 0]pointed out that from the view of thermod ̄y namics the wetting state which gave the minimum apparent contact angle is the most steady state, since here the Gibbs energy completely is translated into
Foundation item:Pr0ject(5O43503O)supported by the National Natural Science foundation of China;Project supported by the Program for New Century Excellent Talents in Chinese University;Project(GzO80010)supported by the Open Research Fund Program of Jiangsu Province Key Laboratory for Photon Manufacturing Science and Technology Received date:2009—05—17;Accepted date:2009—10 26 Corresponding author:ZHOUMing,Professor;Tel:+86 5l1 88791458;Fax:+86 511 88791288;E—mail:zmlaser@126.conl