2019高中英语图表型作文写作模板+优秀范文!精品教育.doc
(完整word版)英语图表作文模板

图表描述专题训练(一)这类作文时,注意以下几点:第一,审题时,除了要把握好图表的表层信息外, 还要分析图标的深层含义,如原因、根源、可能的发展趋势等。
图表中所提供的说明文字往往是问题的切入点,一定要仔细分析。
第二,描述数据时要抓住重点,为中心服务,不必面面俱到,切忌毫无目的地罗列图表中的数据。
如果数据较多,抓住图表中的极端点(如最大或最小、最多或最少,最好或最差)和基本相同进行描述。
第三,主题句应明确,最好放在文章的开头,这样会使重点突出,主题明了。
图表范例一Students Use of Computers24681012141990199520022002Hours例文: Students Use of Computers 提纲: 1. 上图所示为某校大学生平均每周使用计算机的时间: 1990年(2 hours ), 1995年 (4 hours), 2002年 (14 hours),请描述其变化; 2. 请说明发生这些变化的原因(可从计算机的用途、价格或社会发展等方面加以说明);3. 你认为目前大学生在计算机使用中有什么困难或问题。
参考范文(1)Student Use of ComputersAs is clearly shown in the chart, the number of hours students spent on computers increased from two to four hours per week from 1990 to 1995. Especially, the number rose to about 14 hour per week in 2002.There are three factors leading to the change. To begin with, the price of computers is getting much lower than before so that many students can afford it. In addition, it is very convenient for us to study with the help of computers. For example, e-mails enable us to keep in touch with our teachers and friends. Last but not least, with fast development of the modern society, a computer has become a must for many people. To sum up, low price, convenience and wide use contribute to the increase in the use of computers.As for me, student use of computers is a double-edged sword. On the one hand, it is a good helper in searching for information, drawing pictures, etc. One the other hand, various computer games might distract students from their studies. In brief, computers can serve us well if they are used in the right way.参考范文(2)Student Use of ComputersAs is clearly shown in the chart, the average number of hours a student spent on computers increased from two to four hours per week from 1990 to 1995. Especially, the number reached approximately 14 hour per week in 2002. Why are there such great changes during these days?There are three factors leading to this phenomenon. Firstly, because of the sharp decline in the price of computers, most college students can afford one. Secondly, the Internet provides access to various kinds of information students are interested in. Finally, playing computer games or surfing online is relaxing. To sum up, low price, easy access to information and wide use make students use computers a lot.As for me, computers do bring convenience to students; however, it is no good fro students to spend too much time chatting online or playing computer games. In brief, in spite of the problems concerning the use of computers, we can’t deny that computers are of more merits than defects.Sample 1Financial Sources of College StudentsFrom the table, we can see clearly that Chinese college students and their American peers rely on different financial sources for their life and study. About 90% of Chinese students get money from their parents. In contrast, only 45% of American students resort to this way. About 40% of American students depend on part-time jobs for income, but only 5% of Chinese students do so. Scholarship is the financial source for 15% of American students, whereas only for 5% of Chinese students.There are several reasons leading to this difference. On the one hand, independence is greatly honored in American society, and students would be proud to depend on themselves. Besides, they have a more flexible schedule so they can have more time to do part-time jobs. On the other hand, some Chinese students take their parents’financial support for granted. Similarly, parents believe it’s their duty to finance their children’s educationI think with the reform in college education, this tendency in China may be changed. The widespread adoption of credit-system will give Chinese students more time and flexibility to pursue part-time jobs and get more independence from their parents. Also, with the passage of time, both the students’ and the parents’ ideas will change greatly. Thus, more and more Chinese college students are sure to rely on themselves ratherthan on their parents for finance.Sample 2Financial Sources of College StudentsAccording to the table, the number of Chinese students who get money from their parents doubles that of American ones, 45% and 90% respectively. But the percentage of American students who depend on part-time jobs is much larger than that of Chinese ones. It can also be seen clearly that scholarship is the financial source for 15% of American students, while only for 5% of Chinese students.Several factors can account for the above difference. For one thing, independence is highly honored in American society and students take great pride in self-reliance. For another, American students have a more flexible schedule so they can have more time to do part-time jobs. Another contributing factor is that both Chinese students and their parents take parents’ financial support for granted.The tendency for Chinese college students to rely on their parents for finance may be changed. The widespread adoption of credit-system will give Chinese students more time and flexibility to pursue part-time jobs and get more independence from their parents. What’s more, great changes may take place not only in the students’ ideas but also in their parents’, which, in turn, will lead Chinese students to regard it as a pride to be self-reliant.如何用英语描述图表一、图表类型基本单词图表类型:table(表格)、chart(图表)、diagram(图标)、graph(多指曲线图)、column chart(柱状图)、pie graph(饼图)、tree diagram(树形图)、饼图:pie chart、直方图或柱形图:bar chart/histogram、趋势曲线图:line chart/curve diagram、表格图:table、流程图或过程图:flow chart/sequence diagram、程序图:processing/procedures diagram二、图表描述基本词语1、描述:show、describe、illustrate、can be seen from、clear、apparent、reveal、represent2、内容:figure、statistic、number、percentage、proportion三、常用的描述句型The table/chart diagram/graph shows (that)According to the table/chart diagram/graphAs (is) shown in the table/chart diagram/graphAs can be seen from the table/chart/diagram/graph/figures,figures/statistics shows (that)……It can be seen from the figures/statisticsWe can see from the figures/statisticsIt is clear from the figures/statisticsIt is apparent from the figures/statisticstable/chart/diagram/graph figures (that) ……table/chart/diagram/graph shows/describes/illustrates四、图表中的数据(Data)具体表达法1、表示数据变化的单词或者词组rapid/rapidly 迅速的,飞快的,险峻的sharp/sharply 锐利的,明显的,急剧的gradual/gradually 渐进的,逐渐的slight/slightly 稍微的、略微地stable/stably 稳定的2、其它在描述中的常用到的词significant changes 图中一些较大变化noticeable trend 明显趋势during the same period 在同一时期in terms of/in respect of/regarding 在……方面in contrast 相反,大不相同government policy 政府政策market forces 市场力量五、图表描述套句1.the table shows the changes in the number of……over the period from……to……该表格描述了在……年之……年间……数量的变化。
2019高考英语 图表写作高分绝招专项练习
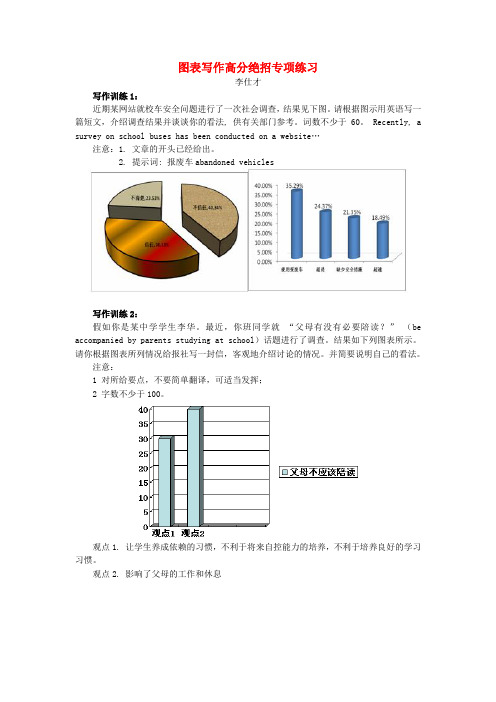
图表写作高分绝招专项练习李仕才写作训练1:近期某网站就校车安全问题进行了一次社会调查,结果见下图。
请根据图示用英语写一篇短文,介绍调查结果并谈谈你的看法, 供有关部门参考。
词数不少于60。
Recently, a survey on school buses has been conducted on a website…注意:1. 文章的开头已经给出。
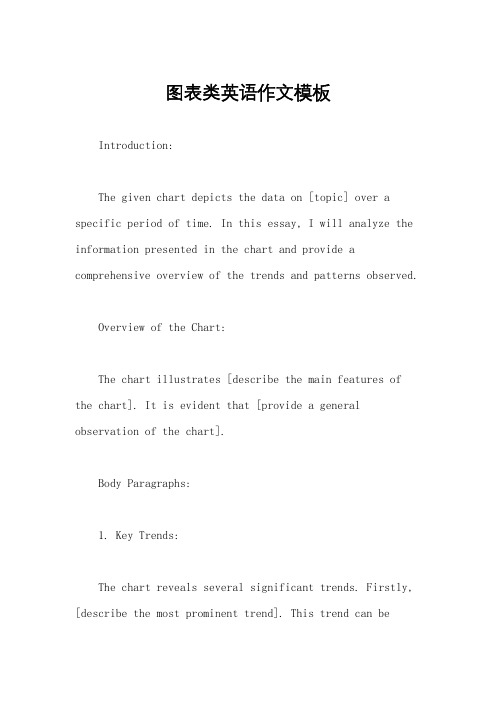
2. 提示词: 报废车abandoned vehicles写作训练2:假如你是某中学学生李华。
最近,你班同学就“父母有没有必要陪读?” (be accompanied by parents studying at school)话题进行了调查。
结果如下列图表所示。
请你根据图表所列情况给报社写一封信,客观地介绍讨论的情况。
并简要说明自己的看法。
注意:1 对所给要点,不要简单翻译,可适当发挥;2 字数不少于100。
观点1. 让学生养成依赖的习惯,不利于将来自控能力的培养,不利于培养良好的学习习惯。
观点2. 影响了父母的工作和休息观点1. 使学生腾出更多的时间专心学习,使学生身体更健康。
观点2. 帮助学生确立学习目标,独立解决困难,养成良好的学习习惯。
22图表写作高分绝招专项练习参考答案写作训练1:参考范文:Recently, a survey on school buses has been conducted on a website. As can be seen from the pie chart, only 36.13% of the interviewees trust school buses, while 40.34% of them show their distrust. 23.53% of them are not clear about it. As is shown on the bar chart, 35.29% of people, who show their disbelief, are afraid of abandoned vehicles being used and 24.37% worry that school buses are often overloaded, which can cause serious traffic accidents. About 21.35% of them worry that the school buses are not equipped with safety equipment like safety belts. Another 18.49% blame drivers for breaking the speed limit.I think effective measures should be taken to ensure the safety of students. More money should be invested to improve the quality of school buses. Meanwhile, all the school buses should be examined regularly.写作训练2:参考范文:Recently our class have had a survey on whether students should be accompanied by parents studying at school. Opinions are divided on the topic.70% of students hold the view that there is no need for parents to do so. 30% of students think they may fall into the habit of dependence, which will have a negative effect on the development of their self-control ability. And the rest worry that it will affect their parents’ work and rest.However, 30% of them are in favor of it. 13% of students believe that with parents accompanying them, they can spare more time to concentrate on their study and they will become more healthy. Furthermore, In the others’ opinion, parents can help set their study goal and overcome difficulties on their own so that students can develop a good habit of studying.In my opinion, I prefer to do everything by myself in stead of accompanied by parents, because we will make a living independently in the future.3。
图表类英语作文模板
图表类英语作文模板Introduction:The given chart depicts the data on [topic] over a specific period of time. In this essay, I will analyze the information presented in the chart and provide a comprehensive overview of the trends and patterns observed.Overview of the Chart:The chart illustrates [describe the main features of the chart]. It is evident that [provide a general observation of the chart].Body Paragraphs:1. Key Trends:The chart reveals several significant trends. Firstly, [describe the most prominent trend]. This trend can beattributed to [provide a reason or explanation]. Secondly, [describe the second most important trend]. This trend indicates [provide an interpretation]. Lastly, [describeany other noticeable trends]. These trends highlight [provide the significance of these trends].2. Comparisons and Contrasts:When comparing the different elements in the chart, itis apparent that [describe the similarities or differences]. For instance, [provide an example of a comparison or contrast]. This comparison/contrast suggests [provide an interpretation].3. Highlighting the Highest/Lowest:The chart showcases the highest/lowest [specify the category] in [specific time period]. [Provide thehighest/lowest value] was recorded during this time. This indicates [provide an interpretation].4. Fluctuations:Throughout the given time period, there weresignificant fluctuations in [specific category]. For instance, [describe the fluctuations]. These fluctuations can be attributed to [provide a reason or explanation]. It is worth noting that [provide the impact or significance of these fluctuations].5. Summarizing the Data:In conclusion, the chart provides a comprehensive overview of [topic]. The key trends identified include [mention the trends]. Comparisons and contrasts between [elements] highlight [provide the significance]. The highest/lowest [category] was recorded at [value]. Fluctuations in [specific category] were observed, which can be attributed to [reasons]. Overall, the data presented in the chart emphasizes [provide the main message or takeaway].Conclusion:In conclusion, the analysis of the given chart reveals important insights into [topic]. By examining the key trends, comparisons, fluctuations, and summarizing the data, we can gain a deeper understanding of the information presented. It is hoped that this essay has effectively conveyed the information depicted in the chart and provided a comprehensive analysis of the trends and patterns observed.。
英语图表作文万能模板

英语图表作文万能模板Introduction:The given chart presents data on [topic]. It provides a clear overview of [specific information]. In this essay, I will analyze the chart and discuss the key trends and patterns revealed by the data.Overview of the Chart:The chart illustrates [specific information]. It is divided into [number] categories, namely [category 1], [category 2], and [category 3]. The data is presented in the form of [type of chart], which allows for easy comparison and analysis.Main Trends and Patterns:1. Category 1:The first category, [category 1], shows [specific information]. It is evident from the chart that [trend 1]. This indicates that [explanation of trend 1]. Additionally, [trend 2] can be observed, suggesting [explanation of trend 2]. Overall, [category 1] experienced [overall trend].2. Category 2:Moving on to the second category, [category 2], it is noticeable that [specific information]. The chart reveals that [trend 1]. This implies that [explanation of trend 1]. Furthermore, [trend 2] is evident, indicating [explanationof trend 2]. In conclusion, [category 2] witnessed [overall trend].3. Category 3:Lastly, the third category, [category 3], exhibits [specific information]. The data illustrates that [trend 1]. This suggests that [explanation of trend 1]. Moreover, [trend 2] can be observed, which implies [explanation of trend 2]. Overall, [category 3] experienced [overall trend].Comparison and Contrast:When comparing the three categories, it is evident that [category 1] has the highest/lowest [specific information]. This indicates that [explanation]. On the other hand, [category 2] has the highest/lowest [specific information], suggesting [explanation]. Additionally, [category 3] falls in between the other two categories, indicating [explanation].Conclusion:In conclusion, the chart provides valuable insightsinto [topic]. It highlights the key trends and patterns in [category 1], [category 2], and [category 3]. The data clearly shows [specific information] in each category, allowing for a comprehensive understanding of the subject matter. Overall, the chart serves as a useful tool for analyzing and interpreting [topic].。
图表作文英语作文模板

When writing an essay based on a chart,its important to follow a structured approach that allows you to clearly and effectively convey the information presented in the chart.Here is a template you can use to write a wellorganized English essay on a chart:Introduction:Begin by introducing the chart and providing a brief overview of what it represents. State the purpose of the essay,which is to analyze the data presented in the chart.Body Paragraph1:Start by discussing the first key aspect or trend that you observe in the chart.Use specific data points to support your observations.You may want to compare or contrast different elements of the chart.Body Paragraph2:Continue with the second key aspect or trend.Again,use specific data to back up your points.Discuss any patterns or relationships between different parts of the data.Body Paragraph3:If applicable,introduce a third aspect or trend.This could be a comparison between different time periods,groups,or categories as shown in the chart.Use data to illustrate how these comparisons support your analysis.Analysis:After discussing the key points,provide an analysis of why these trends or patterns might exist.Consider external factors or underlying causes that could explain the data.Conclusion:Summarize the main points discussed in the essay.Restate the significance of the chart and its implications.End with a final thought or a call to action,if appropriate for the context of the chart.Example of a Chart Essay:Title:The Rise of Renewable EnergyIntroduction:The chart illustrates the percentage of global energy production from renewable sources between2000and2020.This essay aims to analyze the trends and discuss the implications of the shift towards renewable energy.Body Paragraph1:From2000to2020,there has been a significant increase in the use of renewable energy. In2000,only15%of the global energy was produced from renewable sources,which increased to25%by2020.This growth is attributed to advancements in technology and a growing awareness of environmental issues.Body Paragraph2:The chart also shows a decline in the reliance on fossil fuels during the same period. While coal and oil accounted for70%of the energy production in2000,their share dropped to55%by2020.This trend is likely due to the increasing cost of fossil fuels and the negative environmental impact they have.Body Paragraph3:Interestingly,the chart reveals that the adoption of renewable energy varied significantly among different regions.Europe and North America showed the most significant increase in renewable energy production,while some parts of Asia and Africa still heavily rely on fossil fuels.Analysis:The shift towards renewable energy can be attributed to several ernment policies promoting clean energy,technological advancements that have made renewable energy more efficient and costeffective,and a growing public concern for climate change are all contributing to this trend.Conclusion:In conclusion,the chart clearly demonstrates a global trend towards the increased use of renewable energy.This shift is not only beneficial for the environment but also for the longterm sustainability of energy production.It is crucial for governments and industries to continue supporting and investing in renewable energy technologies to ensure a cleaner and more sustainable future.。
高中英语图标类作文范文

高中英语图标类作文范文Today, I want to talk about the importance of incorporating visual aids, such as charts, graphs, and diagrams, in high school English essays.今天,我想谈谈在高中英语作文中加入图表、图形和图表等视觉辅助工具的重要性。
Visual aids can greatly enhance the clarity and understanding of the information presented in an English essay. When used effectively, charts and graphs can provide a clear representation of data, making it easier for the reader to comprehend the information being conveyed.视觉辅助工具可以极大地增强高中英语作文中所呈现信息的清晰度和理解度。
有效使用图表和图形可以清晰地呈现数据,从而使读者更容易理解所传达的信息。
Incorporating visual aids can also make the essay more engagingand visually appealing. By breaking up the text with visual elements,the overall presentation becomes more dynamic and interesting, capturing the reader's attention and keeping them engaged throughout the essay.加入视觉辅助工具还可以使作文更具吸引力和视觉吸引力。
高中英语图表类和图画类的英语写作模板详解
高中英语图表类和图画类的英语写作模板详解图表类和图画类是高中英语中常见的写作类型,下面是店铺给大家带来的有关于图标和图画类的写作模板的介绍,希望能够帮助到大家。
高中英语图表类和图画类的英语写作模板图表作文写作模板:The chart gives us an overall picture of the 图表主题. The first thing we notice is that 图表最大特点 . This means that as (进一步说明).We can see from the statistics given that 图表细节一 . After 动词-ing 细节一中的第一个变化, the动词-ed+幅度+时间(紧跟着的变化) . The figures also tell us that图表细节二 . Inthe column, we can see that accounts for (进一步描述).Judging from these figures, we can draw the conclusion that (结论). The reason for this, as far as I am concerned is that (给出原因). / It is high time that we (发出倡议).图画类写作模板:1.开头Look at this picture./The picture shows that.../From this picture, we can see.../As is shown in the picture.../As is seen in the picture...2.衔接句As we all know, .../As is known to all,.../It is well known that.../In my opinion,.../As far as I am concerned,.../This sight reminds me of something in my daily life.3.结尾句In conclusion.../In brief.../On the whole.../In short.../In a word.../Generally speaking.../As has been stated...高中英语高分句式的模板现象解释型模板一1.Recently,__________.(解释现象)2.What amaze us most is_________.(特征)3.It is true that_________.4.There are many reasons explaining_________.(原因)5.The main reason is________.6.What is more__________.7.Thirdly,__________.8.As a result_________.(结论)9.Considering all these,_________.(解决方案)10.For one thing,________.11.For another,_________.12.In conclusion,__________.(总结)现象解释型模板二1.As is known to all,_______.2.________seem to get accustomed to_________.3.In fact,_______.4.The reasons of________lie in several aspects.5.Firstly,________.6.Secondly,________.7.Thidly,_________.8.Finaly,_________.9.As a matter of fact,_________.10.On the one hand,_________.11.On the other hand,__________.12.Therefore,___________.现象解释型模板三1.Nowadays,_________.2.For one thing,__________.3.For another,_________.4.It is obvious__________.5.Many remarkable factors contribute to_________.6.First of all,________.7.In addition,_________.8.Thirdly,_________.9.As to me,_________.10.As we know,_________.11.Besides,__________.12.In a word,__________.现象解释型叙事类作文专用模板1.It so happened that_________.2.Just at the moment,_________.3. It impressed me most because________.4. What happened was_________.5.At first,__________.6.Almost at the same time,_________.7.What's more,___________.8.As a result,___________.9.As I understand,___________.10.On the one hand,___________.11.On the other hand,___________.12.Therefore,____________.对比选择型模板一1. Recently, we may hear quite different opinions__________.(亮出主题)2.Most people take it for granted that________.(亮出对立观点)3.However,others hold________.4.A dominant idea is that_______.5.In this view,_______.6. Nevertheless, the objectors think________.7.They argue that________.8.As to me, I prefer________.(我的观点)9.On the one hand,________.(持这种观点的原因)10.On the other hand,________.11.Therefore,_________.12.In conclusion,_________.(总结)对比选择型模板二1.There is a heated debate over_________.2.It is commonly accepted that_________.3.In contrast, others_________.4.Those who hold the first opinion suggest________.5.In their view,__________.6.However,others think__________.7.They argue that___________.8. Considering one after another, I stand on the side of_______.9.First of all,__________.10.Further more,__________.11.Thirdly,___________.12.Therefore,___________.对比选择型模板三1.Different people will offer quite different ideas________.2.Many people assert__________.3.However,others believe__________.4.Some may proclaim___________.5.They maintain such an idea because_________.6.In contrast, the objectors think__________.7.They argue that_________.8.As far as I am concerned, I agree to_________.9.First,________.st but least,________.12.In a word,_________.问题解决型模板一1.With the_______of________,________.(问题出现的背景)2.So it is of great importance for us to_________.(解决这个问题的迫切性)3.On the one hand,________.(解释问题严重的原因)4.On the other hand,_________.5.However,we have figured out many ways to________.(提出解决问题的办法)6.Firstly,________.7.So long as__________.8.Secondly,_________.9.Thirdly,_________.10.In fact,________.11.That is because________.12.In a word,_________.(总结)中考英语作文高分句型模板汇总问题解决型模板二1.There has been a discussion recently about________.2.It is true to the present situation that_________.3.But_________.4.As is known to all, there are many ways________.5.First of all,_______.6.Further more,_______.st but not least,________.8.So it is high time for us to_______.9.That is because_______.10.Secondly,_________.11.Thirdy,__________.问题解决型模板三1.Nowadays,there is a growing concern on_______.2.It is certain that________.3.However,_________.4.It well cause many serious results if_______.5.Firstly,________.6.Secondly,________.7.Finaly,________.8.In spite of all these, there are still many ways________.9.First of all,________.10.In addition,________.11.Thirdly,_________.12.Only in this way,_________.。
高中英语作文+图表作文英语作文经典范文
高中英语作文+图表作文英语作文经典范文图表作文的概念:就是用文字结合表格、数字或图画作为写作信息提示的一种写作形式。
图表作文的知识扩展1、图表作文就是用文字结合表格、数字或图画作为写作信息提示的一种写作形式。
写这类作文通常要把握以下几点:1)要认真解读图标,切勿疏漏重要数据信息和细节提示,不必每个数据都涉及,但重要数据必须提到。
2)对图表中的内容分析、数据说明一定要简明扼要,尽量使用简单句,因为复杂的句式往往起不到清晰表达的效果。
3)结论性的表达要从图表信息分析或数据归纳而来,这样才能使得语言有水浮力,切忌主观判断,更不能主观臆造。
2、常用句型:1)Here are the results of my survey.2)According to the graph, we can find…3)The chart reflects several trends.4)We can find many important changes in…5)From the diagram, we know that...图表作文的分类:图表作文可细分为表格、曲线图、柱形图和圆形图。
弄懂这四种图在写作方面的各自特点,我们才可以写好这种类型的作文:(1)表格形式要求考生对表格中所给出的大量数字进行比较分析,从中找出其变化规律。
(2)曲线图形式要求考生认真观察坐标系所显示的数据信息,并且密切注意交汇在坐标横轴和纵轴上的数字及单位。
(3)柱形图形式要求考生通过宽度相等的柱形的高度或长度差别来判断事物的动态发展趋势,因此考生应密切关注坐标线上的刻度单位及图表旁边的提示说明与文字。
(4)圆形图形式旨在要求考生准确理解并阐述一个被分割成大小不等切片的圆形图所传达的信息。
考生应清楚掌握部分与整体,部分与部分之间的相互关系,这种关系通常是以百分比的数字形式给出的。
图表类英语作文具备以下特点:1、题材涉及广泛,如人物介绍、地点介绍、新闻报道、生活话题及社会热门话题,试题设计真实性高,符合学生的认知水平,其中学校生活类题材占比例最大。
2019年高考英语 图表写作高分绝招专项练习
图表写作高分绝招专项练习李仕才写作训练1:近期某网站就校车安全问题进行了一次社会调查,结果见下图。
请根据图示用英语写一篇短文,介绍调查结果并谈谈你的看法, 供有关部门参考。
词数不少于60。
Recently, a survey on school buses has been conducted on a website…注意:1. 文章的开头已经给出。
2. 提示词: 报废车abandoned vehicles写作训练2:假如你是某中学学生李华。
最近,你班同学就“父母有没有必要陪读?” (be accompanied by parents studying at school)话题进行了调查。
结果如下列图表所示。
请你根据图表所列情况给报社写一封信,客观地介绍讨论的情况。
并简要说明自己的看法。
注意:1 对所给要点,不要简单翻译,可适当发挥;2 字数不少于100。
观点1. 让学生养成依赖的习惯,不利于将来自控能力的培养,不利于培养良好的学习习惯。
观点2. 影响了父母的工作和休息观点1. 使学生腾出更多的时间专心学习,使学生身体更健康。
观点2. 帮助学生确立学习目标,独立解决困难,养成良好的学习习惯。
图表写作高分绝招专项练习参考答案写作训练1:参考范文:Recently, a survey on school buses has been conducted on a website. As can be seen from the pie chart, only 36.13% of the interviewees trust school buses, while 40.34% of them show their distrust. 23.53% of them are not clear about it. As is shown on the bar chart, 35.29% of people, who show their disbelief, are afraid of abandoned vehicles being used and 24.37% worry that school buses are often overloaded, which can cause serious traffic accidents. About 21.35% of them worry that the school buses are not equipped with safety equipment like safety belts. Another 18.49% blame drivers for breaking the speed limit.I think effective measures should be taken to ensure the safety of students. More money should be invested to improve the quality of school buses. Meanwhile, all the school buses should be examined regularly.写作训练2:参考范文:Recently our class have had a survey on whether students should be accompanied by parents studying at school. Opinions are divided on the topic.70% of students hold the view that there is no need for parents to do so. 30% of students think they may fall into the habit of dependence, which will have a negative effect on the development of their self-control ability. And the re st worry that it will affect their parents’ work and rest.However, 30% of them are in favor of it. 13% of students believe that with parents accompanying them, they can spare more time to concentrate on their study and they will become more healthy. Furthermore, In the others’ opinion, parents can help set their study goal and overcome difficulties on their own so that students can develop a good habit of studying.In my opinion, I prefer to do everything by myself in stead of accompanied by parents, because we will make a living independently in the future.。
图表作文英文作文模板
图表作文英文作文模板Title: Effective Writing Template for Graph-Based Compositions。
Introduction:Graphs and charts serve as valuable tools for conveying complex information succinctly and persuasively. In this essay, we will explore a structured approach to crafting an effective composition based on graphical data.1. Overview of the Graph:Start by providing a brief overview of the graph or chart you are analyzing. Describe the type of graph (e.g., bar chart, pie chart, line graph) and the data it represents.2. Key Trends and Patterns:Identify and discuss the key trends and patterns evident in the graph. This could include upward or downward trends, fluctuations, outliers, or any other notable observations.3. Factors Influencing the Data:Analyze the factors that may have influenced the data presented in the graph. Consider economic, social, political, or environmental factors that could explain the trends depicted.4. Comparisons and Contrasts:Make comparisons or contrasts between different elements or categories within the graph. This could involve comparing different time periods, demographic groups, geographical regions, etc.5. Implications and Insights:Discuss the implications of the data presented inthe graph. What do the trends and patterns suggest about the topic being studied? What insights can be gained from the data?6. Possible Causes and Effects:Explore possible causes and effects related to the trends depicted in the graph. This could involve discussing causal relationships, correlations, or potential consequences of the observed trends.7. Alternative Perspectives:Consider alternative interpretations of the data presented in the graph. How might different stakeholders or experts interpret the data differently? Discuss any conflicting viewpoints or interpretations.8. Conclusion:Summarize the key findings and insights derived from analyzing the graph. Restate the significance of the trendsidentified and their implications for the topic under study.By following this structured approach, you caneffectively analyze and discuss graphical data in your compositions. Remember to support your analysis with evidence from the graph and to maintain clarity and coherence throughout your writing.。
- 1、下载文档前请自行甄别文档内容的完整性,平台不提供额外的编辑、内容补充、找答案等附加服务。
- 2、"仅部分预览"的文档,不可在线预览部分如存在完整性等问题,可反馈申请退款(可完整预览的文档不适用该条件!)。
- 3、如文档侵犯您的权益,请联系客服反馈,我们会尽快为您处理(人工客服工作时间:9:00-18:30)。
第 1 页 高中英语图表型作文写作模板+优秀范文! 图表型作文通常用图片、表格的方式反映出某一问题、现象或观点,该类作文要求考生首先对图表进行简单表述,然后点题并加以论证说明。这几年高考英语作文通常以书信类应用文为载体,而不常考的图表型作文反而容易被大家忽略,一旦考到,措手不及,今天小简老师就为大家分享高中英语图表型作文的写作模板,希望大家仔细阅读记忆。 图表作文是高中英语作文中较常见的类型,要求学生通过图中数据和提示内容写一短文,属于比较、对照类。也可根据提示写为议论文。通常我们采取三段式写法: 第一段:描述图表,得出结论。 第二段:紧扣主题,根据图表比较分析原因,论证结论。 第三段:发表议论,提出自己的看法。 必会词汇: 表格(table)、柱形图(bar chart)、 饼状图(pie chart)和折线图(diagram) 常用句式: 1.As can be seen from/in the chart/diagram/table/graph... 从表格/图形中我们可以看到…… 第 2 页
2.According to /As is shown in the Table /Figure/Chart...如表格/图表中显示…… 3.It can be seen from the chart/diagram/table/graph/figures/statistics that... 从表格/图表/数据中我们可以看到…… 4.From the table/figures/data/results/information above, it can/may be seen/concluded/shown/estimated/calculated/inferred that... 从以上的表格/图表/数据/结果/信息中,我们可以看到/总结/预测/计算/得出…… 5.The table shows the changes in the number of...over the period from...to... 该表格描述了在……年之……年间……数量的变化。 6.As can be seen from the graph, the two curves show the fluctuation of...如图所示,两条曲线描述了……的波动情况。 7.The pie charts show the changes on... in some place in 2019. 此饼形图显示了2019年一些地方……的变化。 8.The table shows a three times increase over that of last year. 表格显示比去年上升了3倍。 The number is 5 times as much as that of... 此数字是……的5倍。 第 3 页
9.It has increased by three times as compared with that of ... 同……相比,增长了3倍。 10.The figure of A is about twice as much as that of B. A的数字是B的两倍。 11.A has the highest sales figure in the three departments, followed by B and C. 在3个部门中,A的销售额最高,其次是B和C。 12.The rise lasted for two weeks and then began to level off in August. 上升两个星期后,8月份开始平稳。 13.It accounts for 30% of the total population. 占到总人口的30%。 14.The number of students has reached 500, indicating a rise of 20%, compared to last semester. 学生人数达到500人,与上个学期相比上升了20%。 15.It picked up speed at the end of this month. 这个月底加快了速度。 16.from this year on,there was a gradual declined reduction in the..., reaching a figure of... 从这年起,……逐渐下降至…… 17.There are a lot of similarities/differences between...and... ……与……之间有许多相似(不同)之处 第 4 页
18.It can be drawn from the chart that the proportions of A and B are going down, though the falling level of the latter is a lot lower/higher than that of the former. 尽管B的下降速度比A要慢/快,从表中我们可以看到A和B的比例都在下降。 19.The increase/decrease is more noticeable during the second half of the 5year period. 在5年期限的后半段,增长/降低比较明显。 20.It falls from 50% in 2019 to 30% in 2019, and then the trend reverse, finishing at 58% in 2019. 从2019年的50%降到2019年的30%,然后形势逆转,2019年达到了58%。 高中英语作文图表作文万能模板: As is shown by the figure/percentage in the table /picture,____ has been on rise/ decrease, significantly/dramatically rising/decreasing from ____ in _____ to _____ in _____. From the sharp rise/decline in the chart, it goes without saying that _____. There are at least two good reasons accounting for _____. In one hand, ____.In the other hand, _____ is due to the fact that ______.In addition, ______ is responsible for _____. Maybe there are some other 第 5 页
reasons to show ______.But it is generally believed that the above mentioned reasons are commonly convincing. As far as I am concerned, I hold the point of view that _______. I am sure my opinion is both sound and well-grounded. 范文(一) A recent survey analyzed the change in number of film-goers and TV watchers in X city. As is shown by the graph, there has been a sharp decline in the number of film-goers during the period from 1992 to 2019, adding up to 20,000 in 2019. On the other hand, the number of TV watchers has steadily increase in the last decade, reaching 150,000 in 2019. Finally, it is interesting to note that there were as many film-goers as TV watchers in year 2019. There might be two reasons, I think, for the change. Firstly, TV is not only a convenient source of entertainment, but a comparatively cheap one. There is no point in arranging transport. And one needn’t pay for expensive seats at the cinema. Secondly, TV makes it possible for one to keep track of current events and 第 6 页
the latest developments in science and technology. As a consequence, most people prefer to stay at home, watching TV, rather than go out to the cinema, which wastes both time and money. Personally, there are still a lot of people who enjoy watching films. They argue that the film is a fascinating form of art. Sitting comfortably in the cinema, one can appreciate the latest movies, which will usually be shown on TV far later on. Therefore, I trust the number of film-goers will be on the rise in the future. 范文(二): What is shown in the table above indicates that dramatic changes have taken place in the daily expenses in Xi’an from 2019 to 2019. The expenses on food have declined by 30% while those on clothing and recreation have increased respectively by 9% and 7%. There are two factors accounting for these changes. In the first place, the risen income resulting from economic growth plays a vital role in the less expense on food. In the second place, when food presents no