历届数学建模优秀论文
全国大学生数学建模优秀论文(A题) 国家一等奖
地下储油罐的变位分析与罐容表标定摘要加油站地下储油罐在使用一段时间后,由于地基变形等原因会发生纵向倾斜及横向偏转,导致与之配套的“油位计量管理系统”受到影响,必须重新标定罐容表。
本文即针对储油罐的变位时罐容表标定的问题建立了相应的数学模型。
首先从简单的小椭圆型储油罐入手,研究变位对罐容表的影响。
在无变位、纵向变位的情况下分别建立空间直角坐标系,在忽略罐壁厚度等细微影响下,运用积分的方法求出储油量和测量油位高度的关系。
将计算结果与实际测量数据在同一个坐标系中作图,经计算得误差均保持在3.5%以内。
纵向变位中,要分三种情况来进行求解,然后将三段的结果综合在一起与变位前作比较,可以得到变位对罐容表的影响。
通过计算,具体列表给出了罐体变位后油位高度间隔为1cm 的罐容表标定值。
进一步考虑实际储油罐,两端为球冠体顶。
把储油罐分成中间的圆柱体和两边的球冠体分别求解。
中间的圆柱体求解类似于第一问,要分为三种情况。
在计算球冠内储油量时为简化计算,将其内油面看做垂直于圆柱底面。
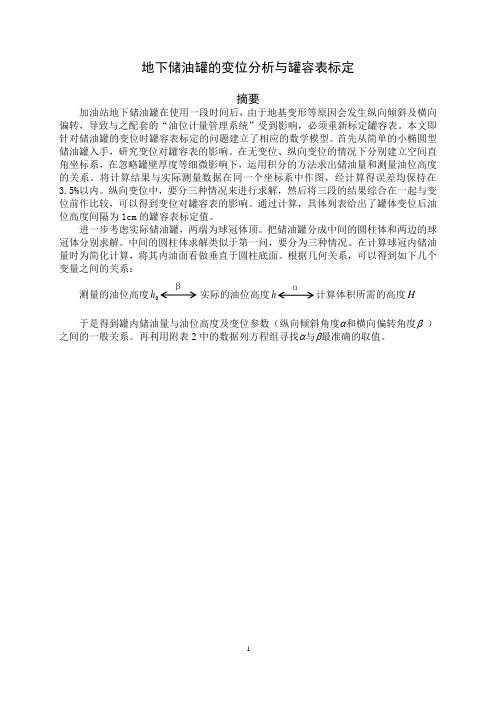
根据几何关系,可以得到如下几个变量之间的关系:测量的油位高度0h 实际的油位高度h 计算体积所需的高度H于是得到罐内储油量与油位高度及变位参数(纵向倾斜角度α和横向偏转角度β )之间的一般关系。
再利用附表2中的数据列方程组寻找α与β最准确的取值。
αβ一、问题重述通常加油站都有若干个储存燃油的地下储油罐,并且一般都有与之配套的“油位计量管理系统”,采用流量计和油位计来测量进/出油量与罐内油位高度等数据,通过预先标定的罐容表(即罐内油位高度与储油量的对应关系)进行实时计算,以得到罐内油位高度和储油量的变化情况。
许多储油罐在使用一段时间后,由于地基变形等原因,使罐体的位置会发生纵向倾斜和横向偏转等变化(以下称为变位),从而导致罐容表发生改变。
按照有关规定,需要定期对罐容表进行重新标定。
题目给出了一种典型的储油罐尺寸及形状示意图,其主体为圆柱体,两端为球冠体。
数学建模优秀论文范文

数学建模优秀论文范文2017数学建模优秀论文范文1各位老师,下午好! 我叫XXX,是20xx级**班的学生,我的论文题目是《数学建模教学培养高中生创造性思维能力的实验研究》,论文是在钟育彬导师的悉心指点下完成的,在这里我向我的导师表示深深的谢意,向各位老师不辞辛苦参加我的论文答辩表示衷心的感谢,并对三年来我有机会聆听教诲的各位老师表示由衷的敬意。
下面我将本论文设计的目的和主要内容向各位老师作一汇报,恳请各位老师批评指导。
首先,我想谈谈这个毕业论文设计的目的及意义。
在数学教学中培养学生的创造性思维能力是必要的和必需的。
如何在数学教学中培养学生的创造性思维能力,是数学教育的重大课题。
培养与训练学生的创造性思维能力并不是高不可攀的,而是能够在数学教学中脚踏实地做好的。
数学教学中培养学生的创造性思维能力可以让学生凭借数学专业领域的知识经验,不断深化与发展,逐渐有量变到质变,向较深层次跳跃,以便为以后的发展打好基础。
数学建模法是研究数学的基本方法之一,数学模型的建构自身就是一个创新的过程,进行数学建模教学不仅能够使学生构建数学知识基础,更是让学生进行创造性思维培养的重要途径和手段,是培养学生创造性思维能力的重要方法,对学生形成数学素养具有重要作用。
数学建模成为培养学生创造性思维能力的有效途径之一。
事实上,我国的一些教育工作者在这一领域已经做了初步的研究工作,但是这些研究大多局限于理论的探讨,而对于数学建模与创造性思维能力的关系,特别是如何通过数学建模教学培养高中生的创造性思维能力方面的研究还很少,并且大都不够深入,不够系统,研究结论缺少实证研究的有力支持。
本文尝试开展实验研究去探讨数学建模与高中生创造性思维能力之间的关系,并做出假设:数学建模教学有利于培养高中生的创造性思维能力。
本文通过验证假设目的是证明数学建模教学培养高中生创造性思维能力的有效性,从而给广大高中数学教师一定的教学启示,推动他们积极开展数学建模教学,培养学生的创造性思维能力,为加快培养创造性人才做出贡献。
数学建模全国一等奖论文系列(27)

数学建模全国⼀等奖论⽂系列(27)乘公交,看奥运摘要由于可供选择的车次很多,各种车辆的换乘⽅式也很多,为了避免上下⾏站点不⼀样的车次等对路线产⽣的影响,我们以由易到难的思路来完成模型。
⾸先分析⼀辆车可以直接到达的情况,在这其中⼜考虑到环线的特殊性对其单独进⾏判断讨论;由于⼀辆车可使乘客到达⽬的地的可能性太⼩,我们接下来讨论要进⾏⼀次换乘的情况,在这⾥巧妙地利⽤矩阵来判断两辆车是否含有共同站这个思想,避免了⾄少两重循环,使运算速度⼤⼤提⾼;虽然这样就已经能够解决不少的问题,但并不完全,因此我们继续计算换乘两次的乘车路线,经过⼤量的运算,我们发现基本所有的站点间都可以通过换乘两次到达,⾄此对公交线路的讨论基本完成。
对加⼊地铁的讨论与只有公交车时类似,从最简单的两辆地铁换乘的情况开始考虑,由浅⼊深。
论⽂中并没有运⽤⼤量的符号,⽽是⽤⽂字来说明程序的主要步骤,这样可以让不了解程序的读者也清楚地知道模型的思路,⽽且,只要知道起始与终点,利⽤程序就可以计算所有可能路线,并可以在结果中为读者提供路线的相关信息,⽐如路费及所需时间,以供选择。
对于最优的解释,我们除了以时间最少、车费最省为原则,还对时间与车费进⾏了加权平均,⽽权数便是乘客对时间与⾦钱的偏好程度,当输⼊⾃⼰愿⽤1元钱去换多少分钟乘车时间时,程序会根据个⼈的不同喜好,来选择出适合每个⼈的最优路线。
这样将程序⼈性化,可以更符合实际中⼈们的需要。
关键词:公交线路选择最优化矩阵加权平均数组分类讨论⾃主查询问题重述北京是中国的⾸都,是政治、⽂化中⼼,同时也是国际交往的中⼼。
在成功取得2008年第29届夏季奥运会的举办权后,北京市城市建设的步伐将进⼀步加快。
众所周知,可靠的交通保障是成功举办奥运会的关键之⼀,公共客运交通服务系统尤为重要。
在保持公车票价⼀直相对较低的情况下,北京市⼜已经实⾏机动车单双号出⾏,⽬的就是为了⿎励⼈们乘公共汽车出⾏,缓解交通阻塞状况。
数学建模优秀论文

(数学建模B题)北京水资源短缺风险综合评价参赛队员:甘霖(20093133,数学科学学院)李爽(20093123,数学科学学院)崔骁鹏(20091292,计算机科学学院)参赛时间:2011年4月30 - 5月13日承诺书我们仔细阅读了中国大学生数学建模竞赛的竞赛规则. 我们完全明白,在竞赛开始后参赛队员不能以任何方式(包括电话、电子邮件、网上咨询等)与队外的任何人(包括指导教师)研究、讨论与赛题有关的问题。
我们知道,抄袭别人的成果是违反竞赛规则的, 如果引用别人的成果或其他公开的资料(包括网上查到的资料),必须按照规定的参考文献的表述方式在正文引用处和参考文献中明确列出。
我们郑重承诺,严格遵守竞赛规则,以保证竞赛的公正、公平性。
如有违反竞赛规则的行为,我们将受到严肃处理。
我们参赛选择的题号是(从A/B/C/D 中选择一项填写):B所属学校(请填写完整的全名):黑龙江大学参赛队员:1.甘霖2、李爽3、崔骁鹏日期:2011 年5月12日目录1.摘要 -----------------------------------------42.关键词 ---------------------------------------43.问题重述 ---------------------------------------54.模型的条件和假设 ------------------------------55.符号说明 --------------------------------------56.问题的分析及模型的建立 ------------------------66.1问题一的分析与求解 -----------------------66.2问题二的分析与求解 -----------------------106.3问题三的分析与求解 -----------------------186.4问题死的求解 -----------------------------217.模型的评价 ------------------------------------238.参考文献 --------------------------------------239.附录 ------------------------------------------23北京水资源短缺风险综合评价甘霖﹑李爽﹑崔骁鹏【摘要】本文针对水资源短缺风险问题求出主要风险因子,并建立了水资源短缺风险评价模型,以北京为实例,做出了北京1979年到2009年的水资源短缺风险的综合风险评价,划分出了风险等级,以评价水资源短缺风险的程度。
数学建模优秀论文

数学建模优秀论文随着科技的发展,数学建模在各个领域中得到了广泛的应用。
而优秀的数学建模论文不仅仅在数学模型的建立上达到了较高的水平,还在问题分析、解决方法和应用上展现出了创新和实用价值。
下面我将介绍一篇优秀的数学建模论文。
这篇论文是以“城市交通拥堵问题”为主题展开的。
作者首先从问题分析的角度出发,对城市交通拥堵问题进行了全面而深入的研究。
通过对城市交通状况的调查和分析,作者发现了交通拥堵的原因和特点,并进一步阐述了交通拥堵对城市发展造成的负面影响。
随后,作者提出了一个基于模拟算法的数学模型,即通过在城市中随机选取一定数量的车辆,并对其运行轨迹进行模拟,从而得到城市交通拥堵程度的评估指标。
在模型的建立过程中,作者细致入微地考虑了车辆的起点和终点、驾驶习惯、交通信号灯等因素,并合理选择了模拟算法以保证模型的准确性和稳定性。
在模型的验证和应用中,作者将其应用于某个城市的实际交通数据中,并与其他常用的方法进行了比较。
结果表明,作者所提出的模型在评估交通拥堵程度方面具有较高的准确性和实用价值。
同时,作者还进一步分析了交通拥堵的空间和时间分布规律,以及影响交通拥堵的主要因素,并提出了一些改进措施和建议。
这篇论文的优点在于:首先,作者对城市交通拥堵问题进行了全面而深入的研究,从而在问题分析上得到了充分的展示。
其次,作者所提出的数学模型结合了实际数据和模拟算法,既保证了模型的准确性和稳定性,又保证了模型的实际应用价值。
最后,作者通过对模型的验证和应用,进一步分析了交通拥堵的规律和影响因素,为城市交通管理提供了一定的参考和帮助。
总而言之,这篇论文在数学建模领域中具有较高的水平和实用价值。
通过对城市交通拥堵问题的全面研究和合理建模,作者成功地解决了该问题,并为城市交通管理提供了一些新的思路和方法。
因此,可以说这篇论文是一篇优秀的数学建模论文。
08--历年数学建模优秀论文大全

Can We Assess a Health Care System's Performance?参赛队员:董希望(自动化学院),刘琳燕(城环学院)刘福亮(软件学院)指导教师:肖 剑参赛单位:重庆大学参赛时间:2008年2月15∼18日Can We Assess a Health Care System's Performance?1.BackgroundHealth systems consist of all the people and actions whose primary purpose is to improve health. They may be integrated and centrally directed, but often they are not. After centuries as small-scale, largely private or charitable, mostly ineffectual entities, they have grown explosively in this century as knowledge has been gained and applied. They have contributed enormously to better health, but their contribution could be greater still, especially for the poor. Failure to achieve that potential is due more to systemic failings than to technical limitations. It is therefore urgent to assess current performance and to judge how health systems can reach their potential.The World Health Organization (WHO) is a specialized agency of the United Nations (UN) that acts as a coordinating authority on international public health. Established on 7 April 1948, and headquartered in Geneva, Switzerland, the agency inherited the mandate and resources of its predecessor, the Health Organization, which had been an agency of the League of Nations.The WHO's constitution states that its objective "is the attainment by all peoples of the highest possible level of health." Its major task is to combat disease, especially key infectious diseases, and to promote the general health of the people of the world.As well as coordinating international efforts to monitor outbreaks of infectious diseases, such as SARS, malaria, and AIDS, the WHO also sponsors programs to prevent and treat such diseases. The WHO supports the development and distribution of safe and effective vaccines, pharmaceutical diagnostics, and drugs. The WHO also carries out various health-related campaigns — for example, to boost the consumption of fruits and vegetables worldwide and to discourage tobacco use.The annual World Health Report (http://www.who.int/whr/en/index.html) assesses global health factors and World Health Statistics provides health statistics for the countries in the UN. The production and dissemination of health statistics is a major function of the WHO. To many people, these data and the associated analyses are considered unbiased and very valuable to the world community.2. Basic Assumption and Hypotheses1.Assume that in a certain interval such as 5years the main components (metrics) ofthe health care system stays steady, that is to say the metric won’t change continually.2.Assume that all the statistics we get from the database of the WHO is authentic.3.Assume that the ranking of the world's health systems in 2000 made by WHO isscientific and dependable.4.During the data processing if a data little than x we can replace it with x.5.If there existing data missing for some year’s indicator we can value it with thecorresponding value of the near years.3. SymbolsSymbol Definition and Property'Z The matrix before standardizationZ The matrix after standardizationz j The statistic of the j indicator to each countryu The main component to be evaluatedu m The m th main component of the indicatorl ij The load of the original indicatorR1 The correlation matrix of Zc i The contribution rate of the i th main componentS i The summation of the front i main components’ contribution rateQ The integrated score of each countryX The project set ( the Member States)U The attribute set which also means main component seta ij The attribute value of x i in reference to u jA The decision making matrixa i The mean value of the line I in the primitive matrixb i The standard deviation of row I in the primitive matrix4. Problem AnalysisTo determine several important and viable metrics for assessing the performance of a health care system and comparing health care systems in different countries. We have to know what metrics or indicators are there in a health care system, as is shown in the problem we search the web of the WHO and get the database of the indicators. There exists statistics for 50 core indicators on mortality, morbidity, risk factors, service coverage, and health systems, which take on more than one hundred and fifty terms of raw indicators. We must use some data mining technology or method to distill the crucial metrics.Considering the data is promiscuous and inconsistent and not all the countries have the corresponding data to each indicator from the year 1960 to 2006, we first need to choose certain year’s data as our study object. Then to the mass actual statistical data we can’t expect all the indicators are complete so what to do with the incomplete data to make sure that all the indicators or all the data we used below are universal or effective is an inevitable problem. There are 159 raw indicators how could we select the most important ones and combine them scientifically to make them more useful in measuring quality is another basal problem. Then how could we accomplish this goal? The main components analysis method which we could use to devise our first model will help a lot.Furthermore how could we assess a country’s health care system and make some comparisons with the combined metrics? This situation much agrees with the multiple attribute decision problems. So we could solve this problem by ranking all the countries health care systems using this multiple attribute decision method.5. The Establishment of Model5.1 The Primary Data and Indicators ProcessingAccording to the above problem analysis part we know that we could obtain enough raw data for almost 159 indicators from 1960 to 2006. We first choose a year 2004 whose data is much completer than other years as our study object. Then if some of the indicators of certain country in 2004 have no value and the year close to 2004 such as the year of 2005 or 2003 has the corresponding value we treat this close value as the valve of the country in that indicator in 2004.Based on these we select the indicators that 95% of the country has the corresponding data for them from all the 159 raw indicators. By doing this primary selection we make sure that all the indicators or all the data we used below are universal or effective. After the primary selection we get 48 crucial indicators as our primary outcomes (metrics).5.2 Model 1 DesignFollowing the above analysis we utilize the main components analysis method to devise our first model.When it comes to main components analysis the biggest effect to it is the dimension of the data. So in the practical application we first should make standardization to the data.Assume that 'Z is the matrix before standardization Z is the matrix after standardization z j is the statistic of the j indicator to each country; u is the main component to be evaluated, so the objective function could be:11111221221122221122p p p p m m m mp p u l z l z l z u l z l z l z u l z l z l z =++⎧⎪=++⎪⎨⎪⎪=++⎩""""""" (1)Where u 1, u 2,… u m is called the 1st, 2nd, … mth main component of the indicator z 1, z 2, z p ; l ij is the load of the original indicator z j (j=1,2, …,p) in each main component.The detailed process of this solution is as follows:Step1: Evaluate the standardized matrix Z of the matrix'Z The standardization of the 'Z is just replace the (i=1,2, …,p) and the z 'i z ijof the matrix 'Z with z i (i=1,2, …,p) and with z ij respectively, which is shown in table1Step 2: Evaluate the correlation matrix R1 of matrix ZR1 could be evaluated by the following matrix:1112121222121p p p p pp r r r r r r R r r r ⎡⎤⎢⎥⎢=⎢⎢⎥⎢⎥⎣⎦""##"#"⎥⎥ (2) Where r ij (i, j =1, 2,…,p) is the original indicator z i and z j ’s correlation coefficient specially r ij =r ji . r ij could be derived by the following formula:ij r = (3) Step 3: By formula 1 we can compute the characteristic root and characteristic vector of matrix R1 then rank the characteristic values of R1 as expression 110I R λ−= (4)(5)0≥≥≥≥λλλ"p 21Step 4: Evaluate the contribution rate and the accumulative contribution rate according to formula 1and 1of the main components, determine the proper number of the main components.(6) λ∑==="1(1,2,,i i p k k c i λ)pWhere is the contribution rate of the i th main component.i c(7) S i λ∑p λ====∑"11(1,2,,)i k k i p k k Here is the summation of the front i main components’ contribution rate. If thevalue of the accumulative contribution rate reaches to more than 80% we can approbate the effect of the main components.i S Step 5: Compute the load of the main component l ij(y ,z )(,1,2,,)ij i j ij l p i j p ===" (8)Step 6: Sum up the above five steps get our objective function11111221221122221122............p p p p m m m mp u l z l z l z u l z l z l z u l z l z l z =+++⎧⎪=+++⎪⎨⎪⎪=+++⎩"""p Step 7: Evaluate the integrated value of each country and make a ranking of them with the formula 1.112211(m m m ii )u u λλλλ==+++∑"Q u (9) Q is the integrated score of each country.5.3 Model 2 Design5.3.1 The Description of the PrincipleThe method of the multiple attribute decision making based on dispersion maximization is used to solve the multiple attribute decision making problems with the uncertain weight attribute. We can use this method to make ranking and comparison between different projects with multiple attributes.In more details the smaller the difference between certain attribute for all the projects is the less affection it has on the decision making and ranking of the projects. On the contrary the bigger it is the more affection it has on the decision making and ranking. As a result in the view of ranking the bigger of one attribute’s deviation is the bigger weight of this attribute should be given. Especially if there is no deviation for certain attribute to all the projects which means that this attribute will have little affection on the ranking we can value a zero to its weight.5.3.2 Model DevelopmentStep 1.Structure and Normalize the Decision Making Matrix1.1 Structure the Decision Making MatrixAssume that:M={1,2,…,m},N={1,2,…,n} (10)The projects set which also is the set of the Member States in WHO is XX={x 1,x 2,…,x n } (11)The attribute set which means main component set here is UU={u 1,u 2,…,u m } (12) is the attribute value of in reference to so we obtain the decision making matrix ()ij n m A a ×=whose form is shown as table 2 Table2. The form of the decision making matrixu 1u 2… u m x 1a 11a 12… a 1m x 2a 21a 22… a 2m ## # # x na n1a n2… a nm5.4 Model 3 DesignModel 3 is our predictive model, from model 1 we can get the objective function with the data of that year.When it comes to predicating for the convenience of evaluating the main components we can change the main component which is expressed by the standardization indicator z i into the form that expressed by nonstandard indicator z i ’ to predicate the main components.''''''1111122110''''''2211222220''''''11220(13)............p p p p m m m mp p m u l z l z l z l u l z l z l z l u l z l z l z l ⎧=++++⎪=++++⎪⎨⎪⎪=++++⎩"""Here(14)'()/i i i z z a b =−i Substitute into formula 1 can we obtain the formula 2.'i z i a is the mean value of the line i in the primitive matrix; is the standard deviationof row i in the primitive matrix.i bThen utilize the formula 9 to compute the synthetic score and get variability ofthe system.Normalize the Decision Making MatrixThere are many types of attributes such as benefit type, cost type, fixation type, deviate type, interval type, deviate interval type etc. In our model all the attribute could be sorted to two types the benefit type and the cost type approximately. The benefit cost requires the value of the attribute as big as possible; the cost type requires the value of the attribute as small as possible.To eliminate the impact of the different dimensions to the decision making result we should normalize the decision making matrix A whose values could be obtained from the model 1.Assume that I i (i=1, 2) stands for the subscript set of the benefit type and cost type. If the attribute is benefit type we value i in I i as 1. If the attribute is cost type we value i in I i as 2.1min(),,max()min()ij ij i ij ij ij ii a a r i a a N j I −=−∈∈ (15)2max(),,max()min()ij ij i ij ij ij i i a a r i a a N j I −=−∈∈ (16)After this step we get the normalized matrix ()ij n m R r ×= whose form is the samewith the matrix A.Step 2: Calculus the optimization weight vector w11111,n n ji kj i k j m n nij kj j i k r r w r r =====−=−∑∑∑∑∑j M ∈ (17) Where w j is the j th main component’s weight.Step 3: Computer the synthetic attribute z i (w) (i ∈N) of project x i .1(),,mi ij j j z w r w i N j ==∈∑M ∈ (18)Step 4: Make ranking and comparison to the projects (countries) using z i (w)(i ∈N)6. Applying the Model1 and Model 26.1 Applying the Model 1 to the Statistics of the Year 20046.1.1 Data for Model 1 in the Year of 2004We first select the indicators that 95% of the countries own these indicators from all 159 indicators getting 28 indicators which could be seen in appendix Ⅰ. Then weselect the countries that have the data for all these 28 indicators from all 193 Member States getting 163 countries. By doing these we have made good preparation for our model 1’s solution.6.1.2 Solution of the Model 1 for the Year of 2004Based on the above data we solve our model 1 in matlab using the function of zscore to normalize the data, and then we calculate the characteristic roots and characteristic vector. The characteristic roots are shown in the table 3.Table3. Part Valves of Model 1From the table 3 we can see that the front six red colored components’ accumulative contribution rate reaches to 81.5% which means that most of the main components are involved, so these six components are just our combined metrics. We renamed these six combined indicators with A, B, C, D, E, F metrics all of which are constituted by several raw indicators and could reflect certain performance of a health care system.In more detail the metric A is much positively related with life expectancy, per capita total expenditure on health at international dollar rate etc and much negatively related with mortality rate, incidence of tuberculosis (per 100 000 population per year) etc. The visual relationship between the metric and the 28 indicators is shown in figure 1. The x axis is the order of the 28 indicators which maps to corresponding 28 indicators in appendix Ⅰ. The y axis is the affection of each of the 28 indicator on metric A. All the rest five figures follow this instruction so we won’t explain the rest five figures again.Figure1. The affection of the 28 indicators on metric A The metric B is much positively related with expenditure on health, disease detection rate etc and much negatively related with government expenditure on health, alcohol consumption etc.Figure2. The affection of the 28 indicators on metric B The metric C is much positively related with General government expenditure on health as percentage of total expenditure on health, immunized with disease etc and much negatively related with private expenditure on health as percentage of total expenditure on health, population (in thousands) total etc.Figure3. The affection of the 28 indicators on metric C The metric D is much positively related with private expenditure on health as percentage of total expenditure on health, immunized with disease etc and muchnegatively related with General government expenditure on health as percentage of total expenditure on health etc.Figure4. The affection of the 28 indicators on metric D The metric E is much positively related with external resources for health as percentage of total expenditure on health etc and much negatively related with tuberculosis: DOTS case detection rate, probability of dying (per 1 000 population) between 15 and 60 years etc.Figure5. The affection of the 28 indicators on metric E The metric F is much positively related with immunized with disease, out-of-pocket expenditure as percentage of private expenditure on health etc and much negatively related with general government expenditure on health as percentage of total government expenditure, population (in thousands) total etc.Figure6. The affection of the 28 indicators on metric FThe above descriptions show that our metrics is reasonable, moreover all the 28indicarors we selected could be found in 92% of all Member States, which means that our metrics could be easily collected.Furthermore we get the ranking for all the 163 countries that own orbicular and effective data. The front and the back 20 countries in our ranking and their scores calculated by our model 1 are listed as table 4:Table4. Part of our Ranking by Our Model1The whole ranking is shown in appendix Ⅱ.After obtaining the six metrics we treat the still missing value’s indicator as zero then recompute the ranking of the year 2004 with the model 1 and get another ranking for all the Member States which we list in appendix Ⅲ.In conclusion we put forward 28 important indicators from all the 159 indicators furthermore we combine the 28 important indicators getting 6 main components which we renamed as metric A, B, C, D, E and F. Then we assess the health care system with these six metrics and make a ranking of all the 163 countries.6.1.3 Applying model 1 to the Statistics of the Year 2000Using model 1 and the six metrics obtained from 4.11 we assess the health care system of each country in the year of 2000. This time we only utilize the data of this year, which means that we just substitute the data of 2004 with that of 2000.By doing this we get the ranking of this year as table 5 which just show out the front and the back 20 countries too.Table5. The Part Ranking of the Year 2000 by Model 1 (There are 194 Member States in 2000; the score here is just a relative value computed by our model; the whole ranking is shown in appendix Ⅳ)6.2 Applying the Model 2The six metrics obtained from model1 is ordered. Although the six metrics keep the same in the model 2 as what they are in model 1 according to our assumptions, there is no certain order among them in our model 2. The data processing methods for the raw data are the same with what we have described and used before.6.2.1 Applying the Model 2 to the year of 2004With the help of the software matlab we realize the algorithm of dispersion maximization computing the weight of the six metrics, and then we calculate the synthetic score of each of the 163 country that own holonomic statistics after our data mining process. After comparing the synthetic score of these countries we get the ranking of their health system as shown in table 6.Table6. Part of the ranking for the 163Member States(The score here is just a relative value computed by our model; the whole ranking is shown in appendix Ⅴ)6.2.2 Applying the Model 2 to the year of 2000Similar to 4.1.2 we just replace the data of 4.2.1 with the data of the year 2000 then compute the synthetic score of all the 194 Member States. After comparing the different countries we get the ranking as table7.Table7. Part of the ranking for 2000 by model 27. Comparisons7.1 Comparisons between Different RankingsFrom the above solution we obtain 4 different rankings. The precise clues of our models have already showed their validity. Besides we can load a ranking for all the 190 Member states in 2000 from the WHO’s official web which we list in appendix Ⅷ.By making comparisons between our two rankings with the official ranking of the year 2000 we can test the reliability and practicability of our model to a certain extent. The figure7 shows their relationship clearly.Figure7. The corresponding relationship between our rankings and the WHO’s We can see that the dots which stand for parts of the countries in the rankings match quite well with each other in the three polygonal lines. That means the model1 and model 2’s results not only agree with each other but also agree with the official results quite well. So we can conclude that our two models are practical and reasonable.Since the solution for the year of 2000 is dependable, we have reason enough to predicate that our solution for 2004 is authentic as the only difference between 2004 and 2000 is the substituted statistics and the data of 2004 is more holonomic than that of 2000.To make sure that both of our models’ results for the year 2004 are unitive we make a comparison between their rankings. We select some characteristic countries in both rankings and compare those countries rankings as shown in figure 8.Figure8. The comparison between the two rankings for the year 2004From the figure we find that the two rankings match quite well.In conclusion our models are scientific and our results are authentic.7.2 Comparisons between US and FranceIn the 2000’s ranking of WHO France takes the first place, which also could be seen clearly in the appendix. In the year 2004 there is no official ranking so we assess these two countries health care system with our model 1 to see which country has the better health care system then.The table8 shows their score according to our six metrics:Table8. The comparisons between US and France’s health system according to our metricsThe metric A, C, F belongs to benefit type and the rest belong to cost type. Base on this we can see that the health care system of US in 2004 is better than France in metric A, B, D. According to our table 1 we know that the synthetic score of US is better than France.7.3 Comparisons between US and IndiaIn the ranking of WHO the health system of US is better than India. With the help of our mode 1 we consider that India has the poor health care system in 2004, so we make a comparison between them.Table9.The comparisons between US and India’s health system according to our metricsSimilar to 7.2 we can see that the health care system of US is better than India in metric A, B, C, D, F. Also from the table 9 we know that the ranking of US is much better than India.8. Applying the Model 3Based on model 1 and model 2 with the help of the software matlab we realize the algorithm in model 3 and get the predictive function of the synthetic scores as follows:''''1234'7''''67891''''1112131410.0033810.00966920.0105590.00194680.000522790.00052406 3.06100.0782130.00421940.0003620.00873510.00956890.00984890.000392260.0043929Q z z z z z z z z z '5z z z z z z −=−++−−−−×−−−−++−+'5''''1617181920''''2122232425'''2627280.0053440.0257520.00377190.000143460.000182770.000109410.000136790.00534410.056440.00292340.000840420.029650.012447 3.8668''z z z z z z z z z z z z ++−++++−+−−++−z (19)Considering the affection of the weight on the synthetic score we could find that the bigger the absolute value of weight is the bigger the impact is on the synthetic score of the country. On the contrary if the absolute value of weight is small then the variation of the metric won’t produce big changes to the synthetic score. Then we take some indicators of the all 28 indicators as examples to discuss what affection it will has on the health care system if the various changes are occurred.'8z is the formula is the total fertility rate (per woman). It has a negative correlation with the synthetic score. What’s more it has a big affection on the score so this indicator should be as small as possible, which means that the government should take some measures to control the population within a proper range to improve the health care system of the nation.'24z is the total expenditure on health as percentage of gross domestic product. Itis an indicator that positively related with the synthetic score which means that the more it spend on the total expenditure on health as percentage of gross domestic product the better score it has in the system.'17z is the general government expenditure on health as percentage of totalgovernment expenditure. It is an indicator that positively related with the synthetic score which means that the bigger the general government expenditure on health as percentage of total government expenditure is the better score it has in the system'3z is the life expectancy at birth (years) males. It is an indicator that positivelyrelated with the synthetic score which means that the longer the life expectancy at birth (years) males is the better score it has in the system.'z stands for the neonatal mortality rate (per 1 000 live births). It has a negative 11correlation with the synthetic score. That’s to say the smaller the neonatal mortality rate (per 1 000 live births)is the better the health care system will become.9. The Strength and Weakness9.1The StrengthWe obtain the statistics directly from the raw database of the WHO’s official web not from the report of the WHO. We use some data mining technology to draw the available and effective data from thousands terms of data ourselves.We develop three different models to solve all the six parts of the problem, those models are built with precise logic, scientific principle which could solve the problems efficaciously.We don’t solve the problem part by part but solve them in our models’ development and solution process, which keeps the whole paper’s with a good continuity.We compare our result with the practical result, which tests our models’ practicability and validity greatly.Our models could be easily extended to other fields to solve the multiple attribute decision making problems.Our models are independent to the metric (indicators) to a certain extent as the algorithm of our models has the universal applications.9.2 The WeaknessThe raw data we get is the data from the real world, which means that there must be some imperfect data which do have some negative impact on our result.As there are so many indictors that it is hard to select proper metrics to assess the health system properly without some kind of error.Because the limitation of the time and resource it’s inevitable to have some imperfect aspects in our models, analysis and paper.10. References[1] Zeshui Xu, 8/2004, Uncertain Multiple Attribute Decision Making: Methods andApplications, Tsinghua University Press.[2] Qiyuan Jiang, Jinxing Xie, 12/2004, Mathematical Model, Higher Education Press[3] The World Health Report 2000 - Health systems: improving performance.http://www.who.int/whr/2000/en/whr00_en.pdf[4] World Health Organization, http://www.who.int/research/en/s[5] Principal Component Analysis,/jpkc/jldlx/admin/ewebeditor/UploadFile/200783101241734.ppt[6] /wiki/World_Health_Organisation,"World Health Organization"11. AppendixAppendixⅠ: The list of all the 28 indicators and their sequence numberAppendixⅡ: The Ranking of all 163 Countries in 2004 by model 1Appendix Ⅲ: The Ranking of all 194 Countries in 2004 by model 1。
数学建模论文(7篇)
数学建模论文(7篇)在学习、工作中,大家总少不了接触论文吧,论文可以推广经验,交流认识。
如何写一篇有思想、有文采的论文呢?为了帮助大家更好的写作数学建模论文模板,山草香整理分享了7篇数学建模论文。
计算数学建模是用数学的思考方式,采用数学的方法和语言,通过简化,抽象的方式来解决实际问题的一种数学手段。
数学建模所解决的问题不止现实的,还包括对未来的一种预见。
数学建模可以说和我们的生活息息相关,尤其是如今科技发达的今天。
数学建模应用领域超乎我们的想象,甚至达到无所不及的程度,随着数学建模在大学教学中的广泛使用,使数学建模不止成为一种学科,更重要的是指导新生代更好的利用现代科学技术,成为高科技人才,把我国人才强国,科教兴国的战略推向一个新的高度。
1.数学建模对教学过程的作用1.1数学建模引进大学数学教学的必要。
教学过程,是教师根据社会发展要求和当代学生身心发展的特点,借助教学条件,指导学生通过认识教学内容从而认识客观世界,并在此基础之上发展自身的过程,即教学活动的展开过程。
以往高工专的数学教学存在着知识单一,内容陈旧,脱离实际等缺陷,已经不能满足时代的发展,如今的数学教学过程不是单纯的传授数学学科知识,而是通过数学教学过程引导学生认识科学,理解科学,从而指导实践,促进学生的德智体美劳全面的进步和发展。
因此数学建模成为一门学科,被各大高等院校广泛引用和推广,其实数学建模不止应用在大学数学教学中,其他一切教学过程多可引进数学建模。
1.2数学建模在大学数学教学中的运用。
大学数学教师通过这个数学建模过程来引导学生解决问题和指导实践的能力。
再次建模结果对现实生活的指导,这是大学数学教学中数学建模所需要达到的效果和要求。
不再停留在理论学习,而是通过理论指导实践,从而为科学的进步和人才综合水平的提高提供可能。
2.数学建模对当代大学生的作用2.2数学建模对学生综合能力的提高数学建模是大学数学教师运用数学科学去分析和解决实际问题,在数学建模学习的过程中,大学生的数学能力得到提高,其分析问题、解决问题的能力得到提高,这对大学生毕业走向社会具有着重大意义。
全国数学建模大赛A题获奖论文

全国数学建模大赛A题获奖论文城市表层土壤重金属污染分析摘要本文旨在对城市土壤地质环境的重金属污染状况进行分析,建立模型对金属污染物的分布特点、污染程度、传播特征以及污染源的确定进行有效的描述、评价和定位。
对于重金属空间分布问题,首先基于克里金插值法,应用Surfer 8软件对各数据点的分布情况进行模拟,得到了直观的重金属污染空间分布图形;随后,分别用内梅罗综合污染指数以及模糊评价标准和模型对城区内不同区域重金属的污染程度进行了评判。
对于金属污染的主要原因分析问题,基于因子分析法、问题一的结果和对各个金属污染物的来源分析等因素,判断出金属污染的主要原因有:工业生产、汽车尾气排放、石油加工并推测该区域是镍矿富集区。
随后讨论了污染源之间的相互关系和不同金属的污染贡献率。
针对污染源位置确定问题,我们建立了两个模型:模型一以流程图的形式出现,基于污染传播的一般规律建立模型,求取污染源范围,模型作用更倾向于确定污染源的位置;模型二基于最小二乘法原理,建立了拟合二次曲面方程,在有效确定污染源的同时也反映了其传播特征,模型更加清楚,理论性也更强。
在研究城市地质环境的演变模式问题中,我们对针对污染源位置确定问题所建模型的优缺点进行了评价,同时建立了考虑了时间,地域环境和传播媒介的污染物传播模型,从而反映了地质的演变。
综上所述,本文模型的特点是从简单的模型建立起,强更准确的数学模型发展,逐步达到目标期望。
关键词:重金属污染,克里金插值最小二乘法因子分析流程图一、问题重述问题背景随着城市经济的快速发展和城市人口的不断增加,人类活动对城市环境质量的影响日显突出。
对城市土壤地质环境异常的查证,以及如何应用查证获得的海量数据资料开展城市环境质量评价,研究人类活动影响下城市地质环境的演变模式,日益成为人们关注的焦点。
评价和研究城市土壤重金属污染程度,讨论土壤中重金属的空间分布,研究城市土壤重金属污染特征、污染来源以及在环境中迁移、转化机理,并对城市环境污染治理和城市进一步的发展规划提出科学建议,不仅有利于城市生态环境良性发展,有利于人类与自然和谐,也有利于人类社会健康和城市可持续发展[1]。
- 1、下载文档前请自行甄别文档内容的完整性,平台不提供额外的编辑、内容补充、找答案等附加服务。
- 2、"仅部分预览"的文档,不可在线预览部分如存在完整性等问题,可反馈申请退款(可完整预览的文档不适用该条件!)。
- 3、如文档侵犯您的权益,请联系客服反馈,我们会尽快为您处理(人工客服工作时间:9:00-18:30)。
历届数学建模优秀论文
引言
数学建模是一种将现实问题转化为数学模型,并通过数学方法进行求解和分析
的方法。
在数学建模竞赛中,评选出的优秀论文不仅反映了参赛团队的实力,也对数学建模的发展起到了积极的推动作用。
本文将对历届数学建模优秀论文进行回顾和总结,以展示数学建模领域的发展趋势和研究方向。
第一届数学建模优秀论文
第一届数学建模竞赛于1995年举办,该届共有来自全国50个高校的120支
队伍参赛。
在该届中,以下论文脱颖而出,成为第一届数学建模的优秀论文:
1.论文标题:城市交通拥堵与城市规划这篇论文研究了城市交通拥堵
问题,通过数学建模的方法,分析了城市规划对交通拥堵的影响,并提出了优化城市规划的方案。
这篇论文不仅展示了数学建模在解决实际问题中的效果,也对城市交通规划提供了有益的参考意见。
2.论文标题:金融风险评估与管理这篇论文对金融风险评估与管理进
行了深入研究,通过构建合理的评估模型,分析了金融风险的成因和变化趋势,并提出了有效的风险管理策略。
该论文在金融行业引起了广泛的关注,为金融机构的风险管理提供了有力的支持。
第二届数学建模优秀论文
第二届数学建模竞赛于1996年举办,参赛高校增加到100所。
以下是第二届
的优秀论文:
1.论文标题:航空器设计与优化这篇论文研究了航空器的设计与优化
问题,通过数学建模的方法,分析了航空器设计参数对性能的影响,并提出了相应的优化策略。
该论文对航空器设计的理论和实践具有重要意义。
2.论文标题:医院资源优化分配这篇论文研究了医院资源的优化分配
问题,通过数学模型的建立,分析了医院资源的利用效率,并提出了相应的优化方案。
该论文在医疗卫生领域引起了广泛的关注,为医院资源的合理配置提供了重要的参考。
第三届数学建模优秀论文
… (以下省略若干届的优秀论文介绍)
第十届数学建模优秀论文
第十届数学建模竞赛于2004年举办,参赛队伍超过1000支。
以下是第十届
的优秀论文:
1.论文标题:气象预测模型的研究与改进这篇论文对气象预测模型进
行了深入研究,通过改进传统的气象预测模型,提高了气象预测的准确度。
该论文在气象领域具有重要意义,为准确预测天气提供了有效的方法和技术支持。
2.论文标题:环境污染模拟与评估这篇论文研究了环境污染模拟与评
估问题,通过建立合理的模型,分析了环境污染的程度和影响因素,并提出了改善环境质量的措施和方法。
该论文在环境保护领域具有重要的理论和实践价值。
结论
通过回顾和总结历届数学建模优秀论文,可以看出数学建模在解决复杂实际问
题中的作用和价值。
这些优秀论文不仅体现了参赛团队的优秀能力和创新精神,也在各个领域提供了解决问题的新思路和方法。
随着数学建模竞赛的不断深入和扩大,相信将会有更多更优秀的论文涌现出来,为推动数学建模的发展做出更大的贡献。