从血液流变学到微循环与再生医学(经典英文文献批注)
《血液流变学》PPT课件

上一页 下一页 返 1回4
第二节 血液流变学常见参数测 定
• 一、血液粘度测定 • 二、红细胞变形性测定 • 三、红细胞聚集性测定
15
血液流变学常见参数
上一页 下一页 返 2回0
一、血液粘度测定
•(一)全血粘度测定 •【影响因素】 • 2.外在因素 • 温度 • 渗透压 • pH值 • 输液
上一页 下一页 返 2回1
一、血液粘度测定
• (二)血浆粘度测定 • 【基本结构】 • 已知尺寸的毛细管 • 加热装置 • 控温装置 • 测量电极 • 显示装置
4.53±0.46 9.31±1.48 1.76±0.04
4.22±0.41 8.37±1.22 1.78±0.06
上一页 下一页 返 2回6
(三)血液粘度测定理因素 ② 多个因素改变引起的全血粘度增高 ③ 血浆蛋白异常所致的血液粘度增高 ④ Hct增高所致血液粘度增高 ⑤ 红细胞异常所致的血液粘度增高
• 全血粘度 • 血浆粘度 • 血细胞比容 • 红细胞变形性 • 红细胞聚集性及其有关参数 • 血小板粘附率及聚集率
上一页 下一页 返 1回6
一、血液粘度测定
•(一)全血粘度测定 • 设备 旋转式粘度计 • 【原理】 • 当平板以一定的速度旋转时,由于血液的粘 滞性,与圆锥相连的弹簧则产生一个复原扭矩, 血液粘度的大小与复原扭矩呈正相关,复原扭矩 通过一个测力传感器检测并经计算机处理后,将 表观粘度值显示在仪器的屏幕上。
• 研究血液及其有形成分流动与形变规 律的学科称为血液流变学
上一页 下一页 返 回4
生理学 血液循环(双语)

2.心输出量与心指数
心输出量:75×60~80 ﹦4500~6000ml/min 心指数﹦心输出量/体表面积 3.心脏作功 4.心脏泵功能储备
概念:心输出量随机体代谢需要而增长的能力。 分类:心率储备:通过增加心率来增大心输出量 收缩期储备:直接增加搏出量来增大心输出量 舒张期储备:增加舒张末期血量来增大心输出量
20小a微a收缩外周阻力小v收缩血管容量30血压将急剧下降而休克收缩压舒张压脉压如循环血量不变血管容量中毒性休克血管扩张回心血量心输出量外周阻力寒冷时血管收缩血压仍维持血管充盈血压不显著降低动脉血压影响因素收缩压舒张压脉压备注每搏输出量收缩压高低主要反映sv大小心率hr心舒期缩短外周阻力舒张压主要反映外周阻力大a弹性管壁弹性可缓冲血压波动循环血量与血管容量的关系失血一般相适应从而产生一定的体循环平均充盈压二动脉脉搏在一个心动周期中心脏的收缩和舒张造成动脉内压力的周期性波动引起动脉血管壁产生搏动称为动脉脉搏arterialbloodpulse
内在特性
• 决定于心肌细胞兴奋-收缩耦联各环节 (如:肌凝蛋白ATP酶的活性、被活化的横桥数目等 )
• 神经、体液及药物都可通过改变心肌收缩力来调节SV
• 等长自身调节 ──改变心肌自身收缩力而影响
每搏输出量的过程
不改变心肌初长
大动脉血压 (后负荷afterload)
– 直接影响:减少SV 动脉血压升高(后负荷增加)→等容收缩时间 延长→射血时间减少、心肌缩短程度降低→搏出量 减少
初期: 内向离子流 (Ca2+ 为主)、外向离子流 (K +) 相对平衡 后期: 内向离子流逐渐减弱;外向离子流逐渐加强, 膜电位缓慢向复极化方向转化 慢钙通道 Ica-L ——电压依从性, 维拉帕米(verapamil) 、Mn 2+等阻断 钾通道:IK1(内向整流)、IK(延迟整流)
血液的流变性医学PPT

血液的流变特性
一、速度梯度与剪变率
(一)速度梯度
1.概念:在流体中某处, 速度正在其垂直方向 上的变化率称为该处 的速度梯度。
如果在X方向的微小距离 △X上,流速增量为 △V,则速度梯度为 △V /△X。 单位:s-1(1/秒)
微分学中
lim v dv x0 x dx
2.物理意义 描述速度随空间变化程度的 物理量。空间某点附近流速不 同,该处就存在速度梯度。
粘弹性流体从管内自由流出时,通常可以看 到射流膨胀现象,这种现象称为挤出物膨胀(如 图)。例如,聚苯乙烯在175~200℃条件下 较快挤出时,直径膨胀达2.8倍。以上现象都是 由于粘弹性流体受剪切时产生法向应力差的结 果。
(二)粘弹体的特点
(1).应力松弛:当粘
应变
弹体突然发生应变时,
若保持应变恒定,则应
生物流体具有粘弹性的原因:
细胞膜中磷脂分子的排列
蛋白质分子图像
水有粘性也是因为水分子是链状的
“隔年陈水有毒,隔夜陈水莫喝。”科学研究 证明,水分子是链状结构,水在漫长岁月中, 如不经常流动,这种链状结构会不断扩大延伸, 即成衰老之水。衰老之水,活力极差,进入动 植物体内,会使细胞的新陈代谢减缓,影响生 长发育。古人说:“流水不腐。”死水、陈水 中尘埃会增多,细菌增加,有害成分比例上升, 极易致病。
r0
v
各层的流速呈抛物线分布。
r
流体要流动,必须有外力抵消内 摩擦力,即管子两端L存在压强差 (⊿p)。
Q r04 p 8l
泊肃叶流动 的速度分布
适用条件:牛顿流体,流体作定常流动,均匀的水平圆管。
泊肃叶定律应用 它是设计竖直毛细粘度计 的理论依据。
Q r04 p 8l
第一节 血液流变学与临床讲解

二、血液流变性质的影响因素
(一)红细胞 (1)数量:血液粘度随着红细胞比容增大而增大,特别是红 细胞比容大于40%以上时,这种倾向更为显著。若血液浓缩, 红细胞比容达到80%左右时,血液流动性几乎接近丧失。 (2)变形能力:红细胞在流过营养性毛细血管时,可以顺着 血流方向变成子弹形或降落伞形。通常描述红细胞呈双凹圆盘 形,这只代表在不受到外在应力时的形态。在体内血液循环过 程中,红细胞总有不同程度的变形。若以戊二醛使红细胞固化, 引起变形能力丧失,将这种固化的红细胞浮于白蛋白溶液中, 则其粘度不再随切变速率变化而改变。这是由于溶液中缺乏大 分子桥联物质,红细胞并不发生聚集,故在低切变速率条件下, 粘度无明显改变,同时由于红细胞固化,无法随应力变化而产 生相应的取向变形,因此在高切变速率条件下粘度也无明显改 变。
第一节 血液流变学与临床
• 流变学的几个基本概念 • 血液流变性质的影响因素 • 血液流变性改变与临床 • 治疗高粘综合症的生理学基础
流变学(rheology)是力学的一个分支。由于物体的流动 与变形是不可分割的,即变形是流动的基础,流动是变形在 时间上的连续,故称为流变学。研究生物机体(包括人体)生 命过程中有关的流变学称为生物流变学(biorheology)。在 生物流变学中,专门研究与循环血流有关的流变学称为血液 流变学(hemorheology)。血液的生理功能是通过循环血液的 流变来实现的,因此血液流变学是生理学的一个重要分支。
(二)血浆
血浆本身的粘度主要取决于血浆中各种蛋白的含量,蛋 白质含量增高,血浆粘度越大。但与含有球形大分子(如白 蛋白)的一般溶液相比,血浆显示更大的粘度.这一现象的 产生主要与血浆中的纤维蛋白原有关。纤维蛋白原不仅分子 量大,形状是链状的,而且在结构上很不对称,因而它们在 血浆中可以形成网状结构。由于网状结构的形成,则可出现 结构粘度。在应力与温度较低时,结构粘度更为明显。当应 力与温度升高超过一定范围时,由纤维蛋白所形成的网状结 构就会破坏,结构粘度则消失,此时血浆粘度系牛顿粘度。 由于血浆纤维蛋白原浓度随着年龄增长而升高,故老人血浆 粘度高于青年人。除纤维蛋白原外,其他大分子蛋白质如α2 巨球蛋白、γ球蛋白等亦是血浆粘度的重要来源。
临床医学—微循环

毛细血管数量和交换面积
人体全身约400亿根 总有效交换面积约1000平方米 心脑肝肾密度高 骨、脂肪、结缔组织密度低
微循环的组成: 微A:总闸门 后微A:分闸 前阻力性Cap. Cap.前括约肌:分闸 真Cap.:营养性血管 通血Cap.:直捷通路 A-V吻合支:调节体热 微V:后阻力性Cap.
.
. .
捷
通血毛 细血管
微循环途径及其作用:
❖ (1)迂回通路(营养通路):①组成:血液 从微动脉→后微动脉→毛细血管前括约肌→真毛细 血管→微静脉的通路;②作用:是血液与组织细胞 进行物质交换的主要场所。
❖ 3.脑局部代谢对脑血流的影响: 脑各部分的血 流量与该部分的代谢活动程度相关。当脑的 某一部位活动加强时该部位的脑血流量增加, 代谢活动加强引起局部脑血流量增加的机制 可能是通过代谢产物如H+、K+、腺苷、O2 微循环障碍主要指微血管与微血流水平发 生的功能或器质性紊乱,从而造成微循环血 液灌注的障碍。此时微循环血液灌注障碍既 可有组织、器官灌注障碍,也可有细胞灌注 障碍,并导致相应病变。
(3)红细胞聚集产生的不良影响:阻力、粘度增大, 外周组织水肿使血管腔变小,加重系统负担。
(二)白细胞的流态
1.白细胞的变形能力差,在微循环中被动变形。 2.白细胞嵌塞:白细胞流到毛细血管处,变形
慢,发生嵌塞,数量增多,嵌塞使血流受阻。
(三)微循环血小板的流变特性
正常情况下血小板的流变特性随微循环影 响不大。若血小板被激活,血小板发生粘附、 聚集、释放,形成血栓,影响微循环。
血液流变学基础理论及其在医学上的应用7页word文档

血液流变学基础理论及其应用内容提要:血液流变学是近20年来新兴的一门生物力学分支学科,通过将血液视为非牛顿流体,应用流体力学的理论研究血液的流动性质以及其作用,并以此测定血液黏度、流动性、粘滞性及变形性,了解这些变化的病理生理意义,从而达到疾病诊断、治疗与预防。
本文将先阐述血液流变学的基础理论,然后介绍其在医学,生物医学工程学等方面的应用。
关键词:血液Casson 方程,血液层流流动、血液流变学的应用一、血液流体力学基础理论1、流体黏性考虑如左图所示的最简单的二维单向剪切流动,流动方向平行于x 轴,在y 方向上存在速度梯度分布u(y),显然u(y+dy)=u+du 。
定义y 处的剪应变率d dtγ为 d du dt dy=γ,即y 方向的速度梯度分布。
设不同流层之间的剪应力为τ,则剪应力τ与剪应变率d dtγ之间存在关系 du d dy dt==γτηη,其中η成为流体黏度。
若η始终为常数,流体剪应力与剪应变率之间存在正比关系,具有这种特性的流体称为牛顿流体,如空气,水等都是牛顿流体。
而如果η不是常数,而是d dt η的函数,即η=f(d dtη),则此流体称为非牛顿流体。
血液是一种非牛顿流体。
2、血液黏度血液流动性质研究已有一百余年。
1882年法国医生泊肃叶(Poiseuille )通过测量圆柱管内血液流量与压力差的关系,得到Poiseuille 定律,后来的Merrill 等人对此问题也进行过深入研究。
由于血细胞的存在,导致血液黏度随剪应变率呈现负相关的走向,即d dtγ增大,η下降。
这种非牛顿性是由血球引起的。
在某种红细胞悬液中,我们发现相对黏度,红细胞含量与剪切率之间明显存在对应关系。
在医学上,红血球的浓度常用血球比积H 表示,是血液中红血球的体积与血样总体积的比值。
3、血液的Casson 方程d dtγ增大,η下降,在低剪应变率下,Cokelet 等人在1963年用旋转粘度计测量转子突然停止时扭矩随时间的变化,测得了低剪应变率下剪应力-剪应变率的关系曲线,并应用外插法得到d dtγ=0时的静止血液所承受的剪应力。
话说微循环

话说微循环最近,刚参加工作的小珍同学遇到一件让她迷惑不已的事情。
事情是这样的。
在ICU工作的她参与了好几例危重患者的救治。
这些患者无一例外地在临死前,迅速出现血压下降、氧合下降。
虽经积极补液治疗,疗效欠佳。
“曾老师,这些病人并没有容量的丢失,怎么都出现了循环的衰竭呢?而且经积极扩容治疗,疗效都差。
”小珍不解地问。
曾老师笑着回答她:“这是微循环坍塌的后果!”什么是微循环从理论上讲,微循环是指微动脉与微静脉之间微血管中的血液循环。
微循环包括血液、淋巴液和组织液在微血管、微淋巴管和组织间的循环。
微循环有如下特点:微血管特别细,只有人的头发丝的二十分之—;微血管又特别薄,仅相当于—张纸的一百分之一;微血管还特别多,大约有—百亿根,如果将它们连接起来,长达十—万公里,可以绕地球两圈半。
综上,人体的所有的组织细胞都处于微循环的包裹之中。
因此微循环被称为生命之网。
人体的血管是输送血液的管道,它如同一条大河,逐渐分支核灌溉着四周的土地一样,也在营养着血管周围的组织细胞。
人体血管输送血液营养着周身的组织细胞,但仅靠心脏的有限收缩力是不能将血液直接输送到各组织细胞中去的,还必须依靠微血管自身的节律性运动进行第二次调节供血,血液才能灌注到各细胞中去。
因此微循环也被称为人体的“第二心脏”。
微循环功能微循环对人体的主要功能是进行物质交换和新陈代谢。
在血液循环过程中,—方面将氧气和营养物质带到各组织细胞,另—方面又将组织细胞代谢的二氧化碳和各种废物带走排出体外。
它是生命的基本特征之一,是机体与周围环境不断进行物质、能量及信息传递的血液、淋巴液及组织液的流动。
微循环的紊乱参与了多种疾病的发生和发展,这一点已越来越被人们所认识。
已有研究表明:人体的衰老,心脑血管疾病,肿瘤的发生、糖尿病、长期的亚健康状态等等,其病变都源于微循环障碍。
MODS中循环衰竭患者的微循环特点MODS患者因为血液流变学及身体代谢废物的堆积尤其是乳酸的堆积导致微循环障碍,后期因为炎性因子的释放微血管通透性增加,从而导致血管内液体向组织间集聚,造成相对的容量不足,引起血压下降,循环衰竭。
医学英语课文翻译
第一单元 A History of TCMText A A History of TCM1.通过考古发掘,中医药的历史可以追溯到数百万年前。
原始人们在基本生存方面花了大部分时间:狩猎、种植植物以获取食物、建造住所、保护自己。
很容易想象,随着时间的推移,他们会尝试大多数当地植物来寻找食物。
经过一段时间,随着口头记载的流传,可以确定哪些植物可以做美食,哪些可以用于建筑,哪些可以影响疾病,和哪些是有毒的。
通过试验和错误,一种原始的草药和饮食疗法在中国逐渐形成。
2.火作为一种取暖,燃料和光的资源在他们的生活中也发挥了关键作用。
他们围坐在火堆周围,我们的祖先发现热的治疗力量是很自然的。
这些力量对像关节炎这类寒湿病的作用特别明显,热量起到迅速缓解的作用。
这是艾灸的艺术的起源,热量的医疗应用适合于多种多样的条件。
3.在他们艰苦的生活中,这些古老的人们一定经历了各种各样的伤害。
痛苦的一个自然的反应是摩擦或按压病变部位。
这种动手的治疗逐渐演变成一个系统的治疗操作。
人们发现按压在身体上特定的穴位有广泛的影响。
他们开始使用磨骨碎片或石片增强感觉,针刺诞生了。
中国传统医学历史的记载4.中医的书面历史发展主要是在过去的3000年。
商朝的考古挖掘揭示了医学著作被刻在占卜的骨头上:早期的巫师,大多数是妇女,使用肩胛骨执行占卜仪式;后来这些骨头也被用于写作。
5.在1973年发现的11篇写在丝绸上的医学文献在某些方面阐明了中国历史早期的复杂实践。
追溯到公元前168年,这些文章讨论饮食、锻炼、艾灸和草药疗法。
,一本广泛混杂萨满魔法的文章(52病方)描述了草药和食物的药理作用。
这个时期还存在着神农的传说,农业的皇帝,他每天品尝100草药来评估他们的性能。
(据说他在调查的过程中已经中毒多次调)6.到公元400年,中国传统医学的基础已具有书面形式。
此时,医学中大多数魔法的方面已经落后;越来越相信自然的力量可以治愈疾病。
最重要的书籍是在公元前300年到公元400年之间编制的黄帝内经。
- 1、下载文档前请自行甄别文档内容的完整性,平台不提供额外的编辑、内容补充、找答案等附加服务。
- 2、"仅部分预览"的文档,不可在线预览部分如存在完整性等问题,可反馈申请退款(可完整预览的文档不适用该条件!)。
- 3、如文档侵犯您的权益,请联系客服反馈,我们会尽快为您处理(人工客服工作时间:9:00-18:30)。
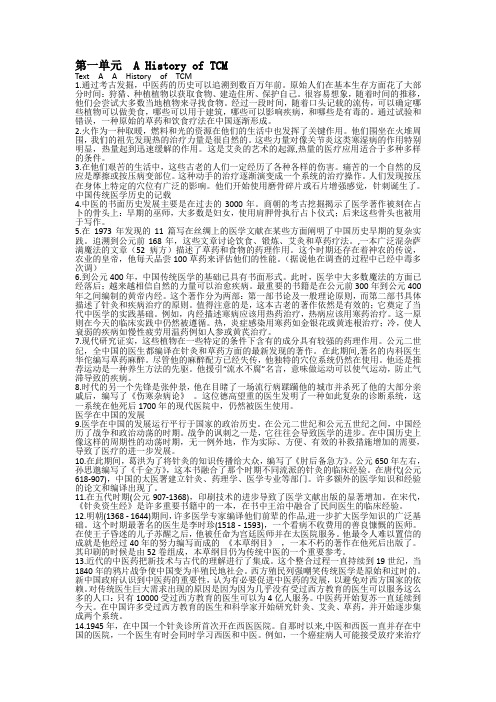
Clinical Hemorheology and Microcirculation 45 (2010) 79–99 DOI 10.3233/CH-2010-1312 IOS Press79From hemorheology to microcirculation and regenerative medicine: Fåhraeus Lecture 20091F. JungCenter for Biomaterial Development and Berlin-Brandenburg Center for Regenerative Therapies (BCRT), Institute for Polymer Research, GKSS Research Center GmbH, Teltow, Germany该文是Jung F在2009年获得欧洲微循环学会Fahraeus Award时对自己过去研究工作的总结。
其中列举的都是他的代表性研究。
1. Introduction It is a great honor for me to receive the Fåhraeus Award and I would like to thank the European Society very much for this. The medal represents an important milestone in my life and to have achieved it fills me with immense joy. I was especially pleased that my laudation was held by Mike Rampling – whom I had the pleasure of presenting the Fåhraeus medal in Dresden – and that this year it was his turn to present it to me. Mike is a very good friend of mine and an outstanding personality. I have always enjoyed the articles he has published and the lectures he has given over the past years. To be honored with the Fåhraeus medal as a non-physician was only possible due to my close collaborative research relationship with many clinicians within a vast network. Therefore, my most sincere thanks go to all with whom I had the pleasure of working during the past 25 years. As has been the tradition for many years, I would now like to present some of the most important of my work projects. My first work in the field of hemorheology was to investigate under which conditions the HagenPoiseuille Law is valid. This question can be answered straightforwardly by continuum physics. General mass and impulse balance equations form coupled systems of partial differential equations that are not directly solvable with respect to the associated exit, transient and boundary conditions. ∂vi =0 ∂xi ρ∗ ∂ ij ∂vi ∂p − = ρ ∗ fi + ∂t ∂xi ∂xi1 Excerpts from the Fåhraeus Lecture 2009 in Pontresina (Switzerland), at the 15th European Conference for Clinical Hemorheology and Microcirculation.1386-0291/10/$27.50 © 2010 – IOS Press and the authors. All rights reserved80F. Jung / From hemorheology to microcirculation and regenerative medicine: Fåhraeus Lecture 2009However, the estimates for the velocity field (vi ) and the stress tensor ij can be selected in such a way that an analytical solution, known to us as the Hagen-Poiseuille equation, is possible: V= π∗ρ∗g ∗ R4 8∗ηAltogether, the following 10 conditions need to be satisfied: 1) 2) 3) 4) 5) 6) 7) 8) 9) 10) the fluid is incompressible, the density of the fluid is constant, linear relation between shear stress and shear rate (Newton’s law), the viscosity is a material constant (it depends solely on temperature), the velocity field is one dimensional, it varies only in direction of the radius, the fluid flow is stationary (no time dependence), the vessel is an ideal cylinder, the radius of the vessel is constant (no peristaltic), no fluid exchange through the vessel wall, the shear rate at the wall is zero.It is clear that since most of the 10 conditions above are not fulfilled, the Hagen-Poiseuille equation can only offer an approximation of the blood flow in a vessel [22]. In 1981, I joined a research group at the Institute for Physiology at the RWTH Aachen, which, at that time, was focused on the development of rheological measurement technology. In a first study, a plasma viscometer was developed and evaluated, then the measurement accuracy, precision, and variability were tested [25, 26]. Also at that time, a consistent quality control feature was introduced [28], which has meanwhile become the standard in rheological methodology [3]. – precision in series: 1.14% – inter-individual variability: 3.2% – intra-individual variability: 1.59 ± 0.35%. A cross-sectional population based study followed in which the reference range and the relationship to age, body weight and sex was determined [28]: Reference range: 1.24 mPas (1.14–1.34 mPas) The results revealed that neither smoking nor sex or age had any effect on the plasma viscosity of apparently healthy subjects, whereas there was a clear relationship to the body weight [29]. However, all smokers suffering from bronchitis had been excluded from the study because such subjects cannot be regarded as healthy. Indeed, their plasma viscosity showed a marked increase. Studies conducted by Harkness suggested [20] that proteins affect the plasma viscosity in various ways. Thus, a further demographics study [36] with 2821 subjects investigated the influence of different proteins (albumin, fibrinogen, 2-macrogobulin, immunoglobulins) and also of different plasma lipids (cholesterol, triglycerides, HDL). Figure 1 shows the correlation between plasma viscosity and fibrinogen concentration (Fig. 1a) and HDL concentration (Fig. 1b). Fibrinogen has the strongest influence on plasma viscosity (r = 0.62). Interestingly, the HDL-cholesterol concentration is reversely correlated, meaning the plasma viscosity decreases as the HDL concentration increases.F. Jung / From hemorheology to microcirculation and regenerative medicine: Fåhraeus Lecture 200981a10 9 8y = 7.87x - 6.3 r = 0.62 n = 2676bHDL cholesterol (mmol/l)2.5 2 1.5 1 0.5 0y = -0.83x + 2.34 r = 0.15 n = 2686Filxinogen (g/l)7 6 5 4 3 2 1 1.2 1.3 1.4 1.5 1.6 1.7 1.81.21.31.41.51.61.71.8Plasma viscosity (mPas)Plasma viscosity (mPas)Fig. 1. (a) Correlation between plasma viscosity and fibrinogen concentration and (b) HDL-cholesterol concentration, (modified according to [36])."Beta-weights"0.6r = 0.69 R = 0.480.40.20.0-0.2 Fi b TG IGM Chol a2M HD Lmolecul/molecul complexFig. 2. Influence of different plasma proteins and plasma lipids on the plasma viscosity (according to [36]).The influence of various molecules on plasma viscosity can best be demonstrated by means of beta weights (see Fig. 2). The subsequent clinical trial [47] showed not only that the plasma viscosity in patients with peripheral arterial occlusive disease was significantly higher than in healthy study subjects, but also that it continuously increased with disease stage (see Fig. 3). The results of this study led to a discussion as to whether altered blood rheology influences the development of atherosclerosis. This led to another study, initiated in 1986 in Aachen, to elucidate whether changes in blood fluidity foster the development and progress of vascular disease [46]. The Aachen study was an epidemiological prospective cohort study with annual control examinations. The aim of the study was to prove whether the initially reduced blood fluidity in subjects without arterial82F. Jung / From hemorheology to microcirculation and regenerative medicine: Fåhraeus Lecture 20091.61.41.21.0healthy subjects n=283 POAD I n=33 POAD II n=184 POAD IV n=72Fig. 3. Plasma viscosity in patients with peripheral arterial occlusive disease.occlusive disease is a risk factor for the later occurrence of arterial circulation disorders. Based on the data of a prestudy, 2821 voluntary subjects of both sexes (1709 m; 1112 f) between 45 and 65 years of age were included. After the entry examination, two incidence groups of 456 participants each – without malignoma, chronic inflammations, and arterial or venous disease – were categorized according to their blood fluidity. The members of both groups were comparable with respect to cardiovascular risk factors such as hypercholesterolemia, hypertriglyceridemia, decreased HDL cholesterol, elevated blood pressure, diabetes mellitus, age, and sex. They only differed in blood fluidity: Group I had reduced blood fluidity (at least 1 rheological variable above the mean value + standard deviation limit in healthy subjects) and Group II had normal blood fluidity. Two years after the start of the study, 30 subjects in Group I had already developed an arterial occlusive disease but only 14 in Group II (see Fig. 4). This indicates that the relative risk (RR) of developing an arterial disease within 2 years is more than twice as high (RR: 2.14 CI: 1.14–4.01) for subjects between 45 and 65 years with intact vasculature but reduced blood fluidity compared to subjects with intact vasculature and normal blood fluidity [47]. Therefore, the Aachen study clearly showed that reduced blood fluidity is an important independent risk factor for arterial occlusive disease.AOD/Non-AOD [-]0.08 reduced 0.060.04 incidence group II: normal blood 0.02 p=0.0199 0.00 0 1 2Time [years]Fig. 4. Results of the Aachen study.F. Jung / From hemorheology to microcirculation and regenerative medicine: Fåhraeus Lecture 200983In addition, it was found that increased plasma viscosity – independent of classical risk factors – was a predictive factor for the later incidence of peripheral arterial occlusive disease. This finding was confirmed by two other epidemiological studies on rheological parameters – the Caerphilly-Speedwell and MONICA studies. Whether this is indicative of some causal relationship or only reflects an early prodromal stage of high plasma viscosity (thus, probably, a good early diagnosis method) cannot be concluded from the studies conducted so far. Ultimately, it still remains to be seen whether early treatment of impaired blood fluidity has an influence on the incidence of arterial occlusive disease. Such interventional studies, however, are not available to date. Blood is a highly concentrated suspension, whose components can reduce its fluidity when they interact with each other [10]. The extent of cell-cell interactions depends on the number and properties of the cells and plasma, and also on the shear forces present. During the 1970s, research was focused on the influence of microrheological variables on whole blood viscosity. The fundamental principles of this field were developed by the research groups Schmid-Schönbein [70], Barras [2], Meiselman [58, 63], Forconi [16–18, 72] and, in particular, Chien [10, 11]. Blood properties govern perfusion to a greater extent in the microvasculature than in the macrovasculature. During circulation, blood separates with a higher concentration of red blood cells in the center region of blood vessels compared to the marginal regions [56]. Moreover, in the capillary system – arterioles, capillaries, venules – blood cells are redistributed so that the actual capillary hematocrit is only 15% [32], whereas it may be double this value in thoroughfare channels. Hence the blood viscosity in the capillary system approaches the viscosity of plasma [2] and the plasma viscosity determines the blood flow velocity in the capillaries. A prerequisite is, however, that the erythrocyte aggregates in the arterioles are sheared – shear rates being the highest here – so that the single erythrocytes, whose diameters at rest are about 8.5 mm and which are thus considerably larger than the capillary diameters of 3 to 9 mm, can enter into the capillaries. Thus, in order to investigate this hypothesis, microcirculation investigation methods had to be developed or available methods needed to be adapted for use in a clinical situation and, most importantly, they had to be evaluated. The technologies conjunctival capillary videomicroscopy [23, 49, 79] and videofluorescence angiography of retinal blood circulation were developed in collaboration with Sebastian Wolf [4, 24, 77, 78, 80]; periungual capillary videomicroscopy [27, 31, 37], and oxygen partial pressure measurements in skeletal muscle using macroelectrodes were evaluated in collaboration with Holger Kiesewetter [43, 54, 55]. In Fig. 5, the left-hand image shows a perimacular capillary network [78] of a healthy study subject and, in contrast, the right-hand image shows the altered capillary network of a patient with diabetic retinopathy. In the latter, the foveal avascular zone is distinctly larger, capillary demise clearly having occurred, and arteriolar dropouts are also identifiable. Dynamic analyses have demonstrated that erythrocyte velocity in these capillaries of healthy subjects was about three times higher than in nail-fold capillaries [31, 77] – which could be ascribed to much lower hemodynamic resistance, the capillaries being considerably shorter here than in the skin. Conjunctival capillary videomicroscopy is particularly suitable for measuring the influence of mediators on the vessel diameter, but is less suitable for dynamic analysis. As is typical of the mucosa, the number of anastomoses found is very high so that flow reversals and stagnation or shuttle flow may be frequent. This makes it difficult to assess or statistically analyze blood circulation at rest. Figure 6 depicts an example. Here the influence of a vasoconstrictor and a vasodilator on vessel diameter of a conjunctival arteriole was studied. The results show that these arterioles are capable of changing their diameters by up to 300% and thus can regulate blood flow very effectively.84F. Jung / From hemorheology to microcirculation and regenerative medicine: Fåhraeus Lecture 2009abFig. 5. (a) Perimacular capillaries in healthy subjects and (b) in patients with diabetic retinopathy.constrictednormal statedilatedFig. 6. Conjunctival arteriole in the normal, constricted and dilated state.As an example the evaluation of periungual video capillary microscopy is described below. Skin capillaries can be observed under a reflected-light microscope [9, 31, 73]. The capillaries of the nail fold run parallel to the surface of the skin and are thus particularly suitable for dynamic analyses. The system setup comprised a reflected-light microscope with coarse and fine vertical adjustment, an objective with a long focal distance (Neofluar 6.3/0.20), an Optovar 1.0–2.0 (for quick magnification changes), a cold-light source with a green filter (in the spectral absorption range of hemoglobin (480 nm) for enhanced contrast between red blood cells and tissue), and a heat filter (to prevent heating of the finger during the measurement). The digital image data are recorded on video tape for off-line analysis (Fig. 8). The overall system is an optical transfer chain consisting of various components so that the total transfer function is derived by calculating the transfer function of the individual components. The spatial resolution of an optical system is characterized by the modulation transfer function, that is, modulation of an input signal as a function of the spatial frequency in the image plane. In the present case, the vertical resolution limit is 0.784 m [33], which is considerably smaller than the image structures to be measured so that they can thus be located with sufficient accuracy. Under these conditions, it is sufficient to describe the geometric transfer behavior. Because the transfer behavior is space-dependent, it is relatively easy蹄、甲、爪周围的F. Jung / From hemorheology to microcirculation and regenerative medicine: Fåhraeus Lecture 200985to investigate how the given distances are displayed in horizontal, vertical, and diagonal directions. The results show that the measuring procedure is correct with regard to measuring accuracy. For assessments of capillary erythrocyte velocities (usually in the vertical direction), the measurement error with respect to length measurements of 100 m is approx. 1.5% [33]. Detailed information on the transfer function and spatial resolution can be found in earlier publications [33, 35]. Accuracy, precision, and power of discrimination are not independent of each other (see Fig. 7): 1) The lower the precision => the broader the reference ranges. 2) The broader the reference ranges => the lower the discrimination. Thus, in order to achieve a high degree of discrimination between normal and impaired capillary flow, and to minimize false positive and also false negative results, it was necessary to fine-tune the individual components of the microscope and the video transfer chain with respect to each other in such a way that the highest possible resolution was obtained.Frequency distribution Plasma viscosity [mPas]reference rangepatientsplasma viscosity [mPas]false negativ false negativFig. 7. Discrimination between healthy and diseased subjects.表面的丆表浅的superficialmicroscopdigitalramification of the digital手指的乮数字的乯分支、衍生Fig. 8. System setup with sketch of the imaging area and the focused capillaries (modified according to [37]).86F. Jung / From hemorheology to microcirculation and regenerative medicine: Fåhraeus Lecture 2009When evaluating a measurement method, it is important to differentiate between the technical errors of measurement acquisition and biological errors, which are dependent on the biological structure of the studied area, as well as influencing variables. At the same time, the technical error should not exceed 30% of the biological error [35]. When evaluating the clinical significance of the measurement parameters, it is important to take account of the physiological fluctuations of such a parameter during repeated measurements, particularly in the case of assessments of long-term therapies. It is therefore important to determine the fluctuation range of a parameter throughout a day, a week, and a year. Since the result of a measurement essentially depends on how an investigation is performed, the measuring process is now explained first. 以下为甲皱微循环的测量过程及注意事项両 The hand is positioned at heart level under the objective on an adjustable X, Y microscope stage that has been preheated to 28◦ C. The pulse rate and blood pressure are then measured (in the contralateral arm to avoid capillary flow reactions to blood pressure measurement). During the measurement, the subject is seated on a chair with his or her arm resting relaxed on the microscope table. The measurements are always carried out on the fourth finger of the right or left hand. For the duration of the investigation the finger is held by a clamp at the front third dorsal portion of the nail bed so that perfusion in the nailfold is not affected [13]. Application of a drop of immersion oil causes the epidermis to become transparent and the capillaries in the nail cuticle can be brought into focus. In order to assess the concordance of capillary perfusion, the whole nail fold margin is first scanned at a low magnification (1 : 285). When perfusion has become concordant and continuous, the images obtained from one capillary area are recorded continuously on video tape for three minutes at a magnification of 1 : 570 for later analysis. The erythrocyte velocity is measured interactively via the frame-by-frame technique [14] or via an image processing system [48]. The velocity is measured approx. 100 m from the capillary vertex in a microscopic field of ±50 m. Repeated velocity measurements are performed to compensate for rhythmic fluctuations in the erythrocyte velocity, which have a frequency of 6 to 10 per minute [14] and are caused by vasomotion, i.e. oscillation of the vascular caliber of precapillary arterioles. Ten measurements are made per minute per capillary (thus, in total 30 velocity measurements are made during the 3 min recording time). The time-averaged erythrocyte velocities are calculated from these values. Given a normal capillary density (9 per millimeter epidermis margin [41]) about 4 to 5 capillaries can be seen on the monitor at a magnification of 1 : 570, the magnification at which the velocity measurements are performed. To ensure that 弯曲、曲度 all the capillaries are in good focus, an area with the smallest curvature at the center part of the nail fold is selected where preferably all capillaries are in the same depth of focus of the microscope objective and are sharply imaged. If this is the case, time-averaging is carried out on 4 capillaries as mentioned above. If 4 capillaries cannot be assessed (e.g. when capillary density is low, imaging quality is poor, or neighboring capillaries are not in the same depth of focus, etc.), a second area is imaged for another 3 min. The following specified mean velocities of erythrocytes are calculated over time (10 measurements/min over 3 min) and spatial averages (over 4 capillaries). The following Table 1 shows that, with unimpaired microcirculation in a finger, the same mean values for erythrocyte velocity can be obtained for two different capillary areas and that secondly, the thus calculated mean erythrocyte velocity is found 需要搞清他测的是动脉支还是静脉支的RBC流速 even in measurements on different fingers.根据后面的内容看丆应该是动脉支的RBC流速。