Boys Size 1-16 Body Measurements-August 02
应用双能X线吸收法测量人体身体成分的精密度
第33卷第6期暨南大学学报(医学版)Vol.33No.6 2012年12月Journal of Jinan University(Medicine Edition)Dec.2012应用双能X线吸收法测量人体身体成分的精密度肖泽宇,郭斌,弓健,唐勇进,徐浩(暨南大学附属第一医院核医学科,广东广州510632)[摘要]目的:应用双能X线吸收法(dual-energy X-ray absorptiometry,DXA)测量人体身体成分精密度,探讨DXA对人体身体成分和脂肪分布测量结果的重复性。
方法:DXA(GE Lunar Prodigy)对20名健康成年志愿者(男女各10名)进行10次全身重复扫描,应用专用分析软件计算全身骨量(total bone mineral content,TBMC),全身脂肪组织量(total fat mass,TFM),全身瘦组织量(total lean mass,TLM),全身脂肪含量百分数(total body fat percent-age,%TBF),腹部脂肪含量百分数(android fat percentage,%AF),臀部脂肪含量百分数(gynoid fat percentage,% GF),通过计算变异系数均方根(RMS-CV)和标准差均方根(RMS-SD)评价DXA对人体身体成分和脂肪分布测量的精密度。
结果:人体全身TBMC,TFM,TLM,%TBF的RMS-CV和RMS-SD分别为1.05%、1.95%、0.93%、1.98%和0.025、0.234、0.377、0.353。
脂肪分布测量结果(%AF、%GF)的RMS-CV和RMS-SD分别为2.51%、1.80%和1.153、1.101。
结论:DXA测量人体身体成分和脂肪分布具有良好的精密度。
[关键词]精密度;身体成分;脂肪分布;双能X线吸收法[中图分类号]R81[文献标志码]A[文章编号]1000-9965(2012)06-0587-04Precision of DXA for the measurements of human body compositionXIAO Ze-yu,GUO Bin,GONG Jiang,TANG Yong-jin,XU Hao(Department of Nuclear Medicine,the First Affiliated Hospital,Jinan University,Guangzhou510630,China)[Abstract]Aim:To measure the precision of body composition measurements and fat distribution in human using dual energy X-ray absorptiometry(DXA),and evaluate its reliability.Methods:Ten con-secutive total body scans were conducted with DXA(GE Lunar Prodigy)in20healthy adult volunteers(10 males,10females).The software(enCORE,version10.50.086)was used to analyze total bone mineral content(TBMC),total lean mass(TLM),total fat mass(TFM),total body fat percentage(%TBF),android fat percentage(%AF),gynoid fat percentage(%GF),the precision was represented as the co-efficient of variation of root mean square(RMS-CV),standard deviation of root mean square(RMS-SD).Results:RMS-CV were1.05%,1.95%,0.93%,1.98%and RMS-SD were0.025,0.234,0.377,0.353for TBMC,TFM,TLM and%TBF.RMS-CV were2.51,1.80and RMS-SD were1.153,1.101for%AF and%GF.Conclusion:DXA provided excellent precision for the measurements of body composi-tion and fat distribution.[Key words]precision;body composition;fat distribution;dual energy X-ray absorptiometry[收稿日期]2012-05-09[基金项目]广东省医学科研基金立项项目(A2008354)[作者简介]肖泽宇(1987-),男,医师,研究方向:临床核医学通讯作者:徐浩,男,教授,博士生导师,Tel:020-38688404,E-mail:txh@jnu.edu.cn身体成分(body composition)是指在人体总质量中,脂肪、瘦组织、骨矿物含量及其构成比例[1]。
The Body-Mass Index, Airflow Obstruction, Dyspnea, and Exercise Capacity Index in COPD
n engl j med 350;10march 4, 2004 The new england journal of medicine1005The Body-Mass Index, Airflow Obstruction, Dyspnea, and Exercise Capacity Index in Chronic Obstructive Pulmonary DiseaseBartolome R. Celli, M.D., Claudia G. Cote, M.D., Jose M. Marin, M.D., Ciro Casanova, M.D., Maria Montes de Oca, M.D., Reina A. Mendez, M.D.,Victor Pinto Plata, M.D., and Howard J. Cabral, Ph.D.From the COPD Center at St. Elizabeth’s Medical Center, Tufts University School of Medicine, Boston (B.R.C., V .P.P.); Bay Pines Veterans Affairs Medical Center, Bay Pines,Fla. (C.G.C.); Hospital Miguel Servet, Zara-goza, Spain (J.M.M.); H ospital Nuestra Senora de La Candelaria, Tenerife, Spain (C.C.); Hospital Universitario de Caracas and Hospital Jose I. Baldo, Caracas, Vene-zuela (M.M.O., R.A.M.); and Boston Uni-versity School of Public H ealth, Boston (H.J.C.). Address reprint requests to Dr.Celli at Pulmonary and Critical Care Medi-cine, St. Elizabeth’s Medical Center, 736Cambridge St., Boston, MA 02135, or at bcelli@.N Engl J Med 2004;350:1005-12.Copyright © 2004 Massachusetts Medical Society.backgroundChronic obstructive pulmonary disease (COPD) is characterized by an incompletely re-versible limitation in airflow. A physiological variable — the forced expiratory volume in one second (FEV 1 ) — is often used to grade the severity of COPD. However, patients with COPD have systemic manifestations that are not reflected by the FEV 1 . We hypoth-esized that a multidimensional grading system that assessed the respiratory and sys-temic expressions of COPD would better categorize and predict outcome in these pa-tients.methodsWe first evaluated 207 patients and found that four factors predicted the risk of death in this cohort: the body-mass index (B), the degree of airflow obstruction (O) and dys-pnea (D), and exercise capacity (E), measured by the six-minute–walk test. We used these variables to construct the BODE index, a multidimensional 10-point scale in which higher scores indicate a higher risk of death. We then prospectively validated the index in a cohort of 625 patients, with death from any cause and from respiratory caus-es as the outcome variables.resultsThere were 25 deaths among the first 207 patients and 162 deaths (26 percent) in the validation cohort. Sixty-one percent of the deaths in the validation cohort were due to respiratory insufficiency, 14 percent to myocardial infarction, 12 percent to lung can-cer, and 13 percent to other causes. Patients with higher BODE scores were at higher risk for death; the hazard ratio for death from any cause per one-point increase in the BODE score was 1.34 (95 percent confidence interval, 1.26 to 1.42; P<0.001), and the hazard ratio for death from respiratory causes was 1.62 (95 percent confidence inter-val, 1.48 to 1.77; P<0.001). The C statistic for the ability of the BODE index to predict the risk of death was larger than that for the FEV 1 (0.74 vs. 0.65).conclusionsThe BODE index, a simple multidimensional grading system, is better than the FEV 1at predicting the risk of death from any cause and from respiratory causes among pa-tients with COPD.The new england journal of medicine1006hronic obstructiv e pulmonarydisease (COPD), a common disease char-acterized by a poorly reversible limitationin airflow,1 is predicted to be the third most fre-quent cause of death in the world by 2020.2 Therisk of death in patients with COPD is often gradedwith the use of a single physiological variable, theforced expiratory volume in one second (FEV1).1,3,4However, other risk factors, such as the presenceof hypoxemia or hypercapnia,5,6 a short distancewalked in a fixed time,7 a high degree of functionalbreathlessness,8 and a low body-mass index (theweight in kilograms divided by the square of theheight in meters),9,10 are also associated with anincreased risk of death. We hypothesized that a mul-tidimensional grading system that assessed the res-piratory, perceptive, and systemic aspects of COPDwould better categorize the illness and predict theoutcome than does the FEV1 alone. We used datafrom an initial cohort of 207 patients to identifyfour factors that predicted the risk of death: thebody-mass index (B), the degree of airflow ob-struction (O) and functional dyspnea (D), and exer-cise capacity (E) as assessed by the six-minute–walk test. We then integrated these variables into amultidimensional index — the BODE index — andvalidated the index in a second cohort of 625 pa-tients, with death from any cause and death from859 outpatients with a wide range in the severityof COPD were recruited from clinics in the UnitedStates, Spain, and Venezuela. The study was ap-proved by the human-research review board at eachsite, and all patients provided written informed con-sent. COPD was defined by a history of smokingthat exceeded 20 pack-years and a ratio of FEV1 toforced vital capacity (FVC) of less than 0.7 measured20 minutes after the administration of albuterol.1All patients were in clinically stable condition andreceiving appropriate therapy. Patients who werereceiving inhaled oxygen had to have been takinga stable dose for at least six months before studyentry. The exclusion criteria were an illness otherthan COPD that was likely to result in death withinthree years; asthma, defined as an increase in theFEV1 of more than 15 percent above the base-linevalue or of 200 ml after the administration of a bron-chodilator; an inability to take the lung-functionand six-minute–walk tests; a myocardial infarctionwithin the preceding four months; unstable angi-na; or congestive heart failure (New York Heart As-sociation class III or IV).variables selected for the bode indexWe determined the following variables in the first207 patients who were recruited between 1995 and1997: age; sex; pack-years of smoking; FVC; FEV1,measured in liters and as a percentage of the pre-dicted value according to the guidelines of theAmerican Thoracic Society11; the best of two six-minute–walk tests performed at least 30 minutesapart12; the degree of dyspnea, measured with theuse of the modified Medical Research Council(MMRC) dyspnea scale13; the body-mass index9,10;the functional residual capacity and inspiratorycapacity11; the hematocrit; and the albumin level.The validated Charlson index was used to deter-mine the degree of comorbidity. This index hasbeen shown to predict mortality.14 The differenc-es in these values between survivors and nonsur-vivors are shown in Table 1.Each of these possible explanatory variableswas independently evaluated to determine its as-sociation with one-year mortality in a stepwise for-ward logistic-regression analysis. A subgroup offour variables had the strongest association — thebody-mass index, FEV1 as a percentage of the pre-dicted value, score on the MMRC dyspnea scale,and the distance walked in six minutes (general-ized r2=0.21, P<0.001) — and these were includ-ed in the BODE index (Table 2). All these variablespredict important outcomes, are easily measured,and may change over time. We chose the post-bron-chodilator FEV1 as a percent of the predicted value,classified according to the three stages identifiedby the American Thoracic Society, because it can beused to predict health status,15 the rate of exacer-bation of COPD,16 the pharmacoeconomic costs ofthe disease,17 and the risk of death.18,19 We chosethe MMRC dyspnea scale because it predicts thelikelihood of survival among patients with COPD8and correlates well with other scales and health-status scores.20,21 We chose the six-minute–walktest because it predicts the risk of death in patientswith COPD,7 patients who have undergone lung-reduction surgery,22 patients with cardiomyopa-thy,23 and those with pulmonary hypertension.24In addition, the test has been standardized,12 theclinically significant thresholds have been deter-mined,25 and it can be used to predict resource uti-cn engl j med 350; march 4, 2004n engl j med 350;10march 4, 2004 a multidimensional grading system in chronic obstructive pulmonary disease1007lization. 26 Finally, there is an inverse relation be-tween body-mass index and survival 9,10 that is not linear but that has an inflection point, which was 21 in our cohort and in another study. 10validation of the bode indexThe BODE index was validated prospectively in two ways in a different cohort of 625 patients who were recruited between January 1997 and January 2003. First, we used the empirical model: for each threshold value of FEV 1 , distance walked in six min-utes, and score on the MMRC dyspnea scale shown in Table 2, the patients received points ranging from 0 (lowest value) to 3 (maximal value). For body-mass index the values were 0 or 1, because of the unique relation between body-mass index and survival described above. The points for each varia-ble were added, so that the BODE index ranged from 0 to 10 points, with higher scores indicating a greater risk of death. In an exploratory analysis, the various components of the BODE index were as-signed different weights, with no corresponding increase in predictive value.study protocolIn the cohort, patients were evaluated with the use of the BODE index within six weeks after enroll-ment and were seen every three to six months for at least two years or until death. The patient and family were contacted if the patient failed to return for appointments. Death from any cause and from specific respiratory causes was recorded. The cause of death was determined by the investigators at each site after reviewing the medical record and death certificate.statistical analysisData for continuous variables are presented as means ± SD. Comparison among the three coun-tries was completed with the use of one-way analy-sis of variance. The differences between survivors and nonsurvivors in pulmonary-function variables and other pertinent characteristics were established with the use of t-tests for independent samples.To evaluate the capacity of the BODE index to pre-dict the risk of death, we performed Cox propor-tional-hazards regression analyses. 27 We estimat-ed the hazard ratio, 95 percent confidence interval,and P value for the BODE score, before and after adjustment for coexisting conditions as measured by the Charlson index. We repeated these analyses using the BODE index as the predictor of interest in*FVC denotes forced vital capacity, FEV 1 forced expiratory volume in one sec-ond, and FRC functional residual capacity.†Scores on the modified Medical Research Council (MMRC) dyspnea scale can range from 0 to 4, with a score of 4 indicating that the patient is too breathless to leave the house or becomes breathless when dressing or undressing.‡The body-mass index is the weight in kilograms divided by the square of the height in meters.§Scores on the Charlson index can range from 0 to 33, with higher scores indi- cating more coexisting conditions.*The cutoff values for the assignment of points are shown for each variable. The total possible values range from 0 to 10. FEV 1 denotes forced expiratory volume in one second.†The FEV 1 categories are based on stages identified by the American Thoracic Society.‡Scores on the modified Medical Research Council (MMRC) dyspnea scale can range from 0 to 4, with a score of 4 indicating that the patient is too breathless to leave the house or becomes breathless when dressing or undressing.§The values for body-mass index were 0 or 1 because of the inflection point in the inverse relation between survival and body-mass index at a value of 21.The new england journal of medicine1008dummy-variable form, using the first quartile as thereference group. These analyses yielded estimatesof risk similar to those obtained from analyses us-ing the BODE score as a continuous variable. Thus,we focus our presentation on the predictive charac-teristics of the BODE index and present only bivari-ate results for survival according to quartiles of theBODE index in a Kaplan–Meier analysis. The statis-tical significance was evaluated with the use of thelog-rank test. We also performed bivariate analysison the stage of COPD according to the validatedstaging system of the American Thoracic Society.3In the Cox regression analysis, we assessed thereliability of the model with the body-mass index,degree of airflow obstruction and dyspnea, and ex-ercise capacity score as the predictor of the time todeath by computing bootstrap estimates using thefull sample for the hazard ratio and its 95 percentconfidence interval (according to the percentilemethod). This approach has the advantage of notrequiring that the data be split into subgroups andis more precise than alternative methods, such ascross-validation.28Finally, in order to determine how much moreprecise the BODE index is than the FEV1 alone, wecomputed the C statistics29 for a model containingFEV1 or the BODE score as the sole independentvariable. We compared the survival times and esti-mated the probabilities of death up to 52 months.In these analyses, the C statistic is a mathematicalfunction of the sensitivity and specificity of theBODE index in classifying patients by means of theCox model as either dying or surviving. The nullvalue for the C statistic is 0.5, with a maximum of29patients (Tables 3 and 4) with all degrees of severityof COPD. The FEV1 was slightly lower among pa-tients in the United States than among those in Ven-ezuela or Spain. The U.S. patients also had morefunctional impairment, more severe dyspnea, andmore coexisting conditions. The 27 patients (4 per-cent) lost to follow-up were evenly distributed ac-cording to the severity of COPD and did not differsignificantly from the rest of the cohort with respectto any measured characteristic. There were 162deaths (26 percent) over a median follow-up of 28months (range, 4 to 68). The majority of patients(61 percent) died of respiratory insufficiency, 14percent died of myocardial infarction, 12 percentof lung cancer, and the rest of miscellaneouscauses. The BODE score was lower among survi-vors than among those who died from any cause(3.7±2.2 vs. 5.9±2.6, P<0.005). The score was alsolower among survivors than among those whodied of respiratory causes, and the difference be-tween the scores was larger (3.6±2.2 vs. 6.7±2.3,P<0.001).Table 5 shows the BODE index as a predictor ofdeath from any cause after correction for coexistingconditions. There were significantly more deathsin the United States (32 percent) than in Spain (15percent) or Venezuela (13 percent) (P<0.001). How-ever, when the analysis was done separately foreach country, the predictive power of the BODE in-dex was similar; therefore, the data are presentedtogether. Table 5 shows that the BODE index wasalso a predictor of death from respiratory causesafter correction for coexisting conditions (hazardratio, 1.63; 95 percent confidence interval, 1.48 to1.80; P<0.001). The Kaplan–Meier analysis of sur-*Because of rounding, percentages do not total 100. Thethree stages of chronic obstructive pulmonary disease(COPD) were defined by the American Thoracic Society.FEV1 denotes forced expiratory volume in one second.†Higher scores on the body-mass index, degree of airflowobstruction and dyspnea, and exercise capacity (BODE)index indicate a greater risk of death. Quartile 1 was de-fined by a score of 0 to 2, quartile 2 by a score of 3 to 4,quartile 3 by a score of 5 to 6, and quartile 4 by a scoreof 7 to 10.n engl j med 350; march 4, 2004n engl j med 350;10march 4, 2004 a multidimensional grading system in chronic obstructive pulmonary disease1009vival (Fig. 1A) shows that each quartile increase in the BODE score was associated with increased mor-tality (P<0.001). Thus, the highest quartile (a BODE score of 7 to 10) was associated with a mortality rate of 80 percent at 52 months. These same data are shown in Figure 1B in relation to the severity of COPD according to the staging system of the Amer-ican Thoracic Society. The C statistic for the ability of the BODE index to predict the risk of death was 0.74, as compared with a value of 0.65 with the use of FEV 1 alone (expressed as a percentage of the pre-dicted value). The computation of 2000 bootstrap samples for these data and estimation of the haz-ard ratios for death indicated that for each one-point increment in the BODE score the hazard ratio for death from any cause was 1.34 (95 percent confi-dence interval, 1.26 to 1.42) and the hazard ratio for death from a respiratory cause was 1.62 (95 per-the BODE index — and validated its use by show-ing that it is a better predictor of the risk of death from any cause and from respiratory causes than is the FEV 1 alone. We believe that the BODE index is useful because it includes one domain that quan-tifies the degree of pulmonary impairment (FEV 1 ),one that captures the patient’s perception of symp-toms (the MMRC dyspnea scale), and two indepen-dent domains (the distance walked in six minutes and the body-mass index) that express the systemic consequences of COPD. The FEV 1 is essential for the diagnosis and quantification of the respirato-ry impairment resulting from COPD. 1,3,4 In addi-tion, the rate of decline in FEV 1 is a good marker of disease progression and mortality. 18,19 Howev-er, the FEV 1 does not adequately reflect all the sys-temic manifestations of the disease. For example,the FEV 1 correlates weakly with the degree of dys-pnea, 20 and the change in FEV 1 does not reflect the rate of decline in patients’ health. 30 More impor-tant, prospective observational studies of patients with COPD have found that the degree of dyspnea 8 and health-status scores 31 are more accurate pre-dictors of the risk of death than is the FEV 1 . Thus,although the FEV 1 is important to obtain and essen-tial in the staging of disease in any patient with COPD, other variables provide useful information that can improve the comprehensibility of the eval-uation of patients with COPD. Each variable should*Plus–minus values are means ±SD.†Analysis of variance was used to calculate the P values.‡Scores on the modified Medical Research Council (MMRC) dyspnea scale can range from 0 to 4, with a score of 4 indicating that the patient is too breathless to leave the house or becomes breathless when dressing or undressing.§Scores on the Charlson index can range from 0 to 33, with higher scores indi-cating more coexisting conditions.¶Scores on the body-mass index, degree of airflow obstruction and dyspnea, and exercise capacity (BODE) index can range from 0 to 10, with higher scores indicating a greater risk of death.*The Cox proportional-hazards models for death from any cause include 162 deaths. The Cox proportional-hazards models for death from specific respira-tory causes include 96 deaths. Model I includes the body-mass index, degree of airflow obstruction and dyspnea, and exercise capacity (BODE) index alone. The hazard ratio is for each one-point increase in the BODE score. Model II includes coexisting conditions as expressed by each one-point increase in the Charlson index. CI denotes confidence interval.The new england journal of medicine1010correlate independently with the prognosis ofCOPD, should be easily measurable, and shouldserve as a surrogate for other potentially importantvariables.In the BODE index, we included two descriptorsof systemic involvement in COPD: the body-massindex and the distance walked in six minutes. Bothare simply obtained and independently predict therisk of death.7,9,10 It is likely that they share somecommon underlying physiological determinants,but the distance walked in six minutes contains adegree of sensitivity not provided by the body-massindex. The six-minute–walk test is simple to per-form and has been standardized.12 Its use as a clin-ical tool has gained acceptance, since it is a goodpredictor of the risk of death among patients withother chronic diseases, including congestive heartfailure23 and pulmonary hypertension.24 Indeed, thedistance walked in six minutes has been acceptedas a good outcome measure after interventions suchas pulmonary rehabilitation.32 The body-mass in-dex was also an independent predictor of the riskof death and was therefore included in the BODEindex. We evaluated the independent prognosticpower of body-mass index in our cohort using dif-ferent thresholds and found that values below 21were associated with an increased risk of death, anobservation similar to that reported by Landbo andcoworkers in a large population study.10The Global Initiative for Chronic ObstructiveLung Disease and the American Thoracic Societyrecommend that a patient’s perception of dyspneabe included in any new staging system for COPD.1,3Dyspnea represents the most disabling symptomof COPD; the degree of dyspnea provides informa-tion regarding the patient’s perception of illnessand can be measured. The MMRC dyspnea scale issimple to administer and correlates with other dys-pnea scales20 and with scores of health status.21Furthermore, in a large cohort of prospectively fol-lowed patients with COPD, which used the thresh-old values included in the BODE index, the scoreon the MMRC dyspnea scale was a better predictorof the risk of death than was the FEV1.8The BODE index combines the four variables bymeans of a simple scale. We also explored whetherweighting the variables included in the index im-proved the predictive power of the BODE index. In-terestingly, it failed to do so, most likely becauseeach variable included has already proved to be agood predictor of the outcome of COPD.Our study had some limitations. First, relative-ly few women were recruited, even though enroll-ment was independent of sex. It probably reflectsthe problem of the underdiagnosis of COPD inwomen. Second, there were differences among thethree countries. For example, patients in the UnitedStates had a higher mortality rate, more severe dys-pnea, more functional limitations, and more co-n engl j med 350; march 4, 2004n engl j med 350; march 4, 2004a multidimensional grading system in chronic obstructive pulmonary disease1011existing conditions than patients in Venezuela or Spain, even though the severity of airflow obstruc-tion was relatively similar among the patients as a whole. The reasons for these differences are un-known, because there have been no systematic com-parisons of the regional manifestations of COPD.In all three countries, the BODE index was the best predictor of survival, an observation that renders our findings widely applicable.Three studies have reported the effects of the grouping of variables to express the various do-mains affected by COPD.33-35 These studies did not include variables now known to be important pre-dictors of outcome, such as the body-mass index.However, as we found in our study, they showedthat the FEV 1, the degree of dyspnea, and exercise performance provide independent information regarding the degree of compromise in patients with COPD.Besides its excellent predictive power with re-gard to outcome, the BODE index is simple to cal-culate and requires no special equipment. This makes it a practical tool of potentially widespread applicability. Although the BODE index is a predic-tor of the risk of death, we do not know whether it will be a useful indicator of the outcome in clinical trials, the degree of utilization of health care re-sources, or the clinical response to therapy.We are indebted to Dr. Gordon L. Snider, whose guidance, com-ments, and criticisms were fundamental to the final manuscript.1.Pauwels RA, Buist AS, Calverley PM,Jenkins CR, Hurd SS. Global strategy for the diagnosis, management, and prevention of chronic obstructive pulmonary disease:NHLBI/WHO Global Initiative for Chronic Obstructive Lung Disease (GOLD) Work-shop summary. Am J Respir Crit Care Med 2001;163:1256-76.2.Murray CJL, Lopez AD. Mortality by cause for eight regions of the world: Global Burden of Disease Study. Lancet 1997;349:1269-76.3.Definitions, epidemiology, pathophys-iology, diagnosis, and staging. Am J Respir Crit Care Med 1995;152:Suppl:S78-S83.4.Siafakas NM, Vermeire P, Pride NB, et al. Optimal assessment and management of chronic obstructive pulmonary disease (COPD). Eur Respir J 1995;8:1398-420.5.Nocturnal Oxygen Therapy Trial Group.Continuous or nocturnal oxygen therapy in hypoxemic chronic obstructive pulmonary disease: a clinical trial. Ann Intern Med 1980;93:391-8.6.Intermittent positive pressure breathing therapy of chronic obstructive pulmonary disease: a clinical trial. Ann Intern Med 1983;99:612-20.7.Gerardi DA, Lovett L, Benoit-Connors ML, Reardon JZ, ZuWallack RL. Variables re-lated to increased mortality following out-patient pulmonary rehabilitation. Eur Res-pir J 1996;9:431-5.8.Nishimura K, Izumi T, Tsukino M, Oga T. Dyspnea is a better predictor of 5-year sur-vival than airway obstruction in patients with COPD. Chest 2002;121:1434-40.9.Schols AM, Slangen J, Volovics L, Wout-ers EF. Weight loss is a reversible factor in the prognosis of chronic obstructive pulmo-nary disease. Am J Respir Crit Care Med 1998;157:1791-7.ndbo C, Prescott E, Lange P, Vestbo J,Almdal TP. Prognostic value of nutritional status in chronic obstructive pulmonary dis-ease. Am J Respir Crit Care Med 1999;160:1856-61.11.American Thoracic Society Statement.Lung function testing: selection of reference values and interpretative strategies. Am Rev Respir Dis 1991;144:1202-18.12.ATS Committee on Proficiency Stan-dards for Clinical Pulmonary Function Lab-oratories. ATS statement: guidelines for the six-minute walk test. Am J Respir Crit Care Med 2002;166:111-7.13.Mahler D, Wells C. Evaluation of clinical methods for rating dyspnea. Chest 1988;93:580-6.14.Charlson M, Szatrowski T, Peterson J,Gold J. Validation of a combined comor-bidity index. J Clin Epidemiol 1994;47:1245-51.15.Ferrer M, Alonso J, Morera J, et al. Chron-ic obstructive pulmonary disease stage and health-related quality of life. Ann Intern Med 1997;127:1072-9.16.Dewan NA, Rafique S, Kanwar B, et al.Acute exacerbation of COPD: factors associ-ated with poor treatment outcome. Chest 2000;117:662-71.17.Friedman M, Serby CW , Menjoge SS,Wilson JD, Hilleman DE, Witek TJ Jr. Phar-macoeconomic evaluation of a combination of ipratropium plus albuterol compared with ipratropium alone and albuterol alone in COPD. Chest 1999;115:635-41.18.Anthonisen NR, Wright EC, Hodgkin JE. Prognosis in chronic obstructive pulmo-nary disease. Am Rev Respir Dis 1986;133:14-20.19.Burrows B. Predictors of loss of lung function and mortality in obstructive lung diseases. Eur Respir Rev 1991;1:340-5.20.Mahler DA, Weinberg DH, Wells CK ,Feinstein AR. The measurement of dyspnea:contents, interobserver agreement, and phys-iologic correlates of two new clinical index-es. Chest 1984;85:751-8.21.Hajiro T, Nishimura K, Tsukino M, Ike-da A, Koyama H, Izumi T. Comparison of discriminative properties among disease-specific questionnaires for measuring health-related quality of life in patients with chronic obstructive pulmonary disease. Am J Respir Crit Care Med 1998;157:785-90.22.Szekely LA, Oelberg DA, Wright C, et al.Preoperative predictors of operative mor-bidity and mortality in COPD patients under-going bilateral lung volume reduction sur-gery. Chest 1997;111:550-8.23.Shah M, Hasselblad V , Gheorgiadis M,et al. Prognostic usefulness of the six-min-ute walk in patients with advanced conges-tive heart failure secondary to ischemic and nonischemic cardiomyopathy. Am J Car-diol 2001;88:987-93.24.Miyamoto S, Nagaya N, Satoh T, et al.Clinical correlates and prognostic signifi-cance of six-minute walk test in patients with primary pulmonary hypertension: compari-son with cardiopulmonary exercise testing.Am J Respir Crit Care Med 2000;161:487-92.25.Redelmeier DA, Bayoumi AM, Gold-stein RS, Guyatt GH. Interpreting small dif-ferences in functional status: the Six Minute Walk test in chronic lung disease patients.Am J Respir Crit Care Med 1997;155:1278-82.26.Decramer M, Gosselink R, Troosters T,Verschueren M, Evers G. Muscle weakness is related to utilization of health care resourc-es in COPD patients. Eur Respir J 1997;10:417-23.27.Cox DR. Regression models and life-tables. J R Stat Soc [B] 1972;34:187-220.28.Harrell FE Jr, Lee KL, Mark DB. Multi-variate prognostic models: issues in devel-oping models, evaluating assumptions and adequacy, and measuring and reducing er-rors. Stat Med 1996;15:361-87.29.Nam B-H, D’Agostino R. Discrimina-tion index, the area under the ROC curve. In:Huber-Carol C, Balakrishnan N, Nikulin MS,Mesbah M, eds. Goodness-of-fit tests and。
基于姿态估计与GRU网络的人体康复动作识别

第47卷第1期Vol.47No.1计算机工程Computer Engineering2021年1月January2021基于姿态估计与GRU网络的人体康复动作识别闫航1,2,陈刚1,2,佟瑶2,3,姬波1,胡北辰1(1.郑州大学信息工程学院,郑州450001;2.郑州大学互联网医疗与健康服务协同创新中心,郑州450001;3.郑州大学护理与健康学院,郑州450001)摘要:康复锻炼是脑卒中患者的重要治疗方式,为提高康复动作识别的准确率与实时性,更好地辅助患者在居家环境中进行长期康复训练,结合姿态估计与门控循环单元(GRU)网络提出一种人体康复动作识别算法Pose-AMGRU。
采用OpenPose姿态估计方法从视频帧中提取骨架关节点,经过姿态数据预处理后得到表达肢体运动的关键动作特征,并利用注意力机制构建融合三层时序特征的GRU网络实现人体康复动作分类。
实验结果表明,该算法在KTH和康复动作数据集中的识别准确率分别为98.14%和100%,且在GTX1060显卡上的运行速度达到14.23frame/s,具有较高的识别准确率与实时性。
关键词:康复训练;动作识别;姿态估计;门控循环单元;注意力机制开放科学(资源服务)标志码(OSID):中文引用格式:闫航,陈刚,佟瑶,等.基于姿态估计与GRU网络的人体康复动作识别[J].计算机工程,2021,47(1):12-20.英文引用格式:YAN Hang,CHEN Gang,TONG Yao,et al.Human rehabilitation action recognition based on pose estimation and GRU network[J].Computer Engineering,2021,47(1):12-20.Human Rehabilitation Action Recognition Based onPose Estimation and GRU NetworkYAN Hang1,2,CHEN Gang1,2,TONG Yao2,3,JI Bo1,HU Beichen1(1.College of Information Engineering,Zhengzhou University,Zhengzhou450001,China;2.Internet Medical and Health Service Collaborative Innovation Center,Zhengzhou University,Zhengzhou450001,China;3.College of Nursing and Health,Zhengzhou University,Zhengzhou450001,China)【Abstract】Rehabilitation exercise is an important treatment method for stroke patients.This paper proposes a rehabilitation action recognition algorithm,Pose-AMGRU,which combines pose estimation with Gated Recurrent Unit (GRU)in order to improve the accuracy and real-time performance of rehabilitation action recognition,and thus assist patients in in-home long-term rehabilitation training.The algorithm uses OpenPose pose estimation method to extract the skeleton joints from video frames,and the pose data is preprocessed to obtain the key action features that represent body movement.Then a GRU network with three-layer time series features is constructed by using the attention mechanism to realize rehabilitation action classification.Experimental results on KTH dataset and rehabilitation action dataset show that the proposed algorithm increases the recognition accuracy to98.14%and100%,and its running speed on GTX1060 reaches14.23frame/s,which demonstrates its excellent recognition accuracy and real-time performance.【Key words】rehabilitation training;action recognition;pose estimation;Gated Recurrent Unit(GRU);attention mechanism DOI:10.19678/j.issn.1000-3428.00582010概述脑卒中发病人数逐年上升,已成为威胁全球居民生命健康的重大疾病,具有极高的致残率,其中重度残疾者约占40%[1]。
美国服装标准尺寸表

美国服装标准尺寸表服装尺码换算参照表女装(外衣、裙装、恤衫、上装、套装)标准尺码明细中国(cm) 160-165 / 84-86 165-170 / 88-90 167-172 / 92-96 168-173 / 98-102 170-176 / 106-110 国际XS S M L XL美国2 4-6 8-10 12-14 16-18欧洲34 34-36 38-40 42 44男装(外衣、恤衫、套装)标准尺码明细中国(cm) 165 / 88-90 170 / 96-98 175 / 108-110 180 / 118-122 185 / 126-130国际S M L XL XXL男装(衬衫)标准尺码明细中国(cm) 36 - 37 38 - 39 40 - 42 43 - 44 45 - 47国际S M L XL XXL男装(裤装)标准尺码明细尺码42 44 46 48 50腰围68 - 72 cm 71 - 76 cm 75 - 80 cm 79 - 84 cm 83 - 88 cm裤度99 cm 101.5 cm 104 cm 106.5 cm 109 cm看不懂的还可以参照下面的:服装尺寸表男仕服装尺码分类小码中码大码加大码身高165 170 175 180胸围84 90 96 102腰围75 81 87 93臀围88 90 92 100女仕服装尺码分类小码中码大码加大码身高155 160 165 170胸围80 84 88 92腰围60 64 68 72臀围84 88 92 96儿童服装尺码分类小码中码大码加大码适合年龄0-2岁2-4岁5-7岁7-10岁身高80 110-110 110-130 140-150胸围50 55 60-65 70腰围40 42 44 46臀围55 60 65-70 75美国对服装标志的有关规定美国海关边境保护局最近出版多份刊物,就服装标志规定提供指引和资料,并阐释针织成形服装、手套以及非针织或织连指手套的关税分类方法。
生物医学研究的统计学方法 课后答案(案例分析)
第1章绪论案例辨析及参考答案案例1-1某研究者的论文题目为“大学生身心健康状况及其影响因素研究”,以某地职业技术学院理、工、文、医学生(三年制)为研究对象,理、工、文、医学生分别挑选了60、38、19和46人,以问卷方式调查每位学生的一般健康状况、焦虑程度、抑郁程度等。
得出的结论是:“大学生身心健康状况不容乐观,学业问题、就业压力、身体状况差、人际交往不良、社会支持不力为主要影响因素”。
请问其结论合理吗?为什么?应该如何?案例辨析①样本不能代表总体。
总体是“大学生”,而样本仅为某地三年制职业技术学院学生;②社会学调查的样本含量显得不足;③“理、工、文、医学生分别挑选……”这种说法中隐含人为“挑选”的意思,不符合统计学要求。
正确做法应在论文的题目中明确调查的时间范围和地点,还应给“大学生”下一个明确的定义,以便确定此次调查的“总体”;对“大学生身心健康状况”可能有影响的因素很多,应结合具体问题拟定出少数最可能有影响的因素(如学科、在学年限等)进行分层随机抽样,以保证样本有较好的代表性;还应根据已知条件找到估计样本含量的计算公式,不可随意确定各学科仅调查几十人;当然,调查表中项目的设置也是十分重要的,此处从略。
案例1-2两种药用于同一种病,A药治疗5例,4例好转;B药治疗50例,36例好转。
结论是:A药优于B药。
请问其结论合理吗?为什么?应该如何?案例辨析①A药样本仅5例,样本含量太少;②得出“A药优于B药”没有交待是否采用了统计学推断方法,若用目测法得出结论,则结论没有说服力;③未明确研究目的和研究结果将被使用的范围。
正确做法①应明确研究目的和研究结果将被使用的范围,若是个别研究者或临床医生想了解这两种药的大致疗效,属于小规模的临床观察,其结论仅供少数人在今后临床实践中参考,其样本含量可能不需要很大,因为观察指标是定性的(有效、无效),一般来说,每个药物组也需要几十例(以不少于20例为宜);若属于新药的Ⅱ期临床试验,那就要严格按有关规定,比较准确地估计出所需要的样本含量,不仅如此,还有很多严格的要求,详见本书中临床试验设计一章;②从明确定义的总体中随机抽样进行实验研究,得到的实验结果不能仅凭数据大小作出判断,应进行假设检验,以提高结论的可信度。
特发性矮身高(矮身材)儿童的骨龄—TW3法和G-P法的分析研究
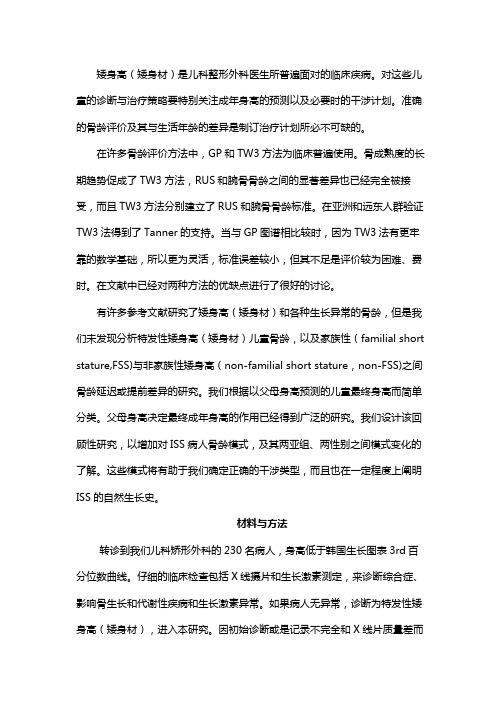
矮身高(矮身材)是儿科整形外科医生所普遍面对的临床疾病。
对这些儿童的诊断与治疗策略要特别关注成年身高的预测以及必要时的干涉计划。
准确的骨龄评价及其与生活年龄的差异是制订治疗计划所必不可缺的。
在许多骨龄评价方法中,GP和TW3方法为临床普遍使用。
骨成熟度的长期趋势促成了TW3方法,RUS和腕骨骨龄之间的显著差异也已经完全被接受,而且TW3方法分别建立了RUS和腕骨骨龄标准。
在亚洲和远东人群验证TW3法得到了Tanner的支持。
当与GP图谱相比较时,因为TW3法有更牢靠的数学基础,所以更为灵活,标准误差较小,但其不足是评价较为困难、费时。
在文献中已经对两种方法的优缺点进行了很好的讨论。
有许多参考文献研究了矮身高(矮身材)和各种生长异常的骨龄,但是我们未发现分析特发性矮身高(矮身材)儿童骨龄,以及家族性(familial short stature,FSS)与非家族性矮身高(non-familial short stature,non-FSS)之间骨龄延迟或提前差异的研究。
我们根据以父母身高预测的儿童最终身高而简单分类。
父母身高决定最终成年身高的作用已经得到广泛的研究。
我们设计该回顾性研究,以增加对ISS病人骨龄模式,及其两亚组、两性别之间模式变化的了解。
这些模式将有助于我们确定正确的干涉类型,而且也在一定程度上阐明ISS的自然生长史。
材料与方法转诊到我们儿科矫形外科的230名病人,身高低于韩国生长图表3rd百分位数曲线。
仔细的临床检查包括X线摄片和生长激素测定,来诊断综合症、影响骨生长和代谢性疾病和生长激素异常。
如果病人无异常,诊断为特发性矮身高(矮身材),进入本研究。
因初始诊断或是记录不完全和X线片质量差而排除的44名病人。
因此,研究包括了2003-2005年就诊的韩国血统186名病人(95男,91女)。
同时取得父母身高,如果父母身高低于韩国标准身高的3rd百分位数,确定为矮身高(矮身材)。
将病人分为两组,组A为FSS,由有矮父母(一方或双方)身高的儿童组成,共有100名病人(55男,4.8-18岁;45名女,4.1-16岁)。
人体工程学第2章 人体尺寸测量与设计应用

615
3.坐姿眼高
749
4.坐姿肩高
557
5.坐姿肘高
228
6.坐姿大腿厚
112
7.坐姿膝高
456
8.小腿加足高
383
9.坐深
421
10.臀膝距
515
11.坐姿下肢长
921
男(18~60岁)
50
95
908
958
657
701
798
847
598
641
263
298
130
151
493
532
413
448
457
女(18~55岁)
50
95
1570
1659
52
66
284
308
213
234
438
476
344
376
常用人体尺寸参数
B、立姿人体尺寸。该标准中提供的成年人立姿人体尺寸有:眼高、肩高、肘高、手功能高、会阴高、胫骨点高,这六 项立姿人体尺寸的部位见图,我国成年人立姿人体尺寸见表。
百分位数
1.眼高 2.肩高 3.肘高 4.手功能高 5.会阴高 6.胫骨点高
人体测量
③ 正态分布 考察一个群体,可以发现人群的尺度是具有一定分布规律的,考察的群体越大,这个规律就越明显。人体尺度,符合正 态分布规律。以中国男性身高的抽样分析数据为例,身高在170cm左右的人最多。身高离这个数据越远的人数越少,形成 一个中间大两头小的“钟”形曲线,这种分布规律叫做”正态分布”或“高斯分布”。 ④ 平均值、中值和众数 平均值表示全部被测数值的算术平均值。中值表示全部受测人数有一半的身高在这个数值以下,另一半在这个数值以上。 众数则表示测得人数最多的那个身高尺寸。 ⑤ 标准差 平均值仅表示了被测数值集中于哪一点,标准差则反应了数值的集中和离散程度。在人体测量中,不仅要测得平均值, 还要通过一定的数值处理得到标准差的数值。
基于形态参数的青年女性乳房体积预测

浙江理工大学学报(自然科学版),第39卷,第1期,20:18年1月Journal of Zhejiang Sci-Tech University(Natural Sciences)V ol.39,No. 1,Jan.2018DQI:10. 3969/j.issn. 1673-3851 (n).2018. 01. 005基于形态参数的青年女性乳房体积预测马静8,詹诗画8,邹奉元^(浙江理工大学,a.服装学院;〕.浙江省服装工程技术研究中心,杭州310018)摘要:为建立青年女性乳房体积与形态参数的预测模型,选取了235名18〜25岁的在校青年未孕女性进行三维人体扫描,利用逆向工程软件绘制乳房轮廓线,提取乳房三维模型进行N U R B S曲面拟合,在P r o/E软件中对曲面实体化后测量体积。
通过逐步回归分析,建立了乳房体积的预测模型,提出了与乳房体积最为相关的3个形态参数,分别为横奶杯弧线长、纵奶杯弧线长和胸围差,用于指导文胸罩杯的结构设计。
随机选取10名在校青年未孕女性作为测试样本对预测模型进行验证,实验验证发现:该预测模型的调整圮系数为0. 91 7,h g.小于0. 01,预测误差在7%以内,预测效果较好。
关键词:乳房体积;乳房三维模型;形态参数;逐步回归中图分类号:TS941. 17 文献标志码:A 文章编号:1673-3851 (2018) 01-0025-060引言量身定制在服装成衣领域中广泛使用,而文胸 作为女性服装的特殊代表,其穿着的舒适性及合体 性在国内外受到越来越多的关注。
Y o u n g等[1]和Boyes等[2]在其研究中发现70 %的英国女性(尤其 是乳房较大的女性)穿着的文胸不合体,北服一爱慕 人体工学研究所曾记录有75. 8%的女性穿着文胸 号型与实际不符[3]。
文胸的舒适性与合体性是许多 女性的一个困扰,L e e等[]发现文胸穿着不合体的 原因是大多数女性并不知道她们真正的乳房大小和 形状。