曼昆经济学原理试题Chapter 08a
经济学原理 曼昆(宏观部分答案)
经济学原理曼昆(宏观部分答案)第八篇宏观经济学的数据第二十三章一国收入的衡量复习题 1 .解释为什么一个经济的收入必定等于其支出? 答:对一个整体经济而言,收入必定等于支出。
因为每一次交易都有两方:买者和卖者。
一个买者的1 美元支出是另一个卖者的1 美元收入。
因此,交易对经济的收入和支出作出了相同的贡献。
由于GDP 既衡量总收入 135 又衡量总支出,因而无论作为总收入来衡量还是作为总支出来衡量,GDP 都相等. 2 .生产一辆经济型轿车或生产一辆豪华型轿车,哪一个对GDP 的贡献更大?为什么? 答:生产一辆豪华型轿车对GDP 的贡献大。
因为GDP 是在某一既定时期一个国家内生产的所有最终物品与劳务的市场价值。
由于市场价格衡量人们愿意为各种不同物品支付的量,所以市场价格反映了这些物品的市场价值。
由于一辆豪华型轿车的市场价格高于一辆经济型轿车的市场价格,所以一辆豪华型轿车的市场价值高于一辆经济型轿车的市场价值,因而生产一辆豪华型轿车对GDP 的贡献更大.3 .农民以2 美元的价格把小麦卖给面包师。
面包师用小麦制成面包,以3 美元的价格出售。
这些交易对 GDP 的贡献是多少呢? 答:对GDP 的贡献是3 美元。
GDP 只包括最终物品的价值,因为中间物品的价值已经包括在最终物品的价格中了.4 .许多年以前,Peggy 为了收集唱片而花了500 美元。
今天她在旧货销售中把她收集的物品卖了100 美元.这种销售如何影响现期GDP? 答:现期GDP 只包括现期生产的物品与劳务,不包括涉及过去生产的东西的交易。
因而这种销售不影响现期GDP.5 .列出GDP 的四个组成部分。
各举一个例子.答:GDP 等于消费(C)+投资(I)+政府购买(G)+净出口(NX) 消费是家庭用于物品与劳务的支出,如汤姆一家人在麦当劳吃午餐.投资是资本设备、存货、新住房和建筑物的购买,如通用汽车公司建立一个汽车厂.政府购买包括地方政府、州政府和联邦政府用于物品与劳务的支出,如海军购买了一艘潜艇.净出口等于外国人购买国内生产的物品(出口)减国内购买的外国物品(进口)。
曼昆-微观经济学-第六版-第八章答案
第八章应用:赋税的代价复习题1.当对一种物品征税时,消费者和生产者剩余会发生什么变动?与税收收入相比较,消费者剩余和生产者剩余如何变动?解释原因.答:当对一种物品征税时,消费者和生产者剩余都会减少。
消费者剩余和生产者剩余的减少大于税收收入的增加。
税收扭曲了消费者和生产者的激励,引起市场配置资源时的无效率。
2.画出有物品销售税的供求图。
在图上标注无谓损失,标明税收收入。
答:如P163图8-3所示,对一种物品征税减少了消费者剩余(面积B+C表示减少量)和生产者剩余(面积D+E表示减少量)。
生产者和消费者剩余的减少大于税收收入(用面积B+D表示),税收引起了无谓损失(用面积C+E表示).3.供给与需求弹性如何影响税收的无谓损失?为什么有这种影响?答:供给与需求曲线的弹性越大,税收的无谓损失越大;供给与需求曲线的弹性越小,税收的无谓损失越小。
因为供给和需求弹性衡量买者和卖者对价格变动的反应程度,决定了税收扭曲会使市场结果有多大变动。
4.当税收增加时,无谓损失和税收收入有什么变动?答:当税收增加时,无谓损失增加,并且无谓损失的增加要快于税收规模的增加。
税收增加时,税收收入先增加,然后随着税收规模越来越大,市场收缩非常之大,以至于税收收入开始减少。
问题与应用1.比萨饼市场的特征是需求曲线向右下方倾斜,供给曲线向右上方倾斜.A.画出竞争市场均衡图。
标出价格、数量、消费者剩余和生产者剩余.存在无谓损失吗?解释原因。
答:没有无谓损失。
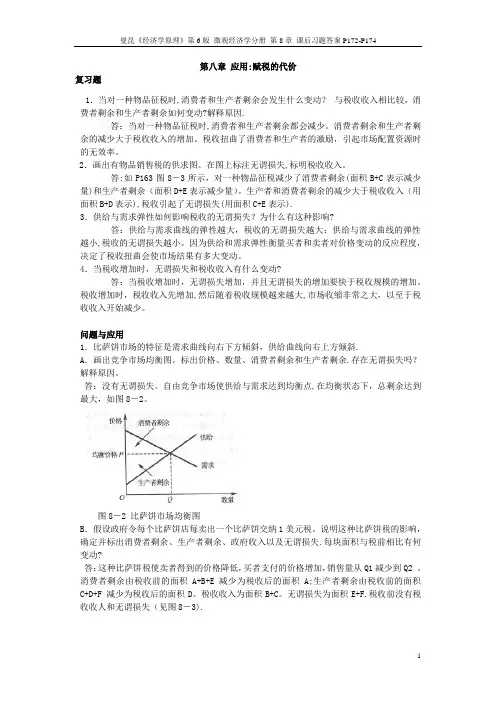
自由竞争市场使供给与需求达到均衡点,在均衡状态下,总剩余达到最大,如图8-2。
图8-2 比萨饼市场均衡图B.假设政府令每个比萨饼店每卖出一个比萨饼交纳1美元税。
说明这种比萨饼税的影响,确定并标出消费者剩余、生产者剩余、政府收入以及无谓损失.每块面积与税前相比有何变动?答:这种比萨饼税使卖者得到的价格降低,买者支付的价格增加,销售量从Q1减少到Q2 。
消费者剩余由税收前的面积A+B+E 减少为税收后的面积A;生产者剩余由税收前的面积C+D+F 减少为税收后的面积D。
曼昆经济学原理试题及答案
曼昆经济学原理试题及答案一、名词解释(每小题 5 分,共 50 分)机会成本科斯定理搭便车囚徒困境菲利普斯曲线供给侧凯恩斯革命看不见的手比较优势外部性二、简述题(第 11、12、13 题各 12 分, 14 题 14 分,共 50 分)1.简要描述银行存款的创建过程。
2.简述失业的根源及其类型。
3.简要描述节俭的对与错。
4.根据有关经济学原理,简析我国森林减少、珍稀动物来绝的原因及解决的措施。
三、论述题(每小题 25 分,共计 50 分)1.讨论人民币升值对中国经济的影响。
2.论述政府公共投资对国民经济的作用。
一、名词解释(每一个子话题 5 分,共 50 分)1.机会成本:指人们利用一定资源获得某种收入时所抛却的在其他可能的用途中所能够获取的最大收入。
生产一单位的某种商品的机会成本是指生产者所抛却的使用相同的生产要素在其他生产用途中所能得到的最高收入。
机会成本的存在需要三个前提条件。
第一,资源是稀缺的;第二,资源具有多种生产用途;第三,资源的投无限制访问。
在从机会成本的角度审视生产过程时,创造商需要将生产要素投入到效益最大的项目中,以避免生产浪费,实现资源的最优配置。
机会成本的概念是基于资源的稀缺性。
在经济资源稀缺的前提下,当一个社会或者企业利用一定的经济资源生产一定数量的一种或者几种产品时,这些经济资源不能同时用于其他生产用途。
也就是说,这个社会或者这个企业能够获得的一定数量的产品收入,是以抛却利用同样的经济资源生产其他产品所能获得的收入为代价的。
这也是机会成本的原因。
因此,一个社会生产一种产品的实际成本是它不能生产其他产品的成本。
因此,机会成本的含义是,任何生产资源或者生产要素一般都有各种不同的方式或者机会,也就是说,它可以用于生产各种产品。
然而,当一定数量的特定资源用于生产 a 类产品时,它们不能同时用于生产 B 类产品。
因此,生产一种产品的实际成本是不生产 B 产品的成本,或者等于这种资源生产 B 产品可能获得的最大回报。
曼昆经济学习题解答
曼昆经济学习题解答Ch5 经济增长2⼀、名词解释劳动效率劳动扩⼤型技术进步内⽣增长理论⼆、选择题1.在有⼈⼝增长和技术进步的索洛模型中,稳定状态时每个效率⼯⼈的产出增长率等于:()A.0 B.技术增长率gC.⼈⼝增长率n+技术增长率g D.储蓄率s2.在有⼈⼝增长和技术进步的索洛模型中,稳定状态时每个⼯⼈的产出增长率等于:()A.0 B.技术增长率gC.⼈⼝增长率n+技术增长率g D.储蓄率s3.在⼈⼝增长⽐率为n和劳动扩⼤型技术进步⽐率为g的索洛模型中,每个效率⼯⼈的资本存量变化等于:()A.sf(k) + (d + n + g)k B.sf(k) + (d - n - g)kC.sf(k) - (d + n + g)k D.sf(k) - (d - n - g)k4.下列可以⿎励技术进步的是()A.新产品实⾏专利制度B.对研发的税收激励C.对研发的政府补贴D.以上都是5.索洛模型表明⾼⼈⼝增长率的国家将会有():A.较低的稳定状态⼈均产出⽔平B.较低的稳定状态⼈均产出增长率C.A和B D.较⾼的稳定状态⼈均产出增长率三、问答题1.政府政策为医学研究提供资⾦是⼀个经常被争论的问题。
a.运⽤外部性,社会收益和私⼈收益的概念,讨论政府为什么应该或者不应该为医学研究提供资⾦。
政府怎样才能⿎励私营公司增加研究开⽀?b.如果政府觉得需要对医学研究投⼊更⼤的资⾦,你认为政府是直接投资研究项⽬还是对投资这些研究私营公司采⽤激励政策更好?你认为这两个计划分别会对药品⽣产所产⽣的费⽤发⽣怎样的影响?2.⽐较两部门内⽣增长模型和索洛模型。
两个模型的相同之处是什么?两个模型的假设有不同?你觉得哪个更实际?请解释。
3.在索洛模型中,谈谈技术进步、资本存量的增长、⼈⼝的增长对稳定状态的⼈均收⼊增长率的影响?4.为了确定⼀个经济的资本⼤于还是⼩于黄⾦规则稳定状态,你需要什么数据?5.决策者可以如何影响⼀国的储蓄率?6.过去40年间⽣产率的增长率发⽣了什么变动?你如何解释这种现象、7.内⽣增长理论如何在没有外⽣技术进步的假设的情况下解释长期增长?这种解释与索洛模型有什么不同?8.证明下列有关⼈⼝增长与技术进步时稳定状态的每⼀种表述。
曼昆经济学原理英文版文案加习题答案8章说课讲解

曼昆经济学原理英文版文案加习题答案8章WHAT’S NEW IN THE S EVENTH EDITION:A new In the News box on “The Tax Debate ” has been added.LEARNING OBJECTIVES:By the end of this chapter, students should understand:➢ how taxes reduce consumer and producer surplus.➢ the meaning and causes of the deadweight loss from a tax.➢ why some taxes have larger deadweight losses than others.➢ how tax revenue and deadweight loss vary with the size of a tax.CONTEXT AND PURPOSE:Chapter 8 is the second chapter in a three-chapter sequence dealing with welfare economics. In theprevious section on supply and demand, Chapter 6 introduced taxes and demonstrated how a tax affects the price and quantity sold in a market. Chapter 6 also described the factors that determine how the burden of the tax is divided between the buyers and sellers in a market. Chapter 7 developed welfare economics —the study of how the allocation of resources affects economic well-being. Chapter 8 combines the lessons learned in Chapters 6 and 7 and addresses the effects of taxation on welfare. Chapter 9 will address the effects of trade restrictions on welfare.The purpose of Chapter 8 is to apply the lessons learned about welfare economics in Chapter 7 to the issue of taxation that was addressed in Chapter 6. Students will learn that the cost of a tax to buyers and sellers in a market exceeds the revenue collected by the government. Students will also learn about the factors that determine the degree by which the cost of a tax exceeds the revenue collected by the government.APPLICATION: THE COSTS OF TAXATIONKEY POINTS:• A tax on a good reduces the welfare of buyers and sellers of the good, and the reduction in consumer and producer surplus usually exceeds the revenue raised by the government. The fall in total surplus—the sum of consumer surplus, producer surplus, and tax revenue—is called the deadweight loss of the tax.•Taxes have deadweight losses because they cause buyers to consume less and sellers to produce less, and these changes in behavior shrink the size of the market below the level that maximizes total surplus. Because the elasticities of supply and demand measure how much market participants respond to market conditions, larger elasticities imply larger deadweight losses.•As a tax grows larger, it distorts incentives more, and its deadweight loss grows larger.Because a tax reduces the size of a market, however, tax revenue does not continuallyincrease. It first rises with the size of a tax, but if the tax gets large enough, tax revenue starts to fall.CHAPTER OUTLINE:I. The Deadweight Loss of TaxationA. Remember that it does not matter who a tax is levied on; buyers and sellers will likely share inthe burden of the tax.B. If there is a tax on a product, the price that a buyer pays will be greater than the price the sellerreceives. Thus, there is a tax wedge between the two prices and the quantity sold will be smaller if there was no tax.Figure 1C. How a Tax Affects Market Participants1. We can measure the effects of a tax on consumers by examining the change in consumersurplus. Similarly, we can measure the effects of the tax on producers by looking at the change in producer surplus.2. However, there is a third party that is affected by the tax —the government, which gets total tax revenue of T × Q. If the tax revenue is used to provide goods and services to the public,then the benefit from the tax revenue must not be ignored.3. Welfare without a Taxa. Consumer surplus is equal to: A + B + C.b. Producer surplus is equal to: D + E + F.c. Total surplus is equal to: A + B + C + D + E + F.4. Welfare with a TaxFigure 2 If you spent enough time covering consumer and producer surplus in Chapter7, students should have an easy time with this concept.Figure 3a. Consumer surplus is equal to: A.b. Producer surplus is equal to: F.c. Tax revenue is equal to: B + D.d. Total surplus is equal to: A + B + D + F.5. Changes in Welfarea. Consumer surplus changes by: –(B + C).b. Producer surplus changes by: –(D + E).c. Tax revenue changes by: +(B + D).d. Total surplus changes by: –(C + E).6. Definition of deadweight loss: the fall in total surplus that results from a marketdistortion, such as a tax.D. Deadweight Losses and the Gains from Trade1. Taxes cause deadweight losses because they prevent buyers and sellers from benefiting fromtrade.2. This occurs because the quantity of output declines; trades that would be beneficial to boththe buyer and seller will not take place because of the tax.3. The deadweight loss is equal to areas C and E (the drop in total surplus).4. Note that output levels between the equilibrium quantity without the tax and the quantitywith the tax will not be produced, yet the value of these units to consumers (represented by the demand curve) is larger than the cost of these units to producers (represented by thesupply curve).II. The Determinants of the Deadweight LossA. The price elasticities of supply and demand will determine the size of the deadweight loss that occurs from a tax.1. Given a stable demand curve, the deadweight loss is larger when supply is relatively elastic.2. Given a stable supply curve, the deadweight loss is larger when demand is relatively elastic.B. Case Study: The Deadweight Loss Debate1. Social Security tax and federal income tax are taxes on labor earnings. A labor tax places a tax wedge between the wage the firm pays and the wage that workers receive.2. There is considerable debate among economists concerning the size of the deadweight loss from this wage tax.Figure 53. The size of the deadweight loss depends on the elasticity of labor supply and demand, andthere is disagreement about the magnitude of the elasticity of supply.a. Economists who argue that labor taxes do not greatly distort market outcomes believethat labor supply is fairly inelastic.b. Economists who argue that labor taxes lead to large deadweight losses believe that laborsupply is more elastic.III. Deadweight Loss and Tax Revenue as Taxes VaryA. As taxes increase, the deadweight loss from the tax increases.B. In fact, as taxes increase, the deadweight loss rises more quickly than the size of the tax.1. The deadweight loss is the area of a triangle and the area of a triangle depends on the square of its size.2. If we double the size of a tax, the base and height of the triangle both double so the area of the triangle (the deadweight loss) rises by a factor of four.C. As the tax increases, the level of tax revenue will eventually fall.D. Case Study: The Laffer Curve and Supply-Side Economics1. The relationship between the size of a tax and the level of tax revenues is called a Laffercurve.2. Supply-side economists in the 1980s used the Laffer curve to support their belief that a dropin tax rates could lead to an increase in tax revenue for the government.3. Economists continue to debate Laffer’s argume nt.a. Many believe that the 1980s refuted Laffer’s theory.b. Others believe that the events of the 1980s tell a more favorable supply-side story.c. Some economists believe that, while an overall cut in taxes normally decreases revenue,some taxpayers may find themselves on the wrong side of the Laffer curve.E. In the News: The Tax Debate1. Recently, policymakers have debated the effects of increasing the tax rate, particularly onhigher-income taxpayers.ALTERNATIVE CLASSROOM EXAMPLE:Draw a graph showing the demand and supply of paper clips. (Draw each curve as a 45-degree line so that buyers and sellers will share any tax equally.) Mark theequilibrium price as $0.50 (per box) and the equilibrium quantity as 1,000 boxes. Show students the areas of producer and consumer surplus.Impose a $0.20 tax on each box. Assume that sellers are required to “pay” the tax to the government. Show students that:▪ the price buyers pay will rise to $0.60.▪ the price sellers receive will fall to $0.40.▪ the quantity of paper clips purchased will fall (assume to 800 units).▪ tax revenue would be equal to $160 ($0.20 800).Have students calculate the area of deadweight loss. (You may have to remindstudents how to calculate the area of a triangle.)2. These two opinion pieces from The Wall Street Journal present both sides of the issue.SOLUTIONS TO TEXT PROBLEMS:Quick Quizzes1. Figure 1 shows the supply and demand curves for cookies, with equilibrium quantity Q 1 andequilibrium price P 1. When the government imposes a tax on cookies, the price to buyers rises to P B , the price received by sellers declines to P S , and the equilibrium quantity falls to Q 2. The deadweight loss is the triangular area below the demand curve and above the supply curve between quantities Q 1 and Q 2. The deadweight loss shows the fall in total surplus that results from the tax.Figure 12. The deadweight loss of a tax is greater the greater is the elasticity of demand. Therefore, a tax on beer would have a larger deadweight loss than a tax on milk because the demand forbeer is more elastic than the demand for milk.B.Rank these taxes from smallest deadweight loss to largest deadweight loss.Lowest deadweight loss —tax on children, very inelastic Then —tax on food. Demand is inelastic; supply is elastic.Third —tax on vacation homes Demand is elastic; short-run supply is inelastic. Most deadweight loss —tax on jewelryDemand is elastic; supply is elastic.C. Is deadweight loss the only thing to consider when designing a tax system? No. This can generate a lively discussion. There are a variety of equity or fairnessconcerns. The taxes on children and on food would be regressive. Each of the taxeswould tax certain households at much higher rates than other households with similarincomes.3. If the government doubles the tax on gasoline, the revenue from the gasoline tax could riseor fall depending on whether the size of the tax is on the upward or downward slopingportion of the Laffer curve. However, if the government doubles the tax on gasoline, you canbe sure that the deadweight loss of the tax rises because deadweight loss always rises as thetax rate rises.Questions for Review1. When the sale of a good is taxed, both consumer surplus and producer surplus decline. Thedecline in consumer surplus and producer surplus exceeds the amount of governmentrevenue that is raised, so society's total surplus declines. The tax distorts the incentives ofboth buyers and sellers, so resources are allocated inefficiently.2. Figure 2 illustrates the deadweight loss and tax revenue from a tax on the sale of a good.Without a tax, the equilibrium quantity would be Q1, the equilibrium price would be P1,consumer surplus would be A + B + C, and producer surplus would be D + E + F. Theimposition of a tax places a wedge between the price buyers pay, P B, and the price sellersreceive, P S, where P B = P S + tax. The quantity sold declines to Q2. Now consumer surplus isA, producer surplus is F, and government revenue is B + D. The deadweight loss of the tax isC+E, because that area is lost due to the decline in quantity from Q1 to Q2.Figure 23. The greater the elasticities of demand and supply, the greater the deadweight loss of a tax.Because elasticity measures the responsiveness of buyers and sellers to a change in price,higher elasticity means the tax induces a greater reduction in quantity, and therefore, agreater distortion to the market.4. Experts disagree about whether labor taxes have small or large deadweight losses becausethey have different views about the elasticity of labor supply. Some believe that labor supplyis inelastic, so a tax on labor has a small deadweight loss. But others think that workers canadjust their hours worked in various ways, so labor supply is elastic, and thus a tax on laborhas a large deadweight loss.5. The deadweight loss of a tax rises more than proportionally as the tax rises. Tax revenue,however, may increase initially as a tax rises, but as the tax rises further, revenue eventuallydeclines.Quick Check Multiple Choice1. a2. b3. c4. a5. b6. aProblems and Applications1. a. Figure 3 illustrates the market for pizza. The equilibrium price is P1, the equilibriumquantity is Q1, consumer surplus is area A + B + C, and producer surplus is area D + E +F. There is no deadweight loss, as all the potential gains from trade are realized; totalsurplus is the entire area between the demand and supply curves: A + B + C + D + E +F.Figure 3b. With a $1 tax on each pizza sold, the price paid by buyers, P B, is now higher than theprice received by sellers, P S, where P B = P S + $1. The quantity declines to Q2, consumersurplus is area A, producer surplus is area F, government revenue is area B + D, anddeadweight loss is area C + E. Consumer surplus declines by B + C, producer surplusdeclines by D + E, government revenue increases by B + D, and deadweight lossincreases by C + E.c. If the tax were removed and consumers and producers voluntarily transferred B + D tothe government to make up for the lost tax revenue, then everyone would be better offthan without the tax. The equilibrium quantity would be Q1, as in the case without thetax, and the equilibrium price would be P1. Consumer surplus would be A + C, becauseconsumers get surplus of A + B + C, then voluntarily transfer B to the government.Producer surplus would be E + F, because producers get surplus of D + E + F, thenvoluntarily transfer D to the government. Both consumers and producers are better offthan the case when the tax was imposed. If consumers and producers gave a little bitmore than B + D to the government, then all three parties, including the government,would be better off. This illustrates the inefficiency of taxation.2. a. The statement, "A tax that has no deadweight loss cannot raise any revenue for thegovernment," is incorrect. An example is the case of a tax when either supply or demand is perfectly inelastic. The tax has neither an effect on quantity nor any deadweight loss, but it does raise revenue.b. The statement, "A tax that raises no revenue for the government cannot have anydeadweight loss," is incorrect. An example is the case of a 100% tax imposed on sellers.With a 100% tax on their sales of the good, sellers will not supply any of the good, sothe tax will raise no revenue. Yet the tax has a large deadweight loss, because it reduces the quantity sold to zero.3. a. With very elastic supply and very inelastic demand, the burden of the tax on rubberbands will be borne largely by buyers. As Figure 4 shows, consumer surplus declinesconsiderably, by area A + B, but producer surplus decreases only by area C+D..Figure 4 Figure 5b.With very inelastic supply and very elastic demand, the burden of the tax onrubber bands will be borne largely by sellers. As Figure 5 shows, consumersurplus does not decline much, just by area A + B, while producer surplus fallssubstantially, by area C + D. Compared to part (a), producers bear much more of the burden of the tax, and consumers bear much less.4. a. The deadweight loss from a tax on heating oil is likely to be greater in the fifth year afterit is imposed rather than the first year. In the first year, the demand for heating oil isrelatively inelastic, as people who own oil heaters are not likely to get rid of them rightaway. But over time they may switch to other energy sources and people buying newheaters for their homes will more likely choose gas or electric, so the tax will have agreater impact on quantity. Thus, the deadweight loss of the tax will get larger over time.b. The tax revenue is likely to be higher in the first year after it is imposed than in the fifthyear. In the first year, demand is more inelastic, so the quantity does not decline asmuch and tax revenue is relatively high. As time passes and more people substitute away from oil, the quantity sold declines, as does tax revenue.5. Because the demand for food is inelastic, a tax on food is a good way to raise revenuebecause it leads to a small deadweight loss; thus taxing food is less inefficient than taxing other things. But it is not a good way to raise revenue from an equity point of view, because poorer people spend a higher proportion of their income on food. The tax would affect them more than it would affect wealthier people.6. a. This tax has such a high rate that it is not likely to raise much revenue. Because of thehigh tax rate, the equilibrium quantity in the market is likely to be at or near zero.b. Senator Moynihan's goal was probably to ban the use of hollow-tipped bullets. In thiscase, the tax could be as effective as an outright ban.7. a. Figure 6 illustrates the market for socks and the effects of the tax. Without a tax, theequilibrium quantity would be Q1, the equilibrium price would be P1, total spending byconsumers equals total revenue for producers, which is P1 x Q1, which equals area B + C + D + E + F, and government revenue is zero. The imposition of a tax places a wedgebetween the price buyers pay, P B, and the price sellers receive, P S, where P B = P S + tax.The quantity sold declines to Q2. Now total spending by consumers is P B x Q2, whichequals area A + B + C + D, total revenue for producers is P S x Q2, which is area C + D,and government tax revenue is Q2 x tax, which is area A + B.b. Unless supply is perfectly elastic or demand is perfectly inelastic, the price received byproducers falls because of the tax. Total receipts for producers fall, because producerslose revenue equal to area B + E + F.Figure 6c. The price paid by consumers rises, unless demand is perfectly elastic or supply isperfectly inelastic. Whether total spending by consumers rises or falls depends on theprice elasticity of demand. If demand is elastic, the percentage decline in quantityexceeds the percentage increase in price, so total spending declines. If demand isinelastic, the percentage decline in quantity is less than the percentage increase in price,so total spending rises. Whether total consumer spending falls or rises, consumer surplusdeclines because of the increase in price and reduction in quantity.8. Figure 7 illustrates the effects of the $2 subsidy on a good. Without the subsidy, theequilibrium price is P1 and the equilibrium quantity is Q1. With the subsidy, buyers pay priceP B, producers receive price P S (where P S = P B + $2), and the quantity sold is Q2. Thefollowing table illustrates the effect of the subsidy on consumer surplus, producer surplus,government revenue, and total surplus. Because total surplus declines by area D + H, thesubsidy leads to a deadweight loss in that amount.BeforeSubsidyAfter Subsidy ChangeConsumerSurplus A + B A + B + E + F + G +(E + F + G)ProducerSurplus E + I B + C + E + I +(B + C)Government Revenue 0 –(B + C + D + E + F + G +H)–(B + C + D + E + F + G +H)Total Surplus A + B + E + I A + B – D + E – H + I –(D + H)Figure 79. a. Figure 8 shows the effect of a $10 tax on hotel rooms. The tax revenue is represented byareas A + B, which are equal to ($10)(900) = $9,000. The deadweight loss from the tax is represented by areas C + D, which are equal to (0.5)($10)(100) = $500.Figure 8 Figure 9b. Figure 9 shows the effect of a $20 tax on hotel rooms. The tax revenue is represented byareas A + B, which are equal to ($20)(800) = $16,000. The deadweight loss from the tax is represented by areas C + D, which are equal to (0.5)($20)(200) = $2,000.When the tax is doubled, the tax revenue rises by less than double, while thedeadweight loss rises by more than double. The higher tax creates a greaterdistortion to the market.10. a. Setting quantity supplied equal to quantity demanded gives 2P = 300 –P. Adding P toboth sides of the equation gives 3P = 300. Dividing both sides by 3 gives P = 100.Substituting P = 100 back into either equation for quantity demanded or supplied gives Q = 200.b. Now P is the price received by sellers and P +T is the price paid by buyers. Equatingquantity demanded to quantity supplied gives 2P = 300 − (P+T). Adding P to both sides of the equation gives 3P = 300 –T. Dividing both sides by 3 gives P = 100 –T/3. This is the price received by sellers. The buyers pay a price equal to the price received by sellers plus the tax (P +T = 100 + 2T/3). The quantity sold is now Q = 2P = 200 – 2T/3.c. Because tax revenue is equal to T x Q and Q = 200 – 2T/3, tax revenue equals 200T−2T2/3. Figure 10 (on the next page) shows a graph of this relationship. Tax revenue iszero at T = 0 and at T = 300.Figure 10 Figure 11d. As Figure 11 shows, the area of the triangle (laid on its side) that represents thedeadweight loss is 1/2 × base × height, where the base is the change in the price, which is the size of the tax (T) and the height is the amount of the decline in quantity (2T/3).So the deadweight loss equals 1/2 ×T × 2T/3 = T2/3. This rises exponentially from 0 (when T = 0) to 30,000 when T = 300, as shown in Figure 12.Figure 12e. A tax of $200 per unit is a bad policy, because tax revenue is declining at that tax level.The government could reduce the tax to $150 per unit, get more tax revenue ($15,000 when the tax is $150 versus $13,333 when the tax is $200), and reduce the deadweight loss (7,500 when the tax is $150 compared to 13,333 when the tax is $200).。
曼昆《经济学原理(微观经济学分册)》(第6版)课后习题详解(第8章--应用:赋税的代价)(精选.)
曼昆《经济学原理(微观经济学分册)》(第6版)第8章应用:赋税的代价课后习题详解跨考网独家整理最全经济学考研真题,经济学考研课后习题解析资料库,您可以在这里查阅历年经济学考研真题,经济学考研课后习题,经济学考研参考书等内容,更有跨考考研历年辅导的经济学学哥学姐的经济学考研经验,从前辈中获得的经验对初学者来说是宝贵的财富,这或许能帮你少走弯路,躲开一些陷阱。
以下内容为跨考网独家整理,如您还需更多考研资料,可选择经济学一对一在线咨询进行咨询。
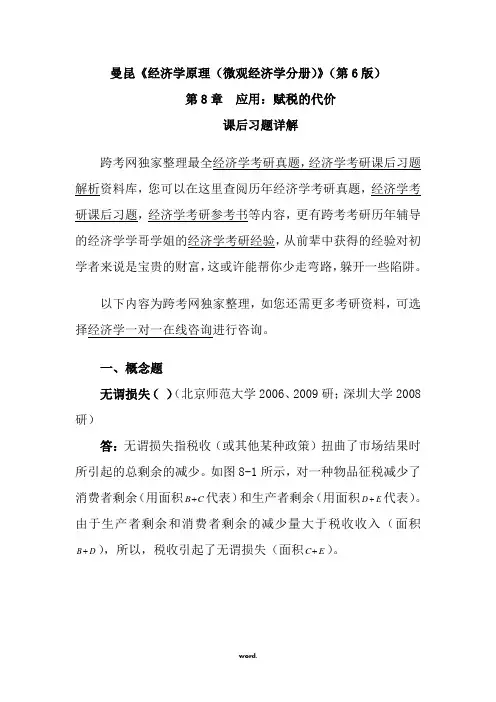
一、概念题无谓损失()(北京师范大学2006、2009研;深圳大学2008研)答:无谓损失指税收(或其他某种政策)扭曲了市场结果时所引起的总剩余的减少。
如图8-1所示,对一种物品征税减少了消费者剩余(用面积B C+代表)和生产者剩余(用面积D E+代表)。
由于生产者剩余和消费者剩余的减少量大于税收收入(面积+),所以,税收引起了无谓损失(面积C E+)。
B D图8-1 无谓损失二、复习题1.当对一种物品征税时,消费者剩余和生产者剩余会发生怎样的变动?与税收收入相比较,消费者剩余和生产者剩余如何变动?解释原因。
答:(1)当对一种物品征税时,消费者剩余和生产者剩余都会减少。
(2)与税收收入的比较具体如图8-1所示。
对一种物品征税减少了消费者剩余(用面积B C+代表)和生产者剩余(用面积D E+代表)。
由于生产者和消费者剩余的减少大于税收收入(面积B D+),所以,税收引起了无谓损失(面积C E+)。
(3)税收引起无谓损失的原因是收扭曲了消费者的支付意愿和生产者的生产成本,使资源配置无效率,进而使社会总剩余减少。
市场通常可以有效地配置稀缺资源。
这就是说,供求均衡使市场上买者和卖者的总剩余最大化。
但是,当税收提高了买者的价格而降低了卖者的价格时,它对买者的激励是比没有税收时少消费,而对卖者的激励是比没有税收时少生产。
当买者和卖者对这些激励做出反应时,市场规模缩小到其最优水平之下。
曼昆《经济学原理(微观经济学分册)》(第6版)课后习题详细讲解(第8章__应用_赋税的代价)
曼昆《经济学原理(微观经济学分册)》(第6版)第8章应用:赋税的代价课后习题详解跨考网独家整理最全经济学考研真题,经济学考研课后习题解析资料库,您可以在这里查阅历年经济学考研真题,经济学考研课后习题,经济学考研参考书等内容,更有跨考考研历年辅导的经济学学哥学姐的经济学考研经验,从前辈中获得的经验对初学者来说是宝贵的财富,这或许能帮你少走弯路,躲开一些陷阱。
以下内容为跨考网独家整理,如您还需更多考研资料,可选择经济学一对一在线咨询进行咨询。
一、概念题无谓损失(deadweight loss)(北京师范大学2006、2009研;深圳大学2008研)答:无谓损失指税收(或其他某种政策)扭曲了市场结果时所引起的总剩余的减少。
如图8-1所示,对一种物品征税减少了消费者剩余(用面积B C+代表)和生产者剩余(用面积D E+代表)。
由于生产者剩余和消费者剩余的减少量大于税收收入(面积B D+),所以,税收引起了无谓损失(面积C E+)。
图8-1 无谓损失二、复习题1.当对一种物品征税时,消费者剩余和生产者剩余会发生怎样的变动?与税收收入相比较,消费者剩余和生产者剩余如何变动?解释原因。
答:(1)当对一种物品征税时,消费者剩余和生产者剩余都会减少。
(2)与税收收入的比较具体如图8-1所示。
对一种物品征税减少了消费者剩余(用面积B C+代表)和生产者剩余(用面积D E+代表)。
由于生产者和消费者剩余的减少大于税收收入(面积B D+)。
+),所以,税收引起了无谓损失(面积C E(3)税收引起无谓损失的原因是收扭曲了消费者的支付意愿和生产者的生产成本,使资源配置无效率,进而使社会总剩余减少。
市场通常可以有效地配置稀缺资源。
这就是说,供求均衡使市场上买者和卖者的总剩余最大化。
但是,当税收提高了买者的价格而降低了卖者的价格时,它对买者的激励是比没有税收时少消费,而对卖者的激励是比没有税收时少生产。
当买者和卖者对这些激励做出反应时,市场规模缩小到其最优水平之下。
经济学原理复习题-曼昆版
《经济学原理》课程部分复习题(电子版)一、名词解释稀缺性机会成本外部性通货膨胀 GDP平减指数结构性失业市场失灵均衡价格均衡数量需求价格弹性需求收入弹性需求交叉弹性消费者剩余生产者剩余公共物品私人物品边际成本边际产量规模经济价格歧视国内生产总值 CPI 比较优势货币中性自然产量率无谓损失经济利润沉没成本二、单项选择题1、下列不会引起牛排需求发生变化的情况是()A、医生说多吃牛肉有损健康B、牛的饲养者宣传牛排中含有丰富的营养C、牛排价格从3美元涨到4美元D、汉堡价格从每千克2美元降到1.5美元2、比萨和炸玉米饼是替代品,如果比萨价格上升,则()A、比萨的需求减少,炸玉米饼的需求增加B、两种商品的需求都减少C、炸玉米饼的需求量增加,比萨的需求量减少D、炸玉米饼的需求增加,比萨的需求量减少3、下列哪项不列入GDP核算()A、出口到国外的一批货物B、经济人为一座旧房屋买卖收取的佣金费C、政府为贫困家庭发放的一笔救济金D、保险公司收到的一笔家庭财产保险费4、经济学是研究个人、企业、政府以及整个社会在面对()时做出选择的一门社会科学A.必要性 B.贫困 C.稀缺 D.效率5、已知某种商品的需求是富有弹性的,在其他条件不变的情况下,卖者要想获得更多的收益,应该( ) A.适当降低价格 B.适当提高价格 C.保持价格不变 D.加大销售量6、一国的GDP大于GNP,则该国公民从国外取得的收入与外国公民从该国取得的收入之间的关系是( ) A.大于 B.小于 C.等于 D.无法判断7、完全竞争和垄断竞争的主要区别是( )A.产品差异程度 B.市场中厂商的数量C.长期当中厂商获得的利润D.进出行业的容易度8、我们必须在“是生产大炮还是生产黄油”的问题上作出选择,这主要是( )A.欲望的无限性B.资源利用问题C.资源配置问题D.选择的普遍性9、照相机和胶卷是( )A.非相关品B.独立产品C.互补产品D.互替产品10、假定某机器原来生产产品A,利润收入为200元,现在改生产产品B,所花的人工、材料费为1000元,则生产产品B的机会成本是( )A.200元B.1000元C.1200元D.无法确定11、消费者剩余是消费者的( )A.实际所得B.主观感受C.没有购买的部分D.消费剩余部分12、一个行业的市场被几家厂商控制,他们通过操纵价格来决定这个行业产品的价格,这样的市场结构被称为( )A.完全竞争B.完全垄断C.寡头垄断D.垄断竞争13、建筑工人工资提高将使( )A.新房子供给曲线左移并使房子价格上升B.新房子供给曲线右移并使房子价格下降C.新房子需求曲线左移并使房子价格下降D.新房子需求曲线右移并使房子价格上升14、假定短期内在某一产量水平上,某厂商的平均成本达到了最小值,这意味着( )A.边际成本等于平均成本B.厂商获得了最大利润C.厂商获得了最小利润D.厂商的超额利润为零15、某人的吸烟行为属( )A.生产的外在经济B.消费的外在经济C.生产的外在不经济D.消费的外在不经济16、企业为了获得更多的利润提高产品价格所引起的通货膨胀属于( )A.需求拉上的通货膨胀B.预期的通货膨胀C.成本推动的通货膨胀D.惯性的通货膨胀17、公开市场业务是指( )A.中央银行在金融市场上买进或卖出有价证券B.中央银行增加或减少对商业银行的贷款C.中央银行规定对商业银行的最低贷款利率D.中央银行对商业银行实施监督18、下列哪一项不属于扩张性财政政策?( )A.减少税收 B.制定物价管制政策C.增加政府支出D.增加公共事业投资19、利润最大化原则是()A、边际成本等于平均成本B、边际成本小于边际收益;C、边际成本等于边际收益D、边际成本大于边际收益;20、当存在正的外部经济影响时,()A、社会边际成本大于私人边际成本,社会边际收益大于私人边际收益;B、社会边际成本小于私人边际成本,社会边际收益小于私人边际收益;C、社会边际成本大于私人边际成本,社会边际收益小于私人边际收益;D、社会边际成本小于私人边际成本,社会边际收益大于私人边际收益;21、短期平均成本曲线呈U型,是因为()A、外部经济B、内在经济;C、规模经济D、边际收益递减规律。
(完整版)曼昆宏观经济学原理答案
第一篇导言复习题第一章宏观经济学的科学1、解释宏观经济学和微观经济学之间的差距,这两个领域如何相互关联?【答案】微观经济学研究家庭和企业如何作出决策以及这些决策在市场上的相互作用。
微观经济学的中心原理是家庭和企业的最优化——他们在目的和所面临的约束条件下可以让自己的境况更好。
而相对的,宏观经济学研究经济的整体情况,它主要关心总产出、总就业、一般物价水平和国际贸易等问题,以及这些宏观指标的波动趋势与规律。
应该看到,宏观经济学研究的这些宏观经济变量是以经济体系中千千万万个体家庭和企业之间的相互作用所构成的。
因此,微观经济决策总是构成宏观经济模型的基础,宏观经济学必然依靠微观经济基础。
2、为什么经济学家建立模型?【答案】一般来说,模型是对某些具体事物的抽象,经济模型也是如此。
经济模型可以简洁、直接地描述所要研究的经济对象的各种关系。
这样,经济学家可以依赖模型对特定的经济问题进行研究;并且,由于经济实际不可控,而模型是可控的,经济学家可以根据研究需要,合理、科学的调整模型来研究各种经济情况。
另外,经济模型一般是数学模型,而数学是全世界通用的科学语言,使用规范、标准的经济模型也有利于经济学家正确表达自己的研究意图,便于学术交流。
3、什么是市场出清模型?什么时候市场出清的假设是适用的?【答案】市场出清模型就是供给与需求可以在价格机制调整下很快达到均衡的模型。
市场出清模型的前提条件是价格是具有伸缩性的(或弹性)。
但是,我们知道价格具有伸缩性是一个很强的假设,在很多实际情况下,这个假设都是不现实的。
比如:劳动合同会使劳动力价格在一段时期内具有刚性。
因此,我们必须考虑什么情况下价格具有伸缩性是合适的。
现在一般认为,在研究长期问题时,假设价格具有伸缩性是合理的;而在研究短期问题时,最好假设价格具有刚性。
因为,从长期看,价格机制终将发挥作用,使市场供需平衡,即市场出清,而在短期,价格机制因其他因素制约,难以很快使市场出清。
曼昆《经济学原理(微观经济学分册)》(第8版)笔记和课后习题(含考研真题)详解
曼昆《经济学原理(微观经济学分册)》(第8版)笔记和课后习题(含考研真题)详解目录第1篇导言第1章经济学十大原理1.1 复习笔记1.2 课后习题详解1.3 名校考研真题详解第2章像经济学家一样思考2.1 复习笔记2.2 课后习题详解2.3 名校考研真题详解第3章相互依存性与贸易的好处3.1 复习笔记3.2 课后习题详解3.3 名校考研真题详解第2篇市场如何运行第4章供给与需求的市场力量4.1 复习笔记4.2 课后习题详解4.3 名校考研真题详解第5章弹性及其应用5.1 复习笔记5.2 课后习题详解5.3 名校考研真题详解第6章供给、需求与政府政策6.1 复习笔记6.2 课后习题详解6.3 名校考研真题详解第3篇市场和福利第7章消费者、生产者与市场效率7.1 复习笔记7.2 课后习题详解7.3 名校考研真题详解第8章应用:税收的代价8.1 复习笔记8.2 课后习题详解8.3 名校考研真题详解第9章应用:国际贸易9.1 复习笔记9.2 课后习题详解9.3 名校考研真题详解第4篇公共部门经济学第10章外部性10.1 复习笔记10.2 课后习题详解10.3 名校考研真题详解第11章公共物品和公共资源11.1 复习笔记11.2 课后习题详解11.3 名校考研真题详解第12章税制的设计12.1 复习笔记12.2 课后习题详解12.3 名校考研真题详解第5篇企业行为与产业组织第13章生产成本13.1 复习笔记13.2 课后习题详解13.3 名校考研真题详解第14章竞争市场上的企业14.1 复习笔记14.2 课后习题详解14.3 名校考研真题详解第15章垄断15.1 复习笔记15.2 课后习题详解15.3 名校考研真题详解第16章垄断竞争16.1 复习笔记16.2 课后习题详解16.3 名校考研真题详解第17章寡头17.1 复习笔记17.2 课后习题详解17.3 名校考研真题详解第6篇劳动市场经济学第18章生产要素市场18.1 复习笔记18.2 课后习题详解18.3 名校考研真题详解第19章收入与歧视19.1 复习笔记19.2 课后习题详解19.3 名校考研真题详解第20章收入不平等与贫困20.1 复习笔记20.2 课后习题详解20.3 名校考研真题详解第7篇深入研究的论题第21章消费者选择理论21.1 复习笔记21.2 课后习题详解21.3 名校考研真题详解第22章微观经济学前沿22.1 复习笔记22.2 课后习题详解22.3 名校考研真题详解内容简介本书遵循曼昆《经济学原理(微观经济学分册)》(第8版)教材的章目编排,共分7篇22章,每章由三部分组成:第一部分为复习笔记,总结本章的重难点内容;第二部分是课(章)后习题详解,对第8版的所有习题都进行了详解的分析和解答;第三部分为名校考研真题详解,精选近年考研真题,并提供了详细的解答。
- 1、下载文档前请自行甄别文档内容的完整性,平台不提供额外的编辑、内容补充、找答案等附加服务。
- 2、"仅部分预览"的文档,不可在线预览部分如存在完整性等问题,可反馈申请退款(可完整预览的文档不适用该条件!)。
- 3、如文档侵犯您的权益,请联系客服反馈,我们会尽快为您处理(人工客服工作时间:9:00-18:30)。
Chapter 8Application: The Costs of TaxationTest A1. A tax levied on the buyers of a product shifts thea. demand curve upward or to the right.b. demand curve downward or to the left.c. supply curve upward or to the left.d. supply curve downward or to the right.ANSWER: b. demand curve downward or to the left.TYPE: M KEY1: D SECTION: 1 OBJECTIVE: 1 RANDOM: Y2. When a tax is levied on a gooda. buyers are worse off but sellers are not.b. sellers are worse off but buyers are not.c. neither buyers nor sellers are worse off.d. both buyers and sellers are worse off.ANSWER: d. both buyers and sellers are worse off.TYPE: M KEY1: D SECTION: 1 OBJECTIVE: 1 RANDOM: Y3. When a tax on a good is enacted,a. sellers always bear the full burden of the tax.b. buyers always bear the full burden of the tax.c. buyers and sellers share the burden of the tax regardless of which party it is levied on.d. sellers bear the full burden if the tax is levied on them, but buyers bear the full burden if the taxis levied on them.ANSWER: c. buyers and sellers share the burden of the tax regardless of which party it is levied on. TYPE: M KEY1: C SECTION: 1 OBJECTIVE: 1 RANDOM: Y4. A tax placed on a gooda. causes the price of the good to fall.b. causes the size of the market for the good to shrink.c. affects buyers of the good, but not sellers.d. is usually borne entirely by the seller of the good.ANSWER: b. causes the size of the market for the good to shrink.TYPE: M KEY1: C SECTION: 1 OBJECTIVE: 1 RANDOM: Y5. When a tax is levied on a gooda. the market price falls because demand declines.b. the market price falls because supply falls.c. the market price rises because demand falls.d. a wedge is placed between the price buyers pay and the price sellers receive.ANSWER: d. a wedge is placed between the price buyers pay and the price sellers receive.TYPE: M KEY1: C SECTION: 1 OBJECTIVE: 1 RANDOM: Y84 ❖ Chapter 8/Application: The Costs of Taxation6. The benefit received by the sellers of a good in a market is measured bya. producer surplus.b. consumer surplus.c. the amount it costs producers to produce the good.d. the amount buyers pay for the good in excess of the amount the good is actually worth. ANSWER: a. producer surplus.TYPE: M KEY1: D SECTION: 1 OBJECTIVE: 1 RANDOM: Y7. According to the graph, the equilibrium market price before the tax is imposed isa. P3.b. P2.c. P1.d. impossible to determine.ANSWER: c. P1.TYPE: M KEY1: G SECTION: 1 OBJECTIVE: 1 GRAPH FORMAT: M RANDOM: Y8. According to the graph, the price buyers pay after the tax isa. P3.b. P2.c. P1.d. impossible to determine.ANSWER: a. P3.TYPE: M KEY1: G SECTION: 1 OBJECTIVE: 1 GRAPH FORMAT: M RANDOM: Y9. According to the graph, the price sellers receive after the tax isa. P3.b. P2.c. P1.d. impossible to determine.ANSWER: b. P2.TYPE: M KEY1: G SECTION: 1 OBJECTIVE: 1 GRAPH FORMAT: M RANDOM: YChapter 8/Application: The Costs of Taxation ❖ 8510. According to the graph, consumer surplus before the tax was levied is represented by areaa. A.b. F.c. A + B + C.d. D + E + F.ANSWER: c. A + B + C.TYPE: M KEY1: G SECTION: 1 OBJECTIVE: 1 GRAPH FORMAT: M RANDOM: Y11. According to the graph, before the tax the producer surplus is represented by areaa. A.b. F.c. A + B + C.d. D + E + F.ANSWER: d. D + E + F.TYPE: M KEY1: G SECTION: 1 OBJECTIVE: 1 GRAPH FORMAT: M RANDOM: Y12. According to the graph, the tax caused a reduction in consumer surplus represented by areaa. A.b. F.c. B + C.d. D + E.ANSWER: c. B + C.TYPE: M KEY1: G SECTION: 1 OBJECTIVE: 1 GRAPH FORMAT: M RANDOM: Y13. According to the graph, the tax caused a reduction in producer surplus represented by areaa. A.b. F.c. B + C.d. D + E.ANSWER: d. D + E.TYPE: M KEY1: G SECTION: 1 OBJECTIVE: 1 GRAPH FORMAT: M RANDOM: Y14. According to the graph, the benefits to the government (total tax revenue) are represented by areaa. A + B.b. C + E.c. B + D.d. D + F.ANSWER: c. B + D.TYPE: M KEY1: G SECTION: 1 OBJECTIVE: 1 GRAPH FORMAT: M RANDOM: Y15. According to the graph, the total surplus (consumer, producer, and government) with the tax isrepresented by areaa. C + E.b. A + B + C.c. D + E + F.d. A + B + D + F.ANSWER: d. A + B + D + F.TYPE: M KEY1: G SECTION: 1 OBJECTIVE: 1 GRAPH FORMAT: M RANDOM: Y86 ❖ Chapter 8/Application: The Costs of Taxation16. According to the graph, the loss in total welfare resulting from the levying of the tax is represented byareaa. C + E.b. A + B + C.c. D + E + F.d. A + B + D + F.ANSWER: a. C + E.TYPE: M KEY1: G SECTION: 1 OBJECTIVE: 1 GRAPH FORMAT: M RANDOM: Y17. Deadweight loss is thea. decline in government revenue when taxes are reduced in a market.b. reduction in total surplus that results from a tax.c. reduction in consumer surplus when a tax is placed on buyers.d. loss of profit to businesses when a tax is imposed.ANSWER: b. reduction in total surplus that results from a tax.TYPE: M KEY1: D SECTION: 1 OBJECTIVE: 1 RANDOM: Y18. The greater the elasticities of demand and supply thea. smaller the deadweight loss from a tax.b. greater the deadweight loss from a tax.c. less intrusive a tax will be on a market.d. more equitable the distribution of a tax between buyers and sellers.ANSWER: b. greater the deadweight loss from a tax.TYPE: M KEY1: D SECTION: 2 OBJECTIVE: 2 RANDOM: Y19. Economists generally agree that the most important tax in the U.S. economy is the tax ona. labor.b. consumption.c. personal property.d. income.ANSWER: a. labor.TYPE: M KEY1: D SECTION: 2 OBJECTIVE: 2 RANDOM: Y20. If the supply of land is fixed, a tax on land would be paida. only by workers.b. entirely by the landowners.c. entirely by the renters or users of the land.d. partly by landowners and partly by land users.ANSWER: b. entirely by the landowners.TYPE: M KEY1: C SECTION: 2 OBJECTIVE: 2 RANDOM: Y21. As the size of a tax increasesa. the deadweight loss from the tax remains constant.b. the deadweight loss from the tax declines.c. the deadweight loss from the tax increases.d. no one knows how the deadweight loss changes because no tax has ever been reduced. ANSWER: c. the deadweight loss from the tax increases.TYPE: M KEY1: C SECTION: 3 OBJECTIVE: 3 RANDOM: YChapter 8/Application: The Costs of Taxation ❖ 8722. One side-effect of the tax cuts made during Ronald Reagan’s terms as president wasa. increased tax revenues.b. large budget deficits.c. small budget surpluses.d. decreased government spending.ANSWER: b. large budget deficits.TYPE: M KEY1: D SECTION: 3 OBJECTIVE: 3 RANDOM: Y23. The views held by Arthur Laffer and Ronald Reagan that cuts in tax rates would encourage people toincrease the quantity of labor they supplied became known asa. Laffer economics.b. welfare economics.c. microeconomics.d. supply-side economics.ANSWER: d. supply-side economics.TYPE: M KEY1: C SECTION: 3 OBJECTIVE: 3 RANDOM: Y24. The higher a country’s tax rates the more likely that country will bea. above the Laffer curve.b. on the top of the Laffer curve.c. on the negatively-sloped part of the Laffer curve.d. on the positively-sloped part of the Laffer curve.ANSWER: c. on the negatively-sloped part of the Laffer curve.TYPE: M KEY1: D SECTION: 3 OBJECTIVE: 4 RANDOM: Y25. A major political problem with collecting taxes to finance government spending is thata. taxes make taxpayers worse off since government spending benefits no one.b. the people who pay the taxes are often not the same people who benefit from the governmentspending of tax funds.c. taxes make taxpayers worse off since government spending benefits only those on welfare.d. taxes reduce economic welfare more than the expenditure of tax funds benefits society. ANSWER: b. the people who pay the taxes are often not the same people who benefit from the government spending of tax funds.TYPE: M KEY1: D SECTION: 3 OBJECTIVE: 4 RANDOM: Y1 ANSWER: b. demand curve downward or to the left.TYPE: M KEY1: D SECTION: 1 OBJECTIVE: 1 RANDOM: Y2 ANSWER: d. both buyers and sellers are worse off.TYPE: M KEY1: D SECTION: 1 OBJECTIVE: 1 RANDOM: Y3 ANSWER: c. buyers and sellers share the burden of the tax regardless of which party it is levied on. TYPE: M KEY1: C SECTION: 1 OBJECTIVE: 1 RANDOM: Y88 ❖ Chapter 8/Application: The Costs of Taxation4 ANSWER: b. causes the size of the market for the good to shrink.TYPE: M KEY1: C SECTION: 1 OBJECTIVE: 1 RANDOM: Y5 ANSWER: d. a wedge is placed between the price buyers pay and the price sellers receive. TYPE: M KEY1: C SECTION: 1 OBJECTIVE: 1 RANDOM: Y6 ANSWER: a. producer surplus.TYPE: M KEY1: D SECTION: 1 OBJECTIVE: 1 RANDOM: Y7 ANSWER: c. P1.TYPE: M KEY1: G SECTION: 1 OBJECTIVE: 1 GRAPH FORMAT: M RANDOM: Y8 ANSWER: a. P3.TYPE: M KEY1: G SECTION: 1 OBJECTIVE: 1 GRAPH FORMAT: M RANDOM: Y9 ANSWER: b. P2.TYPE: M KEY1: G SECTION: 1 OBJECTIVE: 1 GRAPH FORMAT: M RANDOM: Y10 ANSWER: c. A + B + C.TYPE: M KEY1: G SECTION: 1 OBJECTIVE: 1 GRAPH FORMAT: M RANDOM: Y11 ANSWER: d. D + E + F.TYPE: M KEY1: G SECTION: 1 OBJECTIVE: 1 GRAPH FORMAT: M RANDOM: Y12 ANSWER: c. B + C.TYPE: M KEY1: G SECTION: 1 OBJECTIVE: 1 GRAPH FORMAT: M RANDOM: Y13 ANSWER: d. D + E.TYPE: M KEY1: G SECTION: 1 OBJECTIVE: 1 GRAPH FORMAT: M RANDOM: Y14 ANSWER: c. B + D.TYPE: M KEY1: G SECTION: 1 OBJECTIVE: 1 GRAPH FORMAT: M RANDOM: Y15 ANSWER: d. A + B + D + F.TYPE: M KEY1: G SECTION: 1 OBJECTIVE: 1 GRAPH FORMAT: M RANDOM: YChapter 8/Application: The Costs of Taxation ❖ 89 16 ANSWER: a. C + E.TYPE: M KEY1: G SECTION: 1 OBJECTIVE: 1 GRAPH FORMAT: M RANDOM: Y17 ANSWER: b. reduction in total surplus that results from a tax.TYPE: M KEY1: D SECTION: 1 OBJECTIVE: 1 RANDOM: Y18 ANSWER: b. greater the deadweight loss of a tax.TYPE: M KEY1: D SECTION: 2 OBJECTIVE: 2 RANDOM: Y19 ANSWER: a. labor.TYPE: M KEY1: D SECTION: 2 OBJECTIVE: 2 RANDOM: Y20 ANSWER: b. entirely by the landowners.TYPE: M KEY1: C SECTION: 2 OBJECTIVE: 2 RANDOM: Y21 ANSWER: c. the deadweight loss from the tax increases.TYPE: M KEY1: C SECTION: 3 OBJECTIVE: 3 RANDOM: Y22 ANSWER: b. large budget deficits.TYPE: M KEY1: D SECTION: 3 OBJECTIVE: 3 RANDOM: Y23 ANSWER: d. supply-side economics.TYPE: M KEY1: C SECTION: 3 OBJECTIVE: 3 RANDOM: Y24 ANSWER: c. on the negatively-sloped part of the Laffer curve.TYPE: M KEY1: D SECTION: 3 OBJECTIVE: 4 RANDOM: Y25 ANSWER: b. the people who pay the taxes are often not the same people who benefit from thegovernment spending of tax funds.TYPE: M KEY1: D SECTION: 3 OBJECTIVE: 4 RANDOM: YChapter 8。