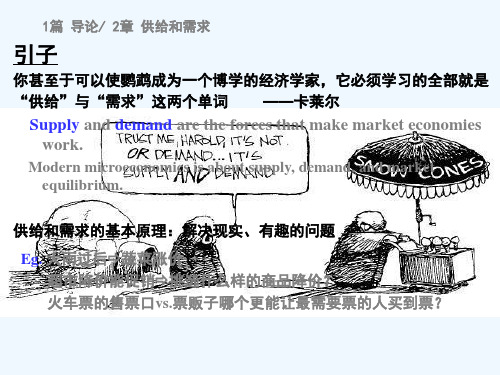
lecture02 Supply and demand model 平狄克微观经济学英文课件
平狄克 微观经济学 第七版 课件 第二章

• in amount, or in proportion
Price Elasticity of Demand
19 20
%∆QS ∆QS / QS = % ∆P ∆P / P
Gasoline: SR and LR Demand Curves
Price
Short-Run and Long-Run Supply Elasticity
• For most goods and services,
– long-run price elasticity of supply is greater than short-run price elasticity of supply – firms can better adjust their capacity (“fixed” inputs) and method of production if given sufficient time
• Income elasticity also varies with the amount of time consumers have to respond to an income change
– for most goods and services, income elasticity is larger in the long run – when income changes, it takes time to adjust spending patterns
平狄克中级微观经济学讲义(厦门大学范文
平狄克中级微观经济学讲义(厦门大学王瑞芳)微观经济学 (平狄克,鲁宾费尔德,第四版)LECTURE 2 导论一、前言微观经济学的研究范围微观经济学的研究范围包括:微观主体行为:消费者(如何)选择买(什么);生产者(如何)选择生产(什么).市场:消费者和生产者的联系纽带。
而宏观经济学主要考察的是宏观课题如经济增长、通货膨胀和失业率等。
微观经济学是宏观经济学的基础。
微观经济学的要旨资源的稀缺性决定了我们不总是能获得我们想要的,这就要求对稀缺性资源进行合理配置,配置可以通过市场、也可以通过计划实现,微观经济学的目的不在于确定哪种方式更好,而是给衡量配置方式优劣一个标尺。
几个相关概念的比较理论VS模型;实证VS规范;市场VS行业;竞争性市场VS非竞争性市场;市场的内涵VS市场的外延;市场的地理边界VS市场的产品范围;名义价格VS实际价格二、需求和供给的基本原理需求与供给供给供给曲线显示在其他外部条件保持不变的情况下,在一个既定价格下生产者愿意出售的产品数量(价格-数量关系);它与价格成正向相关关系。
非价格的供给决定因素包括:生产成本(劳动力、资本、原材料)。
供给曲线由非价格决定因素决定,一旦这些因素发生变动,整条曲线都将发生移动;在非价格决定因素不变的情况下,价格发生变动带来的供给数量的变动由曲线上点的移动来体现,此时供给曲线保持不变,改变的是实际的落点。
需求需求曲线显示在非价格因素保持不变的情况下,每单位产品售价发生的变化导致他愿意购买的数量的变化(价格数量关系);它与价格成反向相关关系。
非价格的需求决定因素包括:收入、消费者品味,相关商品价格(互补品、竞争品)需求曲线的变动和需求曲线上点的变动规律同供给曲线。
均衡均衡(市场出清):供给曲线与需求曲线相交。
图PP11;市场机制:图PP12,13供给和需求相互作用决定市场出清价格;一旦价格偏离均衡,则市场将通过价格变动自发调整,减轻需求方或供给方的过剩或不足,从而实现重新均衡;要使市场机制有效,市场必须是竞争性的。
微观经济学平狄克
1篇 导论/ 2章 供给和需求/ 2.1 供给和需求
⑴ 需求(demand)
条件1:愿意、欲望(willing, desires)
[清]胡澹庵《解人颐》一书中收录的《不知足》诗: 终日奔波只为饥,方才一饱便思衣。衣食两般皆具足,又想娇容美貌妻。 娶得美妻生下子,恨无田地少根基。买得田园多广阔,出入无船少马骑。 槽头拴了骡和马,叹无官职被人欺。县丞主薄还嫌小,又要朝中挂紫衣。
5.00P
4.00 3.00
3
4.00
4
3.00
一般向右下方倾斜 (downward-sloping)
2.00
6
2.00
1.00
9
需求公式
Qd = D(P) eg. Qd = 7 - P
1.00
D
0.00
Qd
0 1 2 3 4 5 6 7 8 9 10
1篇 导论/ 2章 供给和需求/ 2.1 供给和需求
供求均衡(equilibrium)
供给曲线&需求曲线相交的点:市场的均衡点
价 格 ( P ) 需 求 ( Q d ) 价 格 ( P ) 供 给 ( Q d ) 5.00P
S
元
个
元
个
4.00
3
4.00
9
4.00
3.00
4
3.00
8
3.00
2.00
6
2.00
6 Pe 2.00
1.00
9
1.00
3
1.00
若要世人心里足,除是南柯一梦西。
Eg.马斯洛的需求层次论(Maslow’s hierarchy of needs) 自我实现
平狄克微观经济学第二章

需求函数 QD = QD(P,I,Px,U, PE ,A,T,……) ) 简化为Q 简化为 D = QD(P)
Chapter 2: 供给和需求的基本原理 Slide 4
供给和需求
需求法则
在其他条件不变的情况下, 在其他条件不变的情况下,随着某种商品或劳 务的价格上升(或下降), ),会导致对该商品或 务的价格上升(或下降),会导致对该商品或 劳务的需求量的减少(增加); );也就是商品价 劳务的需求量的减少(增加);也就是商品价 格与其需求量成反比 例外:吉芬商品,炫耀性商品(钻石) 例外:吉芬商品,炫耀性商品(钻石)
奢侈品 必需品
收入弹性
{ <0
>0
正常商品
{ <1
>1
低档商品 劣质品) (劣质品)
Chapter 2: 供给和需求的基本原理
Slide 29
供给和需求的弹性
其他需求弹性
需求的交叉价格弹性
定义: 需求量的相对变化 需求量的相对变化/Y商品价格的相对 定义:X需求量的相对变化 商品价格的相对 变化 EXY =( QX/QX)/(PY/PY) 反映相关商品间的相互影响 EXY >0, 则称Y是X的替代产品 则称 是 的替代产品 则称Y是 的互补产品 EXY <0, 则称 是X的互补产品
The Market for Wheat
Supply (Qs) Demand (QD)
1981 1800 + 240P 3550 - 266P
Equilibrium Price (Qs = QD)
1800+240P = 3550-266P 506P = 1750 P1981 = $3.46/bushel 1,944+207P = 3,244-283P P1998 = $2.65/bushel
平狄克中级微观经济学Ch02_Pindyck
Q1
©2005 Pearson Education, Inc.
Q2
Chapter 2
Quantity
6
The Supply Curve
Other Variables Affecting Supply
Costs of Production
Labor Capital
Raw
Materials
P1 P0
2. 3.
ቤተ መጻሕፍቲ ባይዱ4.
D Q
©2005 Pearson Education, Inc.
D
Q0
Chapter 2
QS
Quantity
19
The Market Mechanism
The market price is below equilibrium:
There is excess demand - shortage Upward pressure on prices Quantity demanded decreases and quantity supplied increases The market adjusts until the new equilibrium is reached
Q1
Q2
Q
8
The Supply Curve
Change in Quantity Supplied
Movement along the curve caused by a change in price
Change in Supply
Shift of the curve caused by a change in something other than the price of the good
平狄克和鲁宾费尔德微观经济学microeconomics rubinfeld pindyck textbook Ch 2

Price
S
P1 P2
D2 Q2 Q1
D1
Quantity of Butter
Figure 2.2.c 3. If a 3-percent increase in the price of corn flakes causes a 6-percent decline in the quantity demanded, what is the elasticity of demand? The elasticity of demand is the percentage change in the quantity demanded divided by 6 2 . the percentage change in the price. The elasticity of demand for corn flakes is 3 This is equivalent to saying that a 1% increase in price leads to a 2% decrease in quantity demanded. This is in the elastic region of the demand curve, where the elasticity of demand exceeds -1.0. 4. Explain the difference between a shift in the supply curve and a movement along the supply curve. A movement along the supply curve is caused by a change in the price or the quantity of the good, since these are the variables on the axes. A shift of the supply curve is caused by any other relevant variable that causes a change in the quantity supplied at any given price. Some examples are changes in production costs and an increase in the number of firms supplying the product. 5. Explain why for many goods, the long-run price elasticity of supply is larger than the short-run elasticity. The elasticity of supply is the percentage change in the quantity supplied divided by the percentage change in price. An increase in price induces an increase in the quantity supplied by firms. Some firms in some markets may respond quickly and cheaply to price changes. However, other firms may be constrained by their production capacity in the short run. The firms with short-run capacity constraints will have a short-run supply elasticity that is less elastic. However, in the long run all firms can increase their scale of production and thus have a larger long-run price elasticity.
平狄克微观经济学课件(英文)02
2.1
SUPPLY AND DEMAND
The Supply Curve
The supply curve is thus a relationship between the quantity supplied and the price. We can write this relationship as an equation: QS = QS(P)
Chapter 2 Supply and Demand
© 2008 Prentice Hall Business Publishing • Microeconomics • Pindyck/Rubinfeld, 7e.
5 of 53
2.1
SUPPLY AND DEMAND
The Demand Curve
© 2008 Prentice Hall Business Publishing • Microeconomics • Pindyck/Rubinfeld, 7e.
2 of 53
The Basics of Supply and Demand
Supply-demand analysis is a fundamental and powerful tool that can be applied to a wide variety of interesting and important problems. To name a few: • Understanding and predicting how changing world economic conditions affect market price and production • Evaluating the impact of government price controls, minimum wages, price supports, and production incentives
平狄克 中级微观经济学第一章课后练习答案_Ch01
Oklahoma and New Jersey represent separate geographic markets for gasoline because of high transportation costs.There would be an opportunity for arbitrage if transportation costs were less
In general, the first class is a good time to pique student interest in the course.It is also a good time to tell students that they need to work hard to learn how to do economic analysis, and that memorization alone will not get them through the course.Students must learn to think like economists, so encourage them to work lots of problems.Also encourage them to draw graphs neatly and large enough to make them easy to interpret.It always amazes me to see the tiny, poorly drawn graphs some students produce.It is no wonder their answers are often incorrect.You might even suggest they bring a small ruler and colored pencils to class as they can draw good diagrams.
平狄克微观经济学第六版第三章课后答案
PART IIPRODUCERS, CONSUMERS, AND COMPETITIVE MARKETSCHAPTER 3CONSUMER BEHAVIORChapter 3 builds the foundation for deriving the demand curve in Chapter 4. In order tounderstand demand theory, students must have a firm grasp of indifference curves, the marginal rateof substitution, the budget line, and optimal consumer choice. It is possible to discuss consumer choicewithout going into extensive detail on utility theory. Many students find utility functions to be a moreabstract concept than preference relationships. However, if you plan to discuss uncertainty in Chapter5, you will need to cover marginal utility (section 3.5). Even if you cover utility theory only briefly,make sure students are comfortable with the term utility because it appears frequently in Chapter 4.When introducing indifference curves, stress that physical quantities are represented on thetwo axes. After discussing supply and demand, students may think that price should be on the verticalaxis. To illustrate the indifference curves, pick an initial bundle on the graph and ask which otherbundles are likely to be more preferred and less preferred to the initial bundle. This will divide thegraph into four quadrants, and it is then easier for students to figure out the set of bundles betweenwhich the consumer is indifferent. It is helpful to present a lot of examples with different types ofgoods and see if the class can figure out how to draw the indifference curves. The examples are alsouseful for explaining the significance of the assumptions made about preferences. In presentingdifferent examples, you can ask which assumption would be violated.Explaining utility follows naturally from the discussion of indifference curves. Though anabstract concept, it is possible to get students to understand the basic idea without spending too muchtime on the topic. You might point out that we as consumers have a goal in life, which is to maximizeour utility subject to our budget constraint. When we go to the store we pick the basket that we likebest and that stays within our budget. From this we derive demand curves. Emphasize that it is theranking that is important and not the utility number, and point out that if we can graph an indifferencecurve we can certainly find an equation to represent it. Finally, what is most important is the rate atwhich consumers are willing to exchange goods (the marginal rate of substitution) and this is based onthe relative satisfaction that they derive from each good at any particular time.The marginal rate of substitution, MRS, can be confusing to students. Some confuse the MRSwith the ratio of the two quantities. If this is the case, point out that the slope is equal to the ratio of the rise, ∆Y, and the run, ∆X. This ratio is equal to the ratio of the intercepts of a line just tangent to the indifference curve. As we move along a convex indifference curve, these intercepts and the MRSchange. Another problem is the terminology “of X for Y.” This is confus ing because we are notsubstituting “X for Y,” but Y for one unit of X. You may want to present a variety of examples in classto explain this important concept.1. What are the four basic assumptions about individual preferences? Explain thesignificance or meaning of each.(1) Preferences are complete: this means that the consumer is able to compare andrank all possible baskets; (2) Preferences are transitive: this means that preferencesare consistent, in that if bundle A is preferred to bundle B and bundle B is preferredto bundle C, then we should be able to conclude that bundle A is preferred to bundleC; (3) More is preferred to less: this means that all goods are desirable, and that theconsumer will always prefer to have more of a good; (4) Diminishing marginal rateof substitution: this means that indifference curves are convex, and that the slope ofthe indifference curve increases (becomes less negative) as we move down along thecurve. As a consumer moves down along her indifference curve she is willing to giveup fewer units of the good on the vertical axis in exchange for one more unit of thegood on the horizontal axis. This assumption also means that balanced marketbaskets are preferred to baskets that have a lot of one good and very little of theother good.2. Can a set of indifference curves be upward sloping? If so, what would this tell you about the two goods?A set of indifference curves can be upward sloping if we violate assumption numberthree; more is preferred to less. When a set of indifference curves is upward sloping,it means one of the goods is a “bad” in that the consumer prefers less of the goodrather than more of the good. The positive slope means that the consumer willaccept more of the bad good only if she also receives more of the other good in return.As we move up along the indifference curve the consumer has more of the good sheb.Draw a set of indifference curves for Jon.Since Jon is always willing to trade one can of coke for one can of sprite, hisindifference curves are linear with a slope of –1.c.Draw two budget lines with different slopes and illustrate the satisfaction-maximizing choice. What conclusion can you draw?Jon’s indifference curves are linear with a slope of –1. Jon’s budget line is alsolinear, and will have a slope that reflects the ratio of the two prices. If Jon’s budgetline is steeper than his indifference curves then he will choose to consume only thegood on the vertical axis. If Jon’s b udget line is flatter than his indifference curvesthen he will choose to consumer only the good on the horizontal axis. Jon willalways choose a corner solution, unless his budget line has the same slope as hisindifference curves. In this case any combination of Sprite and Coke that uses uphis entire income with maximize his satisfaction.5. What happens to the marginal rate of substitution as you move along a convex indifference curve? A linear indifference curve?The MRS measures how much of a good you are willing to give up in exchange for onemore unit of the other good, keeping utility constant. The MRS diminishes along aconvex indifference curve in that as you move down along the indifference curve, youare willing to give up less and less of the one good in exchange for the other. TheMRS is also the slope of the indifference curve, which increases (becomes lessnegative) as you move down along the indifference curve. The MRS is constantalong a linear indifference curve, since in this case the slope does not change. Theconsumer is always willing to trade the same number of units of one good inexchange for the other.6. Explain why an MRS between two goods must equal the ratio of the price of the goods for the consumer to achieve maximum satisfaction.The MRS describes the rate at which the consumer is willing to trade one good foranother to maintain the same level of satisfaction. The ratio of prices describes thetrade-off that the market is willing to make between the same two goods. Thetangency of the indifference curve with the budget line represents the point at whichthe trade-offs are equal and consumer satisfaction is maximized. If the MRS betweentwo goods is not equal to the ratio of prices, then the consumer could trade one good foranother at market prices to obtain higher levels of satisfaction. For example, if theslope of the budget line (the ratio of the prices) is –4 then the consumer can trade 4units of good 2 for one unit of good 1. If the MRS at the current bundle is –6, then theconsumer is willing to trade 6 units of good 2 for one unit of good 1. Since the twoslopes are not equal the consumer is not maximizing her satisfaction. The consumer iswilling to trade 6 but only has to trade 4, so she should make the trade. This tradingcontinues until the highest level of satisfaction is achieved. As trades are made, theMRS will change and become equal to the price ratio.7. Describe the indifference curves associated with two goods that are perfect substitutes. What if they are perfect complements?Two goods are perfect substitutes if the MRS of one for another is a constant number.Given the MRS is a constant number, the slope of the indifference curves will beconstant, and the indifference curves are therefore linear. If two goods are perfectcomplements, the indifference curves are L-shaped. In this case the consumerwants to consume the two goods in a fixed proportion, say one unit of good 1 for every1 unit of good 2. If she has more of one good but not more of the other then she doesnot get any extra satisfaction.8. What is the difference between ordinal utility and cardinal utility? Explain why the assumption of cardinal utility is not needed in order to rank consumer choices.Ordinal utility implies an ordering among alternatives without regard for intensity ofpreference. For example, if the consumer’s first choice is preferred to their secondchoice, then utility from the first choice will be higher than utility from the secondchoice. How much higher is not important. An ordinal utility function generates aranking of bundles and no meaning is given to the utility number itself. Cardinalutility implies that the intensity of preferences may be quantified, and that the utilitynumber itself has meaning. An ordinal ranking is all that is needed to rank consumerchoices. It is not necessary to know how intensely a consumer prefers basket A overbasket B; it is enough to know that A is preferred to B.9. Upon merging with the West German economy, East German consumers indicated a preference for Mercedes-Benz automobiles over Volkswagens. However, when they converted their savings into deutsche marks, they flocked to Volkswagen dealerships. How can you explain this apparent paradox?Three assumptions are required to address this question: 1) that a Mercedes costs morethan a Volkswagen; 2) that the East German consumers’ utility function comprises twogoods, automobiles and all other goods evaluated in deutsche marks; and 3) that EastGermans have incomes. Based on these assumptions, we can surmise that while EastGerman consumers may prefer a Mercedes to a Volkswagen, they either cannot afford aMercedes or they prefer a bundle of other goods plus a Volkswagen to a Mercedes alone.While the marginal utility of consuming a Mercedes exceeds the marginal utility ofconsuming a Volkswagen, the consumer will consider marginal utility per dollar foreach good. This means the marginal utility per dollar must have been higher for theVolkswagen since consumers flocked to the Volkswagen dealerships and not theMercedes dealerships.10. Draw a budget line and then draw an indifference curve to illustrate the satisfaction maximizing choice associated with two products. Use your graph to answer the following questions.a.Suppose that one of the products is rationed. Explain why the consumer is likelyto be worse off.When goods are not rationed, the consumer is able to choose the satisfaction-maximizing bundle where the slope of the budget line is equal to the slope of theindifference curve, or the price ratio is equal to the MRS. This is point A in the graphbelow. If good 1 is now rationed the consumer will not be able to attain the utilitymaximizing point. He or she will have to consume more of the other good instead.This is point B below.b.Suppose now that the price of one of the products is fixed at a level below thecurrent price. As a result, the consumer is not able to purchase as much as she would like of the product. Can you tell if the consumer is better off or worse off?When the price of the good is fixed at a level below the current (equilibrium) price,there will be a shortage of the good and the good will have to be effectively rationed.As in the question above, the consumer is worse off because she is not able to attainher utility maximizing point.11. Based on his preferences, Bill is willing to trade 4 movie tickets for 1 ticket to a basketball game. If movie tickets cost $8 each and a ticket to the basketball game costs $40, should Bill make the trade? Why or why not?No Bill should not make the trade. If he gives up the 4 movie tickets then he willsave $8 per ticket for a total of $32. However, this is not enough for a basketballticket. He would in fact have to give up 5 movie tickets if he wanted to buy anotherbasketball ticket. Notice also, that the marginal utility per dollar is higher for movietickets so Bill will be better off if he consumes more movie tickets and fewerbasketball tickets. To figure this out recall that what Bill is willing to do defines hisMRS. His MRS is 4 so this means that the marginal utility of a basketball game is 4and the marginal utility of a movie is 1:MRS=-4=-MUballMUmovie=-41.Now the marginal utility per dollar can be computed:MUball Pball =440=110MUmovie Pmovie =18.12. Describe the equal marginal principle. Explain why this principle may not hold if increasing marginal utility is associated with the consumption of one or both goods.The equal marginal principle states that the ratio of the marginal utility to price mustbe equal across all goods to obtain maximum satisfaction. In other words, utilitymaximization is achieved when the budget is allocated so that the marginal utility perdollar of expenditure is the same for each good. If the marginal utility per dollar is notequal then utility can be increased by allocating more dollars to the good with thehigher marginal utility per dollar. The consumer will obtain more “bang for the buck”if they reallocate their dollars.If marginal utility is increasing, the consumer maximizes satisfaction by consumingever larger amounts of the good. Thus, the consumer would spend all income on onegood, assuming a constant price, resulting in a corner solution. With a corner solution,the equal marginal principle cannot hold.13. The price of computers has fallen substantially over the past two decades. Use this drop in price to explain why the Consumer Price Index is likely to overstate substantially the cost-of-living index for individuals who use computers intensively.The consumer price index measures the cost of a typical basket of goods purchased bythe consumer in the current year relative to the cost of the basket in the base year.Each good in the basket is assigned a weight, which reflects the importance of the goodto the consumer, and the weights are kept fixed from year to year. The problem withfixing the weights is that consumers will shift their purchases from year to year to givemore weight to goods whose prices have fallen, and less weight to goods whose priceshave risen. The CPI will therefore give too much weight to goods whose prices haverisen, and too little weight to goods whose prices have fallen. For the individual whouses computers intensively, the fixed weight for computers in the basket willunderstate the importance of this good, and will hence understate the effect of the fallin the price of computers. The CPI will overstate the rise in the cost of living for thistype of individual.14. Explain why the Paasche index will generally understate the ideal cost-of-living index.The Paasche index measures the current cost of the current bundle of goods relativeto the base year cost of the current bundle of goods. The Paasche index willunderstate the ideal cost of living because it assumes the individual will buy thecurrent year bundle in the base period. In reality, at base year prices the consumerwould have been able to attain the same level of utility at a lower cost by alteringtheir consumption bundle. Since the base year cost is overstated, the denominatorwill be larger and the index will be lower, or understated.1. In this chapter, consumer preferences for various commodities did not change during the analysis. Yet in some situations, preferences do change as consumption occurs. Discuss why and how preferences might change over time with consumption of these two commodities:a. cigarettesThe assumption that preferences do not change is a reasonable one if choices areindependent across time. It does not hold, however, when “habit-forming” or addictivebehavior is involved, as in the case of cigarettes: the consumption of cigarettes in oneperiod influences their consumption in the next period.b. dinner for the first time at a restaurant with a special cuisineThis example is parallel to examples of adventure seeking. For some, a new diningexperience creates enthusiasm to seek out more exciting and different cuisines anddishes. For others, they develop a fondness for regularity and consistency or fear ofthe new and unknown. In either of these cases, choices change as consumption occurs.2. Draw indifference curves that represent the following individuals’ preferences for hamburgers and soft drinks. Indicate the direction in which the individuals’ satisfaction (or utility) is increasing.a.Joe has convex preferences and dislikes both hamburgers and soft drinks.Since Joe dislikes both goods, his set of indifference curves will be bowed inwardstowards the origin instead of outwards, as in the normal case where more is preferredto less. Given he dislikes both goods, his satisfaction is increasing in the direction ofthe origin. Convexity of preferences implies his indifference curves will have thenormal shape in that they are bowed towards the direction of increasing satisfaction.Convexity also implies that given any two bundles between which the consumer isindifferent, the “average” of the two bundles will be in the preferred set, or wi ll leavehim at least as well off.so ft dr in kb.Jane loves hamburgers and dislikes soft drinks. If she is served a soft drink, shewill pour it down the drain rather than drink it.Since Jane can freely dispose of the soft drink if it is given to her, she considers it to be aneutral good. This means she does not care about soft drinks one way or the other.With hamburgers on the vertical axis, her indifference curves are horizontal lines. Herso ft dr in kc.Bob loves hamburgers and dislikes soft drinks. If he is served a soft drink, he willdrink it to be polite.Since Bob will drink the soft drink in order to be polite, it can be thought of as a “bad”.When served another soft drink, he will require more hamburgers at the same timein order to keep his satisfaction constant. More soft drinks without morehamburgers will worsen his utility. More hamburgers and fewer soft drinks willincrease his utility.s o ft d rin kd.Molly loves hamburgers and soft drinks, but insists on consuming exactly one softdrink for every two hamburgers that she eats.Molly wants to consume the two goods in a fixed proportion so her indifference curvesare L-shaped. For any given amount of one good, she gets no extra satisfaction fromhaving more of the other good. She will only increase her satisfaction if she hasmore of both goods.s o ft d rin ke.Bill likes hamburgers, but neither likes nor dislikes soft drinks.Like Jane, Bill considers soft drinks to be a neutral good. Since he does not careabout soft drinks one way or the other we can assume that no matter how many hehas, his utility will be the same. His level of satisfaction depends entirely on hows o ft d rin kf.Mary always gets twice as much satisfaction from an extra hamburger as she doesfrom an extra soft drink.How much extra satisfaction Mary gains from an extra hamburger or soft drink tellsus something about the marginal utilities of the two goods, or about her MRS. If shealways receives twice the satisfaction from an extra hamburger then her marginalutility from consuming an extra hamburger is twice her marginal utility fromconsuming an extra soft drink. Her MRS, with hamburgers on the vertical axis, is1/2.so ft dr in k3. If Jane is currently willing to trade 4 movie tickets for 1 basketball ticket then she must like basketball better than movies. True or false? Explain.This statement is not necessarily true. If she is always willing to trade 4 movietickets for 1 basketball ticket then yes she likes basketball better because she willalways gain the same satisfaction from 4 movie tickets as she does from 1 basketballticket. However, it could be that she has convex preferences (diminishing marginalrate of substitution) and is at a bundle where she has a lot of movie tickets relative tobasketball tickets. This would make her willing to give up more movie tickets to getanother basketball ticket. It would not mean though that she liked basketball better.Her willingness to give up a good would in this case depend on the quantity of eachgood in her current basket.4. Janelle and Brian each plan to spend $20,000 on the styling and gas mileage features of a new car. They can each choose all styling, all gas mileage, or some combination of the two. Janelle does not care at all about styling and wants the best gas mileage possible. Brian likes both equally and wants to spend an equal amount on the two features. Using indifference curves and budget lines, illustrate the choice that each person will make.Assume styling is on the vertical axis and gas mileage is on the horizontal axis.Janelle has indifference curves that are vertical. If the styling is there she will takeit, but she otherwise does not care about it. As her indifference curves move over tothe right, she gains more gas mileage and more satisfaction. She will spend all$20,000 on gas mileage. Brian has indifference curves that are L-shaped. He willnot spend more on one feature than on the other feature. He will spend $10,000 onstyling and $10,000 on gas mileage.5. Suppose that Bridget and Erin spend their income on two goods, food (F) and clothing(C). Bridget’s preferences are represented by the utility function U(F,C)=10FC, while Erin’s preferences are represented by the utility function U(F,C)=.20F2C2.a.On a graph, with food on the horizontal axis and clothing on the vertical axis,identify the set of points that give Bridget the same level of utility as the bundle (10,5). Do the same for Erin on a separate graph.Bridget receives a utility of 10*10*5=500 from this bundle. The indifference curve isrepresented by the equation 10FC=500 or FC=50. Some bundles on this indifferencecurve are (5,10), (10,5), (25,2), and (2,25). Erin receives a utilityof .2*10*10*5*5=500 from the bundle (10,5). Her indifference curve is representedby the equation 500=.2F2C2, or 50=FC. This is the same indifference curve asBridget. Both indifference curves have the normal, convex shape.b.On the same two graphs, identify the set of bundles that give Bridget and Erin thesame level of utility as the bundle (15,8).For each person, plug in F=15 and C=8 into their respective utility functions. ForBridget, this gives her a utility of 1200, so her indifference curve is given by theequation 10FC=1200, or FC=120. Some bundles on this indifference curve are(12,10), (10,12), (3,40), and (40,3). For Erin, this bundle gives her a utility of 2880,so her indifference curve is given by the equation 2880=.2F2C2, or FC=120.This is the same indifference curve as Bridget.c.Do you think Bridget and Erin have the same preferences or different preferences?Explain.They have the same preferences because for any given bundle they have the samelevel of utility. This means that they will rank all bundles in the same order. Notehowever, that it is not necessary that they receive the same level of utility to have thesame set of preferences. All that is necessary is that they rank the bundles in thesame order.6. Suppose that Jones and Smith have each decided to allocate $1,000 per year to an entertainment budget in the form of hockey games or rock concerts. They both like hockey games and rock concerts and will choose to consume positive quantities of both goods. However, they differ substantially in their preferences for these two forms of entertainment. Jones prefers hockey games to rock concerts, while Smith prefers rock concerts to hockey games.a. Draw a set of indifference curves for Jones and a second set for Smith.Given they each like both goods and they will each choose to consume positivequantities of both goods, we can assume their indifference curves have the normalconvex shape. However since Jones has an overall preference for hockey and Smithhas an overall preference for rock concerts, their two sets of indifference curves willhave different slopes. Suppose that we place rock concerts on the vertical axis andhockey games on the horizontal axis, Jones will have a larger MRS than Smith.Jones is willing to give up more rock concerts in exchange for a hockey game since heprefers hockey games. The indifference curves for Jones will be steeper.b. Using the concept of marginal rate of substitution, explain why the two sets ofcurves are different from each other.At any combination of hockey games and rock concerts, Jones is willing to give up morerock concerts for an additional hockey game, whereas, Smith is willing to give up fewerrock concerts for an additional hockey game. Since the MRS is a measure of how manyof one good (rock concerts) an individual is willing to give up for an additional unit ofthe other good (hockey games), then the MRS, and hence the slope of the indifferencecurves, will be different for the two individuals.7. The price of DVDs (D) is $20 and the price of CDs (C) is $10. Philip has a budget of $100 to spend on the two goods. Suppose that he has already bought one DVD and one CD. In addition there are 3 more DVDs and 5 more CDs that he would really like to buy.a.Given the above prices and income, draw his budget line on a graph with CDs onthe horizontal axis.His budget line is PD D+PCC=I, or 20D+10C=100. If he spends his entire incomeon DVD’s he could afford to buy 5. If he spends his entire income on CD’s he couldafford to buy 10.b.Considering what he has already purchased, and what he still wants to purchase,identify the three different bundles of CDs and DVDs that he could choose.Assume that he cannot purchase fractional units for this part of the question.Given he has already purchased one of each, for a total of $30, he has $70 left. Sincehe wants 3 more DVD’s he can buy these for $60 and spend his remaining $10 on 1CD. This is the first bundle below. He could also choose to buy only 2 DVD’s for$40 and spend the remaining $30 on 3 CD’s. He can choose the following bundles: Purchased Quantities Total QuantitiesD C D C3 1 2 62 3 3 41 5 4 28. Anne has a job that requires her to travel three out of every four weeks. She has an annual travel budget and can either travel by train or by plane. The airline she typically flies with has a frequent traveler program that reduces the cost of her tickets depending on the number of miles she has flown in a given year. When she reaches 25,000 miles the airline will reduce the price of her tickets by 25% for the remainder of the year. When she reached 50,000 miles, the airline will reduce the price of her tickets by 50% for the remainder of the year. Graph Anne’s budget line, with train miles on the vertical axis and plane miles on the horizontal axis.The typical budget line is linear (with a constant slope) because the prices of the twogoods do not change as the consumer buys more or less of a particular good. In thiscase, the price of airline miles will change depending on how many miles shepurchases. As the price changes, the slope of the budget line will change. Sincethere are three prices, there will be three slopes, or two kinks, to the budget line.Since the price falls as she flies more miles, the budget line will become flatter withevery price change. See the graph in the problem below.9. Debra usually buys a soft drink when she goes to a movie theater, where she has a choice of three sizes: the 8 ounce drink costs $1.50, the 12 ounce drink, $2.00, and the 16 ounce drink, $2.25. Describe the budget constraint that Debra faces when deciding how many ounces of the drink to purchase. (Assume that Debra can costlessly dispose of any of the soft drink that she does not want.First notice that as the size of the drink increases, the price per ounce decreases.When she buys the 8-ounce soft drink she pays $1.508oz$0.19 per oz.When shebuys the 12-ounce size she pays $0.17 per ounce, and when she buys the 16-ounce size, she pays $0.14 per ounce. Given that there are three different prices per ounce of soft drink, the budget line will have two kinks in it, as illustrated below. Notice that at each kink, the slope of the budget line gets flatter (due to the decreasing cost per ounce relative to the “other good” on the vertical axis).O u n ces o fS o ft D rin k 81216。
平狄克微观经济学课后习题答案中文
第一章复习题1.市场是通过相互作用决定一种或一系列产品价格的买卖双方的集合,因此可以把市场看作决定价格的场所。
行业是出售相同的或紧密相关的产品的厂商的集合,一个市场可以包括许多行业。
2.评价一个理论有两个步骤:首先,需要检验这个理论假设的合理性;第二,把该理论的预测和事实相比较以此来验证它。
如果一个理论无法被检验的话,它将不会被接受。
因此,它对我们理解现实情况没有任何帮助。
3.实证分析解释“是什么”的问题,而规范分析解释的是“应该是什么”的问题。
对供给的限制将改变市场的均衡。
A中包括两种分析,批评这是一种“失败的政策”——是规范分析,批评其破坏了市场的竞争性——是实证分析。
B向我们说明在燃油的配给制下总社会福利的被损坏——是实证分析。
4.由于两个市场在空间上是分离的,商品在两地间的运输是套利实现的条件。
如果运输成本为零,则可以在Oklahoma购买汽油,到New Jersey出售,赚取差价;如果这个差价无法弥补运输成本则不存在套利机会。
5.商品和服务的数量与价格由供求关系决定。
鸡蛋的实际价格从1970年至1985年的下降,一方面是由于人们健康意识的提高而导致鸡蛋需求的减少,同时也因为生产成本的降低。
在这两种因素下,鸡蛋的价格下降了。
大学教育的实际价格的升高,是由于越来越多的人倾向于获得大学教育而导致需求提高,同时教育的成本也在升高。
在这两方面因素作用下,大学教育费用提高了。
6.日圆相对美圆来说,价值升高,升值前相比,兑换同样数量的日圆需要付出更多的美圆。
由汇率的变化引起购买力的变化,在日本市场出售的美国汽车,由于美圆贬值日圆升值,持有日圆的消费者将较以前支付较底的价格;而在美国市场出售的日本汽车,由于日圆升值美圆贬值,持有美圆的消费者将面对较以前提高的价格。
4.长期弹性和短期弹性区别在于消费者对价格变化的反映速度以及可获得的替代品。
对纸巾这样的非耐用品,价格上升,消费者在短期内的反映很小。
但在长期,对纸巾的需求将会变得富有弹性。
- 1、下载文档前请自行甄别文档内容的完整性,平台不提供额外的编辑、内容补充、找答案等附加服务。
- 2、"仅部分预览"的文档,不可在线预览部分如存在完整性等问题,可反馈申请退款(可完整预览的文档不适用该条件!)。
- 3、如文档侵犯您的权益,请联系客服反馈,我们会尽快为您处理(人工客服工作时间:9:00-18:30)。
• demand • supply • market equilibrium • shocking the equilibrium • effects of government interventions • when to use supply and demand model
• change in any other factor besides the price causes a shift of the demand curve
Variable definitions
• Q = quantity of pork demanded (million kg per year)
curves: Q1 = D1(P) Q2 = D2(P) • total quantity demanded = horizontal sum of quantity each consumer demands at each given price: Q = Q1 + Q2 = D1(P) + D2(P)
• P = price of pork ($ per kg) • Pb = price of beef ($ per kg) • Pc = price of poultry ($ per kg) • I = income of consumers (thousand $)
Demand function
quantity demanded (holding other factors constant) • one of the most important empirical finding in economics
Demand effects of other factors
• change in any factor other than the price of the good causes a shift of the deng the demand curve)
Demand Curve for Canadian Pork
Effect of price changes
• movement along the demand curve • demand curve is a concise summary of the
answer to the question:
Supply and demand model
• most widely-used economic model • testable (like all good theories) • describes how consumers and suppliers
interact in a market to determine quantity of a good sold and its price
beef causes some people to switch from beef to pork
A Shift of the Pork Demand Curve
Summary
• change in the price of a good causes a movement along a demand curve
• note: quantity demanded of a good or service can exceed quantity sold (or vice versa)
• strange demand curve convention: price is on the vertical axis
Demand curve
• shows quantity demanded—largest quantity that consumers are willing to buy—at each price, holding constant other factors that affect purchases
To use supply and demand model
• you need to determine
• buyers' behavior • sellers' behavior • how they interact
• know whether the model is: applicable to the market under examination
what happens to the quantity demanded as the price changes, holding all other factors constant?
Law of demand
• demand curves slope down • a drop in price results in an increase in
• general function Q = D(P, Pb, Pc, I)
• specific (linear) pork demand function Q = 171 – 20P + 20Pb + 3Pc + 2I
Summing demand curves
• total demand is sum of demand for all consumers • suppose there are 2 consumers with demand
• this shift of the demand curve is a trick to avoid drawing 3D diagrams
Effect on pork demand of a rise in price of beef
• beef is a substitute for pork • at a given price of pork, a rise in the price of