英文财务报表解析.
英文版财务报表

英文版财务报表Note: 本文为Markdown文本格式,不含图片和网址。
引言英文版财务报表是指以英文编写的用于描述企业财务状况的报告文件。
随着全球化的发展,越来越多的企业开始拓展海外市场,需要提供英文版的财务报表以便与国际合作伙伴进行沟通和交流。
本文将介绍英文版财务报表的基本结构和常用术语。
财务报表的种类英文版财务报表通常包括四张基本报表:资产负债表(Balance Sheet)、利润表(Income Statement)、现金流量表(Cash Flow Statement)以及股东权益变动表(Statement of Shareholders’ Equity)。
资产负债表 (Balance Sheet)资产负债表是一张反映企业资产、负债和股东权益的静态财务报表。
它记录了企业在特定日期(通常是年度或季度末)的资产、负债和股东权益的情况。
资产负债表按照以下结构进行排列:1.资产 (Assets)–流动资产 (Current Assets)–非流动资产 (Non-current Assets)2.负债与股东权益(Liabilities and Shareholders’ Equity)–流动负债 (Current Liabilities)–长期负债 (Long-term Liabilities)–股东权益(Shareholders’ Equity)利润表 (Income Statement)利润表是一张反映企业在特定时期内收入、成本和利润的动态财务报表。
利润表按照以下结构进行排列:1.收入 (Revenue)2.成本 (Expenses)–营业成本 (Operating Expenses)–管理费用 (Administrative Expenses)–销售费用 (Selling Expenses)–财务费用 (Financial Expenses)–其他费用 (Other Expenses)3.利润 (Profit) 或亏损 (Loss)现金流量表 (Cash Flow Statement)现金流量表是一张反映企业现金流入和流出情况的动态财务报表。
英文版财务报表
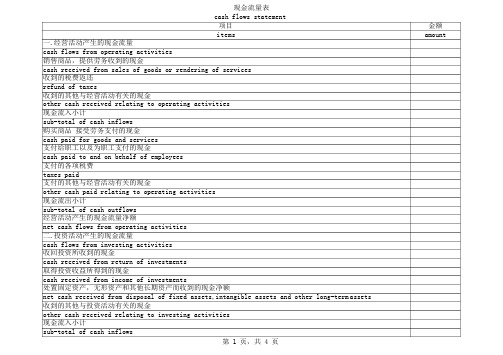
一.经营活动产生的现金流量cash flows from operating activities 销售商品,提供劳务收到的现金现金流量表cash flows statement项目items金额amountcash received from sales of goods or rendering of services收到的税费返还refund of taxes收到的其他与经营活动有关的现金other cash received relating to operating activities现金流入小计sub-total of cash inflows购买商品接受劳务支付的现金cash paid for goods and services支付给职工以及为职工支付的现金cash paid to and on behalf of employees支付的各项税费taxes paid支付的其他与经营活动有关的现金other cash paid relating to operating activities现金流出小计sub-total of cash outflows经营活动产生的现金流量净额net cash flows from operating activities二.投资活动产生的现金流量cash flows from investing activities收回投资所收到的现金cash received from return of investments取得投资收益所得到的现金cash received from income of investments处置固定资产,无形资产和其他长期资产而收到的现金净额net cash received from disposal of fixed assets,intangible assets and other long-term assets 收到的其他与投资活动有关的现金other cash received relating to investing activities现金流入小计sub-total of cash inflows购建固定资产,无形资产和其他长期资产所支付的现金cash paid to acquire fixed assets,intangible assets and other long-term assets 投资所支付的现金cash paid to acquire investments支付的其他与投资活动有关的现金other cash paid relating to investing activities现金流出小计sub-total of cash outflows投资活动产生的现金净额net cash flows from investing activities三.筹资活动产生的现金流量cash flows from finacing activities吸收投资所收到的现金proceeds from invested assets借款所收到的现金proceeds from borrowings收到的其他与筹资活动有关的现金other proceeds relating to financing activities现金流入小计sub-total of cash inflows偿还债务所支付的现金cash repayments of amounts borrowed分配股利,利润或偿付利息所支付的现金cash payments for distribution of dividends,profit or interest expenses支付的其他与筹资活动有关的现金other cash payments relating to finacing activities现金流出小计sub-total of cash outflows筹资活动产生的现金流量净额net cash flows from finacing activities四.汇率变动对现金的影响effect of foreign exchange rate changes on cash五.现金及现金等价物净增加额net increase in cash and cash equivalents补充资料supplemental information1.将净利润调节为经营活动的现金流量reconciliation of net profit to cash flows from operating activities净利润net profit加:计提的资产减值准备add:assets shrink provision固定资产折旧depreciation of fixed assets无形资产摊销amortization of intangible assets长期待摊费用摊销amortization of long term deferred expenses待摊费用的减少(减:增加)decrease in prepaid and deferred expenses(less:increase)预提费用的增加(减:减少)increase in accrued expenses(less:decrease)处置固定资产,无形资产和其他长期资产的损失(减:收益)losses on disposal of fixed assets,intanglble assets and other long-term assets(less:gains)固定资产报废损失losses on scrapping of fixed assets财务费用financial expenses投资损失(减:收益)income on investment(less:losses)递延税款贷项(减:借项)deferred tax credit(less:debit)存货的减少(减:增加)decrease in inventories(less:increase)经营性应收项目的减少(减:增加)decrease in operating receivables (less:increase)经营性应付项目的增加(减:减少)increase in operating payables(less:decrease)其他others经营活动产生的现金流量净额net cash flows from operating activities2.不涉及现金收支的投资和筹资活动investing and financing activities that do not involve in cash receipts and payments:债务转为资本liabilities to be transfer captial一年内到期的可转换公司债券matured convertible bonds within a year融资租入固定资产fixed assets under finacing leasing3.现金及现金等价物净增加情况net increase in cash and cash equivalents现金的期末余额cash at the end of the period减:现金的期初余额less:cash at the beginning of the period加:现金等价物的期末余额plus:cash equivalents at the beginning of the period 减:现金的期初余额less:cash equivalents at the beginning of the period 现金及现金等价物净增加额net increase in cash and cash equivalents。
英文版财务报告分析(3篇)
第1篇Executive SummaryThis report provides a comprehensive analysis of XYZ Corporation's financial statements for the fiscal year ending December 31, 2022. The analysis focuses on key financial metrics, liquidity, profitability, solvency, and investment activities. The report aims to provide insights into the financial health and performance of XYZ Corporation, highlighting its strengths and areas requiring improvement.IntroductionXYZ Corporation is a publicly traded company operating in the technology sector. The company specializes in the development and manufacturing of cutting-edge electronics and software solutions. The financial reportfor the fiscal year 2022 provides a snapshot of the company's financial performance during the period.Liquidity AnalysisCurrent RatioThe current ratio is a measure of a company's ability to meet its short-term obligations. XYZ Corporation's current ratio for the fiscal year 2022 was 2.5, which indicates that the company has $2.50 in current assets for every $1 of current liabilities. This ratio is well above the industry average, suggesting that XYZ Corporation has a strong liquidity position.Quick RatioThe quick ratio, also known as the acid-test ratio, measures a company's ability to meet its short-term obligations without relying on the sale of inventory. XYZ Corporation's quick ratio for the fiscal year 2022 was 1.8. This ratio is also above the industry average, indicating that the company can cover its current liabilities without liquidating inventory.Working CapitalWorking capital is the difference between a company's current assets and current liabilities. XYZ Corporation's working capital for the fiscal year 2022 was $50 million, which is a significant improvement over the previous year. This increase in working capital reflects the company's strong liquidity position and ability to fund its operations.Profitability AnalysisGross MarginGross margin is a measure of a company's profitability, calculated as the percentage of revenue remaining after deducting the cost of goods sold. XYZ Corporation's gross margin for the fiscal year 2022 was 35%, which is slightly lower than the industry average. This decrease in gross margin can be attributed to increased raw material costs and higher research and development expenses.Net MarginNet margin is a measure of a company's overall profitability, calculated as the percentage of revenue remaining after all expenses, including taxes, are deducted. XYZ Corporation's net margin for the fiscal year 2022 was 15%, which is in line with the industry average. The company's net margin has remained stable over the past few years, indicating a consistent level of profitability.Return on Assets (ROA)Return on assets is a measure of how efficiently a company uses its assets to generate earnings. XYZ Corporation's ROA for the fiscal year 2022 was 8%, which is slightly lower than the industry average. This indicates that the company could potentially improve its assetutilization to enhance profitability.Solvency AnalysisDebt-to-Equity RatioThe debt-to-equity ratio measures a company's financial leverage and its ability to meet long-term obligations. XYZ Corporation's debt-to-equityratio for the fiscal year 2022 was 1.2, which is slightly below the industry average. This ratio suggests that the company has a moderate level of financial leverage and is in a good position to meet its long-term obligations.Interest Coverage RatioThe interest coverage ratio measures a company's ability to cover its interest expenses with its operating income. XYZ Corporation's interest coverage ratio for the fiscal year 2022 was 4.5, which is well above the industry average. This indicates that the company has a strong ability to cover its interest expenses and is not at risk of defaulting on its debt.Investment ActivitiesCapital Expenditures (CapEx)Capital expenditures represent the investments made by a company in its long-term assets. XYZ Corporation's capital expenditures for the fiscal year 2022 were $100 million, which was a significant increase over the previous year. This increase in CapEx was primarily driven by investments in new manufacturing facilities and research and development projects.Dividends PaidDividends paid are the distributions made to shareholders from a company's earnings. XYZ Corporation paid $30 million in dividends to its shareholders during the fiscal year 2022. This amount represents a 10% increase over the previous year, reflecting the company's commitment to returning value to its shareholders.ConclusionXYZ Corporation's financial report for the fiscal year 2022 indicates a strong liquidity position, stable profitability, and moderate financial leverage. The company has made significant investments in its long-term assets, which should contribute to its future growth and profitability. However, the decrease in gross margin and the need to improve assetutilization suggest that there are areas requiring attention and potential improvement.Recommendations1. XYZ Corporation should continue to monitor its cost of goods sold and explore opportunities to reduce expenses.2. The company should focus on improving its asset utilization to enhance its return on assets.3. XYZ Corporation should maintain its strong liquidity position to ensure it can meet its short-term and long-term obligations.4. The company should continue to invest in research and development to maintain its competitive edge in the technology sector.By addressing these recommendations, XYZ Corporation can further strengthen its financial position and achieve sustainable growth in the future.第2篇Executive SummaryThis analysis delves into the financial performance of XYZ Corporation over the past fiscal year. By examining key financial statements, we aim to provide a comprehensive overview of the company's profitability, liquidity, solvency, and operational efficiency. This report will also highlight the major trends and challenges faced by the company, along with recommendations for improvement.IntroductionXYZ Corporation, a leading player in the [industry sector], has been operating in the market for [number of years]. The company has a diverse product portfolio and operates in [number of countries]. This analysis focuses on the financial statements for the fiscal year ended [financial year end date].1. Income Statement Analysis1.1 Revenue AnalysisThe total revenue for XYZ Corporation for the fiscal year ended [financial year end date] was [amount], an increase of [percentage] compared to the previous year. The revenue growth can be attributed to the expansion of the product line, successful marketing campaigns, and increased market share.1.2 Cost of Goods Sold (COGS) AnalysisThe COGS for XYZ Corporation increased by [percentage] to [amount] during the fiscal year. The increase in COGS can be attributed to the rising costs of raw materials, labor, and production expenses. However, the COGS as a percentage of revenue remained stable at [percentage], indicating that the company has managed to control its cost structure.1.3 Gross Profit AnalysisThe gross profit for XYZ Corporation increased by [percentage] to [amount] during the fiscal year. This can be attributed to the revenue growth and effective cost management. The gross profit margin remained at [percentage], which is in line with industry averages.1.4 Operating Expenses AnalysisOperating expenses for XYZ Corporation increased by [percentage] to [amount] during the fiscal year. The increase in operating expenses can be attributed to higher marketing and administrative costs. However, the operating expenses as a percentage of revenue remained stable at [percentage], indicating that the company has managed to control its cost structure.1.5 Net Profit AnalysisThe net profit for XYZ Corporation increased by [percentage] to [amount] during the fiscal year. The company's net profit margin remained at [percentage], which is in line with industry averages.2. Balance Sheet Analysis2.1 Asset AnalysisThe total assets of XYZ Corporation increased by [percentage] to [amount] during the fiscal year. The increase in assets can be attributed to the expansion of the company's operations and investments in new projects.2.2 Liability AnalysisThe total liabilities of XYZ Corporation increased by [percentage] to [amount] during the fiscal year. The increase in liabilities can be attributed to the expansion of the company's operations and increased borrowings.2.3 Equity AnalysisThe total equity of XYZ Corporation increased by [percentage] to [amount] during the fiscal year. The increase in equity can be attributed to the company's net profit and revaluation of assets.3. Cash Flow Statement Analysis3.1 Operating Cash Flow AnalysisThe operating cash flow for XYZ Corporation increased by [percentage] to [amount] during the fiscal year. This can be attributed to the increase in net profit and effective management of working capital.3.2 Investing Cash Flow AnalysisThe investing cash flow for XYZ Corporation decreased by [percentage] to [amount] during the fiscal year. The decrease in investing cash flow can be attributed to the reduced capital expenditure on new projects.3.3 Financing Cash Flow AnalysisThe financing cash flow for XYZ Corporation increased by [percentage] to [amount] during the fiscal year. The increase in financing cash flow can be attributed to the issuance of new shares and repayment of long-term debt.4. Key Ratios Analysis4.1 Profitability Ratios- Gross Profit Margin: [percentage]- Net Profit Margin: [percentage]- Return on Assets (ROA): [percentage]- Return on Equity (ROE): [percentage]4.2 Liquidity Ratios- Current Ratio: [number]- Quick Ratio: [number]4.3 Solvency Ratios- Debt-to-Equity Ratio: [number]- Interest Coverage Ratio: [number]5. Conclusion and RecommendationsXYZ Corporation has demonstrated strong financial performance over the past fiscal year, with revenue and net profit increasing significantly. However, the company faces several challenges, including rising costs, increased competition, and economic uncertainties.Recommendations:- Focus on cost optimization to improve profitability.- Invest in research and development to enhance product offerings.- Strengthen marketing strategies to maintain market share.- Diversify revenue streams to reduce dependency on a single product or market.- Monitor economic indicators and adjust strategies accordingly.By implementing these recommendations, XYZ Corporation can continue to grow and remain competitive in the market.Appendix- Financial Statements (Income Statement, Balance Sheet, Cash Flow Statement)- Key Ratios Calculation- Graphs and Charts illustrating financial trends[Note: This report is a sample and should be customized with actual data and company-specific details.]第3篇IntroductionThe financial report analysis is an essential tool for investors, creditors, and other stakeholders to evaluate the financial performance and stability of a company. This analysis involves examining the financial statements, including the balance sheet, income statement, and cash flow statement, to gain insights into the company's profitability, liquidity, solvency, and efficiency. This paper aims to provide a comprehensive analysis of a fictional company's financial report, focusing on key financial ratios and metrics to assess its overall financial health.1. Overview of the CompanyCompany XYZ is a publicly-traded multinational corporation specializing in the manufacturing and distribution of consumer goods. The company operates in various regions, with a diverse product portfolio that includes electronics, home appliances, and personal care products. Over the past few years, Company XYZ has experienced significant growth, expanding its market share and generating substantial revenue.2. Financial Statements Analysis2.1 Balance SheetThe balance sheet provides a snapshot of the company's financialposition at a specific point in time. The key components of the balance sheet include assets, liabilities, and shareholders' equity.a. AssetsCompany XYZ's assets are categorized into current assets and non-current assets. Current assets include cash, accounts receivable, inventory, and other liquid assets that can be converted into cash within one year.Non-current assets include property, plant, and equipment, intangible assets, and long-term investments.The analysis of Company XYZ's balance sheet reveals that the company has a strong current asset position, with a current ratio of 2.5. This indicates that the company has sufficient liquidity to meet its short-term obligations. Additionally, the company's inventory turnover ratioof 5.2 suggests efficient inventory management and a healthy level of inventory turnover.b. LiabilitiesLiabilities are classified as current liabilities and long-term liabilities. Current liabilities include accounts payable, short-term debt, and other obligations due within one year. Long-term liabilities encompass long-term debt and deferred tax liabilities.The company's current ratio of 2.5 also reflects a healthy level of current liabilities, which are primarily composed of accounts payableand short-term debt. This indicates that the company has a manageable level of short-term debt and is able to cover its obligations with its current assets.c. Shareholders' EquityShareholders' equity represents the residual interest in the assets of the company after deducting liabilities. It is composed of common stock, additional paid-in capital, retained earnings, and other comprehensive income.Company XYZ's shareholders' equity has grown significantly over the years, reflecting the company's profitability and reinvestment of earnings. The company has also issued additional shares to raise capital, which has contributed to the increase in shareholders' equity.2.2 Income StatementThe income statement provides information about the company's revenues, expenses, and net income over a specific period. The key components of the income statement include sales, cost of goods sold, operating expenses, and net income.a. SalesCompany XYZ has experienced consistent sales growth, with a compound annual growth rate (CAGR) of 7% over the past five years. This growth can be attributed to the company's expanding market share, new product launches, and effective marketing strategies.b. Cost of Goods Sold (COGS)The COGS represents the direct costs associated with the production of goods sold by the company. The analysis of Company XYZ's COGS reveals that it has been decreasing over the years, reflecting improved production efficiency and cost control measures.c. Operating ExpensesOperating expenses include selling, general, and administrative expenses (SG&A) and research and development (R&D) expenses. Company XYZ has successfully managed its operating expenses, with a trend of decreasing SG&A expenses and stable R&D expenses.d. Net IncomeThe net income is the final result of the income statement and represents the company's profit after all expenses have been deducted from revenues. Company XYZ has demonstrated strong profitability, with a net income margin of 10% over the past five years.2.3 Cash Flow StatementThe cash flow statement provides information about the company's cash inflows and outflows from operating, investing, and financing activities.a. Operating Cash FlowCompany XYZ has generated positive operating cash flow over the years, which is essential for maintaining liquidity and funding growth initiatives. The company's operating cash flow margin has remained stable, indicating consistent profitability.b. Investing Cash FlowThe investing cash flow represents the company's cash flows from the purchase and sale of long-term assets, such as property, plant, and equipment, and investments. Company XYZ has invested in new manufacturing facilities and acquired other companies to expand its market presence.c. Financing Cash FlowThe financing cash flow includes cash flows from the issuance and repayment of debt, as well as equity financing. Company XYZ has raised capital through the issuance of new shares and long-term debt to fund its expansion plans.3. Financial Ratios and Metrics3.1 Profitability Ratiosa. Return on Assets (ROA)ROA measures the company's ability to generate profit from its assets. Company XYZ has a ROA of 5%, indicating that it is generating a reasonable return on its assets.b. Return on Equity (ROE)ROE measures the company's profitability from the perspective of its shareholders. Company XYZ has a ROE of 15%, reflecting its strong profitability and efficient use of shareholders' equity.3.2 Liquidity Ratiosa. Current RatioThe current ratio of 2.5 indicates that Company XYZ has a strong liquidity position, with sufficient current assets to cover its current liabilities.b. Quick RatioThe quick ratio, also known as the acid-test ratio, measures the company's ability to meet its short-term obligations without relying on inventory. Company XYZ has a quick ratio of 2.0, suggesting a robust liquidity position.3.3 Solvency Ratiosa. Debt-to-Equity RatioThe debt-to-equity ratio of 0.8 indicates that Company XYZ has a moderate level of leverage, with debt financing accounting for a significant portion of its capital structure.b. Interest Coverage RatioThe interest coverage ratio of 5.0 indicates that Company XYZ has sufficient earnings to cover its interest expenses, reflecting a strong financial position.3.4 Efficiency Ratiosa. Inventory Turnover RatioThe inventory turnover ratio of 5.2 suggests that Company XYZ is efficiently managing its inventory, with a high level of inventory turnover.b. Receivables Turnover RatioThe receivables turnover ratio of 10.0 indicates that Company XYZ is collecting its accounts receivable quickly, reducing the risk of bad debt.ConclusionBased on the analysis of Company XYZ's financial report, it is evident that the company has demonstrated strong financial performance and stability. The company's profitability, liquidity, solvency, and efficiency ratios indicate a healthy financial position, supported by consistent revenue growth, effective cost management, and efficient use of assets and liabilities. As such, Company XYZ appears to be a solid investment opportunity for potential investors and creditors.。
财务报表英文翻译大全解析
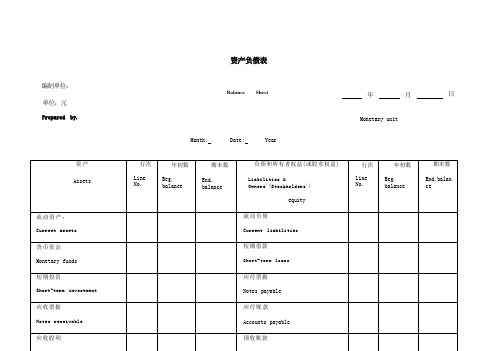
资产负债表编制单位:单位:元Prepared by.Balance SheetMonth: Date: Year年月Monetary unit日利润表Income Statement编制单位:年日单位:元Prepared by: Date Year Monetary unit: RMB Yuan现金流量表Cash Flow Statement编制单位:Prepared by:年度Period: 单位:元Monetary unit:RMB Yuan资产减值准备明细表Statement of Provision for Impairment of Assets编制单位:年度单位:元Prepared by: Period: Monetary unit: RMB Yuan注:根据财会[2003]10号文件规定,此表已变动,请参见第404-407页。
Note: This statement has been revised according to CaiKuai [2003] No. 10 by the Ministry of Finance. Please refer to page 404 to 407 for details.所有者权益(或股东权益)增减变动表Statement of Changes in Owner's(Stockholder's)Equity编制单位:年度单位:元Prepared by: Period: Monetary unit: RMB Yuan应交增值税明细表VAT Payable Movement Table编制单位:年度单位:元Prepared by: Period: Monetary unit: RMB Yuan利润分配表Statement of Profit Distribution编制单位:年度单位:元Prepared by Period: Monetary unit: RMB Yuan分部报表(业务分部)Business Segment Statement 编制单位:Prepared by.年度Period:单位:元Monetary unit: RMB Yuan分部报表(地区分部)Geographical Segment Statement 编制单位:Prepared by. 年度单位:元Monetary unit: RMB Yuan不可预见费contingencies信用证死卷dead LCCover pool 担保池Pfandbrief 抵押债券提货担保 shipping guarantee押品小类collateral subdivision准贷证 approved loan letter平息flat rateCAC Contributory asset charge: 资产必要报酬CAPM Capital Asset Pricing Model: 资本资产定价模型CU Currency unit: 货币单位DCF Discounted cash flow: 折现现金流EBIT Earnings before interest and tax: 息税前利润EBITDA Earnings before interest, tax, depreciation and amortization: 息税、折旧、摊销前利润GN Guidance Note: 评估指南IFRS International Financial Reporting Standard: 国际财务报告准则IPR&D In-process Research and Development: 研发投入IVS International Valuation Standard: 国际评估准则PFI Prospective financial information: 预期财务信息US GAAP US Generally Accepted Accounting Principles: 美国公认会计准则WACC Wcighted average cost of capital: 加权平均资本成本WARA Weighted average rcturn on asscts: 加权平均资产回报Compound Annual Growth Rate 年均复合增长率Cost of Goods Sold 已售商品成本Incremental-Cashflow 增量现金流量Multi-Period-Excess-Earnings 多期超额收益法Relief-from-Royalty权利金节省法Net operating profit less adjusted tax税后净营业利润。
财务管理英语报表分析
财务管理英语报表分析在当今全球化的商业环境中,英语报表已成为企业财务管理中不可或缺的一部分。
无论是跨国公司还是有国际业务往来的企业,都需要准确理解和分析英语报表,以做出明智的财务决策。
英语报表通常包括资产负债表(Balance Sheet)、利润表(Income Statement)和现金流量表(Cash Flow Statement)。
资产负债表反映了企业在特定日期的财务状况,展示了企业的资产、负债和所有者权益。
利润表则呈现了企业在一定期间内的经营成果,包括收入、成本和利润。
现金流量表则重点关注企业现金的流入和流出情况,反映企业的资金流动性。
在分析资产负债表时,我们首先要关注资产的构成和质量。
流动资产如现金、应收账款和存货的比例和变化趋势,可以反映企业的短期偿债能力和运营效率。
固定资产的规模和折旧情况则影响企业的长期生产能力和成本结构。
负债方面,短期负债和长期负债的比例以及偿债压力是关键。
所有者权益的变动能体现企业的资本积累和股权结构变化。
利润表的分析侧重于收入的增长和稳定性,以及成本控制的效果。
销售收入的增长是否与市场趋势相符?成本的增加是由于原材料价格上涨还是生产效率低下?毛利率和净利率的变化反映了企业在行业中的竞争力和盈利能力。
现金流量表是企业的“血液”流动记录。
经营活动现金流量的正负和大小,直接关系到企业的日常运营能否顺畅。
投资活动现金流量反映了企业的扩张或收缩战略。
筹资活动现金流量则显示了企业的融资策略和资金来源。
然而,仅仅理解这些报表的基本内容是不够的,还需要掌握一些关键的财务比率分析。
例如,流动比率(Current Ratio)和速动比率(Quick Ratio)用于评估企业的短期偿债能力。
资产负债率(Debt Ratio)反映了企业的长期偿债风险。
毛利率(Gross Margin)和净利率(Net Margin)衡量盈利能力。
资产回报率(Return on Assets,ROA)和股东权益回报率(Return on Equity,ROE)则综合评估了企业的资产利用效率和为股东创造价值的能力。
财务报表分析英文版
A. Measuring Business Incomea. explain why financial statements are prepared at the end of the regular accounting period.Major Financial Statements:The balance sheet: provides a "snapshot" of the firm's financial condition.The income statement: reports on the "performance" of the firm.The statement of cash flows: reports the cash receipts and cash outflows classified according to operating, investment and financing activities.The statement of stockholder's equity: reports the amounts and sources of changes in equity from transactions with owners.The footnotes of the financial statements: allow uses to improve assessment of the amount, timing and uncertainty of the estimates reported in the financial statements.The most accurate way to measure the results of enterprise activity would be to measure them at the time of the enterprise's eventual liquidation. Business, government, investors, and various other user groups, however, cannot wait indefinitely for such information. If accountants did not provide financial information periodically, someone else would.The periodicity or time period assumption simply implies that the economic activities of an enterprise can be divided into artificial time periods. These time periods vary, but the most common are monthly, quarterly, and yearly.The information must be reliable and relevant. This requires that information must be consistent and comparable over time and also be provided on a timely basis. The shorter the time period, the more difficult it becomes to determine the proper net income for the period.A month's results are usually less reliable than a quarter's results, and a quarter's results are likely to be less reliable than a year's results. Investors desire and demand that information be quickly processed and disseminated; yet the quicker the information is released, the more it is subject to error. This phenomenon provides an interesting example of the trade-off between relevance and reliability in preparing financial data.In practice, financial reporting is done at the end of the accounting period. Accounting periods can be any length in time.Firms typically use the year as the primary accounting period. The 12-month accounting period is referred to as the fiscal year.Firms also report for periods less than a year . quarterly) on an interim basis.Accounting period must be of equal length. Financial statements are prepared at the end of the regular accounting period to allow comparison across time.User CommentsPosted by Jeanette @ 2003-10-25 14:15:45.same period --- allow comparisionbasic assumption in preparing financial statements is ---- the firm will continue in operation,--- going concern,'assigning revenue - expenses ---- base on matching principlePosted by GiGi @ 2004-01-29 06:25:01.remember that there are 4 types of financial statementsb. explain why the accounts must be adjusted at the end of each period. WhyMost external transactions are recorded when they occur. The employment of an accrual system means that numerous adjustments are necessary before financial statements are prepared because certain accounts are not accurately stated.Some external transactions might not even seem like transactions and are recognized only at the end of the accounting period.Examples include unrecorded revenues and credit purchase.Some economic activities do not occur as the result of external transactions. Examples include depreciation and the expiration of prepaid expenses.Timing: Often a transaction affects the revenue or expenses of two or more accounting periods. The related cash inflow or outflow does not always coincide with the period in which these revenue or expense items are recorded. Thus, the need for adjusting entries results from timing differences between the receipt or disbursement of cash and the recording of revenue or expenses. For example, if we handle transactions on a cash basis, only cash transactions during the year are recorded. Consequently, if a company's employees are paid every two weeks and the end of an accounting period occurs in the middle of these two weeks, neither liability nor expense has been recorded for the last week. To bring the accounts up to date for the preparation of financialstatements, both the wage expense and the wage liability accounts need to be increased.A necessary step in the accounting process, then, is the adjustment of all accounts to an accrual basis and their subsequent posting to the general ledger. Adjusting entries are therefore necessary to achieve a proper matching of revenues and expenses in the determination of net income for the current period and to achieve an accurate statement of the assets and equities existing at the end of the period.Adjustment principlesThe revenue recognition principleThe matching principleWhat to adjustEach adjusting entry affects both a real account (assets, liability, or owner's equity) and a nominal or income statement account (revenue or expense). The four basic types of adjusting entries are:1.deferred expenses that benefits more than one period: for example,prepaid expenses . prepaid insurance, rent) are expenses paid in advance and recorded as assets before they are used or consumed.When these assets are consumed, expenses should be recognized: a debit to an expense account and a credit to an asset account.Another example is depreciation. The cost of a long-term asset is allocated as an expense over its useful life. At the end of each period depreciation expense is recorded through an adjusting entry:a debit to a depreciation expense account and a credit to anaccumulated depreciation account (a contra account used to total the past depreciation expenses on specific long-term assets).2.accrued expenses that incurred but not yet paid or recorded:examples are employee salaries and interest on borrowed money. At the end of the accounting period, the accrued expense is recorded through an adjusting entry: a debit to an expense account .Salaries Expense) and a credit to a liability account . Salaries Payable).3.accrued revenues that earned but not yet received or recorded:also called unrecorded revenues. Examples include interest revenues, rent revenues, etc. Such revenues accumulate with the passing of time, but the firm may have not received the payment or billed the client. An adjusting entry should be: a debit to an asset account . Accounts Receivable) and a credit to a revenue account . Interest Revenue).4.unearned revenues that are revenues received in cash beforedelivery of goods/services: examples are magazine subscription fees, customer deposits for services. These "revenues" are not earned yet and thus should be recorded as liabilities. An adjusting entry should be: a debit to a liability account .Unearned Revenue) and a credit to a revenue account . Revenue).User CommentsPosted by GiGi @ 2004-01-29 06:26:22.accrual system!!! definitionPosted by Gina @ 2004-02-03 22:17:33.accrual based accounting recognizes the impact of a business event as it occurs, regardless of whether transaction affected cashPosted by Gina @ 2004-02-03 22:20:20.Revenue Principle: basis for recording revenues (ie tells when to record revenue and the amounts).Matching Principle: basis for recording expensis (ie direction to ID all expenses during the period, measure them, and match them against the revenues earned in that period).c. explain why the accrual basis of accounting produces more useful income statements and balance sheets than the cash basis.Revenue is something earned through the sale of goods or services. Not all cash receipts are revenues; for example, cash received through a loan is not revenue. Expenses are the cost of goods or services used to generate revenues. Not all cash payments are expenses; for example, cash dividends paid to stockholders are not expenses. Net income is the difference between revenues and expenses. It is reported on the income statement, and is the focus in evaluating a firm's profitability.Most companies use the accrual basis accounting, recognizing revenue when it is earned (the goods are sold or the services performed) and recognizing expenses in the period incurred, without regard to the time of receipt or payment of cash. Net income is revenue earned minus expenses incurred.Under the strict cash basis accounting, revenue is recorded only when the cash is received and expenses are recorded only when the cash is paid. Net income is cash revenue minus cash expenses. The matching principle is ignored here, resulting inconformity with generally accepted accounting principles.Today's economy is considerably more lubricated by credit than by cash. And the accrual basis, not the cash basis, recognizes all aspects of the credit phenomenon. Investors, creditors, and other decision makers seek timely information about an enterprise's future cash flows. Accrual basis accounting provides this information by reporting the cash inflows and outflows associated with earnings activities as soon as these cash flows can be estimated with an acceptable degree of certainty. Receivables and payables are forecasters of future cash inflows and outflows. In other words, accrual basis accounting aids in predicting future cash flows by reporting transactions and other events with cash consequences at the time the transactions and events occur, rather than when the cash is received and paid. Accrual accounting generally provides a better indication of performance than cash basis of accounting since it increases the comparability of income statements and balance sheets across periods.B. Financial Reporting and Analysisa. define each asset and liability category on the balance sheet and prepare a classified balance sheet.Think of the balance sheet as a photo of the business at a specific point in time. It presents the assets, liabilities, and the equity ownership of a business entity as of a specific date.Assets are the economic resources controlled by the firm.Liabilities are the financial obligations that the firm must fulfill in the future. Liabilities are typically fulfilled by payment of cash. They represent the source of financing provided to the firm by the creditors.Equity Ownership is the owner's investments and the total earnings retained from the commencement of the firm. Equity represents the source of financing provided to the firm by the owners.Balance sheet accounts are classified so that similar items are grouped together to arrive at significant subtotals. Furthermore, the material is arranged so that important relationships are shown.The table below indicates the general format of balance sheet presentation:Balance Sheet ClassificationsAssets Liabilities and Owner's EquityCurrent Assets Current liabilitiesLong-term investments Long-term debtProperty, plan and equipment Owner's equityIntangible assets Capital stockOther assets Additional paid-in capitalRetained earningsCurrent Assets:They are cash and other assets expected to be converted into cash, sold, or consumed either in one year or in the operating cycle, whichever is longer. The operating cycle is the average time between the acquisition of materials and supplies and the realization of cash through sales of the product for which the materials and supplies were acquired. The cycle operates from cash through inventory, production, and receivables back to cash. Where there are several operating cycles within one year, the one-year period is used. If the operating cycle is more than one year, the longer period is used.Current assets are presented in the balance sheet in order of liquidity. The five major items found in the current asset section are:Cash:valued at its stated value. Cash restricted for purpose other than payment of current obligations or for use in current operations should be excluded from the current asset section.Marketable securities: Also referred to as marketable securities.Valued at cost or lower of cost and market.Accounts receivables:amounts owed to the firm by its customers for goods and services delivered. Valued at the estimated amount collectible.Inventories:Products that will be sold in the normal course of business.Prepaid expenses: they are expenditures already made for benefits (usually services) to be received within one year or the operating cycle, whichever is longer. Typical examples are prepaid rent, advertising, taxes, insurance policy, and office or operating supplies. They are reported at the amount of un-expired or unconsumed cost.Long-Term Investments:Often referred to simply as investments, they are to be held for many years, and are not acquired with the intention of disposing of them in the near future.Investments in securities such as bonds, common stock, or long-term notes that management does not intend to sell within one year.Investments in tangible fixed assets not currently used in operations, such as land held for speculation.Investments set aside in special funds such as a sinking fund, pension fund, or plant expansion fund. The cash surrender value of life insurance is included here.Investments in non-consolidated subsidiaries or affiliated companies.Property, Plant, and Equipment:They are properties of a durable nature used in the regular operations of the business. With the exception of land, most assets are either depreciable (such as building) or consumable.Intangible Assets:They lack physical substance and usually have a high degree of uncertainty concerning their future benefits. They include patents, copyrights, franchises, goodwill, trademarks, trade names, secretprocesses, and organization costs. Generally, all of these intangibles are written off (amortized) to expense over 5 to 40 years.Other Assets:They vary widely in practice. Examples include deferred charges (long-term prepaid expenses), non-current receivables, intangible assets, assets in special funds, and advances to subsidiaries.Current Liabilities:They are obligations that are reasonably expected to be liquidated either through the use of current assets or the creation of other current liabilities within one year or within the operating cycle, whichever is longer. They are not reported in any consistent order. A typical order is: Notes payable, accounts payable, accrued items . accrued warranty costs, compensation and benefits) income taxes payable, current maturities of long-term debt, etc.The excess of total current assets over total current liabilities is referred to as working capital. It represents the net amount of a company's relatively liquid resources; that is, it is the liquid buffer, or margin of safety, available to meet the financial demands of the operating cycle.Long-Term LiabilitiesThey are obligations that are not reasonably expected to be liquidated within the normal operating cycle but, instead, at some date beyond that time. Bonds payable, notes payable, deferred income taxes, lease obligations, and pension obligations are the most common long-term liabilities. Generally they are of three types:Obligations arising from specific financing situations, such as issuance of bonds, long-term lease obligations, and long-term notes payable.Obligations arising from the ordinary operations of the enterprise such as pension obligations and deferred income tax liabilities.Obligations that are dependent upon the occurrence or non-occurrence of one or more future events to confirm the amount payable, or the payee, or the date payable, such as service or product warranties and other contingencies.Owner's Equity:The complexity of capital stock agreements and the various restrictions on residual equity imposed by state corporation laws, liability agreements, and boards of directors make the owner's equity section one of the most difficult sections to prepare and understand. The section is usually divided into three parts:Capital stock: the par or stated value of the shares issued.Additional paid-in capital: the excess of amounts paid in over the par or stated value.Retained earnings: the corporation's undistributed earnings.b. define each component of a multi-step income statement and prepare a multi-step income statement.The income statement measures the success of business operations for a given period of time. A single-step income statement groups revenues together and expenses together, without further classifying each of the groups. A multi-step income statement makes further classifications to provide additional important revenue and expense data. Theseclassifications make the income statement more informative and useful. It is recommended because:it recognizes a separation of operating transactions from non-operating transactions;it matches costs and expenses with related revenues;it highlights certain intermediate components of income that are used for the computation of ratios used to assess the performance of the enterprise.Components:Operating section: a report of the revenues and expenses of the company's principal operations.o Sales or revenue section: a subsection presenting sales, discounts, allowances, returns, and other relatedinformation, and to arrive at the net amount of salesrevenue.o Cost of goods sold section: a subsection that shows the cost of goods that were sold to product the sales.o Selling expense: a subsection that lists expenses resulting from the company's efforts to make sales.o Administrative or general expenses: a subsection reporting expenses of general administration.Non-operating section: a report of revenues and expenses resulting from secondary or auxiliary activities of the company.In addition, special gains and losses that are infrequent or unusual, but not both, are normally reported in this section.Generally these items break down into two main subsections:o Other revenues and gains: A list of the revenues earned or gains incurred, generally net of related expenses, from non-operating transactions.o Other expenses and losses: A list of the expenses or losses incurred, generally net of any related incomes, from non-operating transactions.Income taxes: A short section reporting federal and state taxes levied on income from continuing operations.Discontinued operations: material gains or losses resulting from the disposition of a segment of the business.Extraordinary items: Unusual AND infrequent material gains and losses.Cumulative effect of a change in accounting principle.Earnings per share.C. Short-Term Liquid Assetsa. describe how to choose the appropriate accounting method for investment securities and explain how fair (market) value gains and losses on such investments are reported.Short-term investments, also called marketable securities,ordinarily consist of short-term paper (certificates of deposit, treasury bills, and commercial paper), marketable debt securities (government and corporate bonds), and marketable equity securities (preferred and common stock) acquired with cash not immediately needed in operations.They must be:readily marketable: can be sold quite easily.intended to be converted into cash as needed within one year or the operating cycle, whichever is longer.Securities that are intended to be held for more than one year are called long-term investments.There are two types of gains and losses:Realized gains and losses: the difference between the fair market value and the cost of the securities when they are sold.Unrealized holding gains and losses:the difference between the fair market value and the cost of the securities when they are still held by the firm. The gains and losses are unrealized because securities have not been sold.In general:When securities are purchased, they are recorded at cost. The cost of the securities includes purchase price and any broker's fees or fees paid to acquire securities.Interest and dividends generally are recognized as revenue when they are received.When securities are sold, the cost is compared to the sales price, and the difference is recorded as a gain or a loss.At the end of each accounting period, the balance of the controlling account is adjusted to reflect the current market value of the securities owned.However, different categories of investment securities have different treatment on unrealized holding gains and losses.Held-to-maturity securities:Debt securities that management intends to hold to their maturity date. At year end, they are reported at cost adjusted for the effect of interest (debit the securities account and credit interest income account), and unrealized holding gains and losses are not recognized.Trading securities: Debt and equity securities bought and held mainly for sale in the near term to generate income on price changes. At year end, they are reported at their fair market value.Any unrealized holding gains or losses are recognized on the firm's income statement as part of the net income. When they are sold, the realized gains or losses will also appear on the income statement. Realized gains and losses are not affected by any unrealized gains or losses recognized before.Example:1.12/1/2002, 100 shares purchased at $80 per share for tradingpurposes:Entry: Trading Securities 8000(Debit) | Cash 8000 (Credit)2.12/31/2002, the price is $60 per share.Entry: Unrealized Loss on Investments 2000 (Debit) | Allowance to Adjust Short-Term Investments to Market 2000 (Credit).The allowance account is shown on the balance sheet as a contra-asset account:Trading Securities (at cost) 8000Allowance Account (2000)Trading Securities (at market) 6000The $2000 unrealized loss is reported in the income statement for 2002.3.06/12/2003, 100 shares sold at $120 per share.Entry: Cash 12000 (Debit) | Trading Securities 8000 (Credit) | Realized Gain on Investment 4000 (Credit)The $4000 realized gain is reported in the income statement of 2003.Available-for-sale securities:Debt and equity securities not classified as held-to-maturity or trading securities. The unrealized gains and losses are reported in the balance sheet as an adjustment to the shareholders' equity (in contrast, the unrealized gains or losses of trading securities are reported in the income statement as part of the net income). Other than that, they are accounted for in the same way as trading securities. Example:1.12/1/2002, 100 shares purchased at $80 per share for tradingpurposes:Entry: Available-for-Sale Securities 8000(Debit) | Cash 8000 (Credit)2.12/31/2002, the price is $60 per share.Entry: Unrealized Loss on Investments 2000 - Equity (Debit) | Allowance to Adjust Short-Term Investments to Market 2000 (Credit).The allowance account is shown on the balance sheet as a contra-asset account:Available-for-Sale Securities (at cost) 8000Allowance Account (2000)Available-for-Sale Securities (at market) 6000The $2000 unrealized loss is reported in the balance sheet for 2002 as a component of stockholder's equity.3.06/12/2003, 100 shares sold at $120 per share.Entry: Cash 12000 (Debit) | Trading Securities 8000 (Credit) | Realized Gain on Investment 4000 (Credit)The $4000 realized gain is reported in the income statement of 2003.User CommentsPosted by shasha @ 2003-11-15 04:02:09.AFS (available-for-sale) is kind of short-term investment, however, its market value change should be adjusted to the equity as well.Posted by Gina @ 2004-02-12 01:51:11.AFS can be short or long-term. Since they are reported on the balance sheet at market value, this reporting needs to be adjusted from their last carrying amount to current market value.The unrealized gain or loss is reported in 2 places:(1) Income statement - under 'Other comprehensive income' (net of tax) [but not as part of net income];(2) OE - income - unrealized gain on investments (net of tax).。
财务报表分析-英文

Introduction and Basic Concepts
Business Partnership Vision Strategy Budget Forecast
Others Treasury M&A Risk Management Insurance Auditing Compliance Hedging ….
Introduction and Basic Concepts
Minimize Working Capital Maintain Strong Cash Flow
Pay Debts As They Are Due Increase Liquidity
Maintain Strong Financial Position
Introduction and Basic Concepts
导言及基本概念 Introduction and Basic Concepts Introduction Finance Organization Finance Activity Other topics
This training will allow you to understand: Finance Function Concept of Financial KPIs (Revenue, DM, DL, VOH, FOH, SG&A, OI, OCF, EBITDA, DOH, DSO, DPO, Incremental, etc.) BS, P&L and Cash Flow Statements Concepts of Financial Statement Evaluation and Investment Appraisal
英文财务报告分析范文(3篇)
第1篇Executive Summary:This analysis aims to provide a comprehensive overview of XYZ Corporation's financial performance for the year 2022. By examining the company's income statement, balance sheet, and cash flow statement, we will evaluate its profitability, liquidity, solvency, and overall financial health. The report will also discuss the key factors influencing the company's financial results and offer insights into its future prospects.1. Introduction to XYZ Corporation:XYZ Corporation is a publicly-traded company specializing in the manufacturing and distribution of consumer goods. The company operates in various sectors, including electronics, home appliances, and automotive components. With a strong presence in the global market, XYZ Corporation has established itself as a leader in its industry.2. Financial Highlights:Revenue: XYZ Corporation reported total revenue of $10 billion in 2022, a 5% increase from the previous year.Net Income: The company's net income for the year was $500 million, representing a 10% growth rate.Earnings Per Share (EPS): EPS increased by 8% to $2.50.Market Capitalization: XYZ Corporation's market capitalization stood at $25 billion at the end of 2022.3. Income Statement Analysis:3.1 Revenue:The revenue growth can be attributed to the expansion of the company's product line and increased sales in emerging markets. Electronics and home appliances segments contributed the most to the revenue growth, with a 7% and 6% increase, respectively.3.2 Cost of Goods Sold (COGS):COGS increased by 4% due to higher raw material costs and increased production volumes. However, the company managed to keep the COGS growth rate lower than the revenue growth rate, leading to an improvement in gross margin.3.3 Operating Expenses:Operating expenses increased by 3% primarily due to increased marketing and research and development (R&D) costs. Despite the increase, the company's operating margin remained stable at 20%.3.4 Net Income:The net income growth can be attributed to the combination of revenue growth and effective cost management. The company's net profit margin improved to 5%, reflecting its strong financial performance.4. Balance Sheet Analysis:4.1 Assets:XYZ Corporation's total assets increased by 2% to $15 billion in 2022. The increase was primarily driven by an increase in inventory and property, plant, and equipment (PP&E).4.2 Liabilities:Total liabilities decreased by 1% to $10 billion. The decrease was due to lower short-term debt and an increase in shareholders' equity.4.3 Shareholders' Equity:Shareholders' equity increased by 3% to $5 billion. The increase was primarily due to the company's retained earnings.5. Cash Flow Statement Analysis:5.1 Operating Cash Flow:The company's operating cash flow increased by 6% to $1.2 billion. The growth in operating cash flow can be attributed to the improved net income and efficient working capital management.5.2 Investing Cash Flow:Investing cash flow decreased by 2% to $500 million. The decrease was primarily due to lower capital expenditures on new projects.5.3 Financing Cash Flow:Financing cash flow decreased by 4% to $300 million. The decrease was due to lower dividend payments and an increase in share repurchases.6. Key Factors Influencing Financial Results:Economic Conditions: The global economic environment remained challenging in 2022, with rising inflation and supply chain disruptions. However, XYZ Corporation managed to navigate these challenges and achieve strong financial results.Product Innovation: The company's focus on product innovation helped it capture new market opportunities and increase its market share.Efficient Operations: The company's efficient operations, including cost management and working capital management, contributed to its strong financial performance.7. Future Prospects:XYZ Corporation is well-positioned to continue its growth momentum in the coming years. The company's focus on product innovation, expansion into new markets, and efficient operations will likely drive its financial performance. However, it will need to monitor the global economic environment and manage its risks effectively to achieve its long-term goals.8. Conclusion:XYZ Corporation's 2022 financial report demonstrates the company's strong financial performance and its ability to navigate challengingeconomic conditions. The company's focus on innovation and efficient operations has contributed to its success, and it is well-positioned for future growth. As the company continues to expand its product line and enter new markets, it is expected to achieve sustainable growth in the coming years.Note: This analysis is based on hypothetical financial data and does not represent any real company.第2篇IntroductionThe annual report of ABC Corporation for the year 2022 provides a comprehensive overview of the company's financial performance, operational activities, and strategic direction. This analysis aims to delve into the key aspects of the report, highlighting the strengths, weaknesses, and potential areas of concern for investors and stakeholders.Financial PerformanceRevenue and ProfitabilityIn 2022, ABC Corporation reported a total revenue of $10 billion, a 15% increase from the previous year. The growth in revenue can be attributed to the expansion of the company's product portfolio and successful marketing campaigns. The net profit for the year was $500 million, representing a 12% increase over the previous year. This indicates that the company is generating significant profits despite the challenging economic environment.Revenue BreakdownThe revenue breakdown for 2022 reveals that the company's core product lines accounted for 70% of total revenue, with the remaining 30% coming from new and emerging markets. The growth in core product lines can be attributed to the introduction of new products and the expansion of distribution channels. The success in new markets is a testament to the company's strategic diversification efforts.Earnings Per Share (EPS)The EPS for 2022 was $2.50, which is in line with market expectations. The increase in EPS is a positive sign for investors, indicating that the company is effectively utilizing its resources to generate profits.Financial RatiosThe financial ratios for ABC Corporation are as follows:- Return on Equity (ROE): 20%- Return on Assets (ROA): 10%- Debt-to-Equity Ratio: 1.5- Current Ratio: 2.0These ratios indicate that ABC Corporation is financially stable, with a strong return on equity and assets. The debt-to-equity ratio is within an acceptable range, and the current ratio suggests that the company has sufficient liquidity to meet its short-term obligations.Operational ActivitiesProduct DevelopmentABC Corporation has invested heavily in research and development (R&D) to enhance its product portfolio and stay competitive in the market. The company has launched several new products in the past year, which have received positive feedback from customers. The continued focus on innovation is expected to drive future growth.Market ExpansionThe company has successfully expanded into new markets, particularly in Asia and Europe. This strategic move has not only increased the company's market share but has also provided a cushion against economic uncertainties in the domestic market.Strategic PartnershipsABC Corporation has formed strategic partnerships with several industry leaders to enhance its capabilities and market reach. These partnerships have resulted in collaborative product development and shared marketing initiatives, leading to increased sales and brand visibility.Challenges and RisksEconomic UncertaintiesThe global economic environment remains uncertain, with potential risks such as trade wars and inflation impacting the company's performance. ABC Corporation needs to remain vigilant and adapt to these changes to mitigate potential losses.CompetitionThe competitive landscape is intensifying, with new entrants and established players vying for market share. ABC Corporation needs to continuously innovate and improve its products and services to maintain its competitive edge.Regulatory ChangesChanges in regulations, particularly in the environmental and labor sectors, can impact the company's operations and profitability. ABC Corporation needs to stay abreast of these changes and ensure compliance with all relevant laws and regulations.ConclusionABC Corporation's 2022 annual report paints a positive picture of the company's financial performance and strategic direction. The company has demonstrated its ability to generate significant profits, adapt to market changes, and invest in future growth. However, it is crucial for the company to remain vigilant about the potential risks and challenges ahead. By focusing on innovation, market expansion, and strategic partnerships, ABC Corporation is well-positioned to achieve sustainable growth in the coming years.Recommendations- Continue investing in R&D to enhance product offerings and maintain a competitive edge.- Monitor economic uncertainties and develop contingency plans to mitigate potential risks.- Strengthen strategic partnerships to expand market reach and share.- Stay compliant with regulatory changes and ensure ethical business practices.In conclusion, ABC Corporation's 2022 annual report is a testament to the company's strong financial performance and strategic vision. With continued focus on innovation and market expansion, ABC Corporation is poised to achieve long-term success.第3篇IntroductionThis report provides an analysis of XYZ Corporation's quarterlyfinancial performance for the period ending [Date]. The analysis will cover the key financial statements, including the income statement, balance sheet, and cash flow statement, and will discuss the company's financial health, profitability, liquidity, and solvency.Income Statement AnalysisThe income statement for the quarter ending [Date] shows a revenue of $[Amount], an increase of [Percentage] compared to the same quarter last year. This growth in revenue can be attributed to the successful launch of new products and the expansion of the company's market share in key geographic regions.Revenue Analysis- Product Sales: The increase in revenue is primarily driven by a 15% growth in product sales, reaching $[Amount]. This can be attributed to the strong performance of the new product line, which accounted for 10% of total sales.- Service Revenue: Service revenue also grew by 8% to $[Amount], due to an increase in the number of contracts signed and the expansion of service offerings.Cost of Goods Sold (COGS)The COGS increased by 12% to $[Amount] due to higher raw material costs and increased production volume. Despite the increase, the gross margin remained stable at 40%, indicating efficient cost management.Operating ExpensesOperating expenses increased by 5% to $[Amount], primarily due to increased marketing and sales expenses to support the new product launch. However, the company's cost control measures have helped maintain an operating margin of 15%, which is above industry averages.Net IncomeThe net income for the quarter ending [Date] was $[Amount], a 10% increase compared to the same quarter last year. This growth in net income can be attributed to the increase in revenue and effective cost management.Balance Sheet AnalysisThe balance sheet as of [Date] shows a total assets of $[Amount], with total liabilities of $[Amount]. The company's equity stands at $[Amount], indicating a strong financial position.Liquidity AnalysisThe current ratio as of [Date] is 2.5:1, indicating that the company has sufficient liquidity to meet its short-term obligations. The quick ratio is 1.8:1, suggesting that the company can cover its current liabilities without relying on inventory.Solvency AnalysisThe debt-to-equity ratio is 0.8:1, indicating that the company's leverage is moderate. The interest coverage ratio is 4.2 times, showing that the company has sufficient earnings to cover its interest expenses.Cash Flow Statement AnalysisThe cash flow statement for the quarter ending [Date] shows a net cash inflow of $[Amount]. The operating activities generated $[Amount], while the investing activities used $[Amount] for capital expenditures. The financing activities showed a net inflow of $[Amount] due to new equity issuance.ConclusionXYZ Corporation has demonstrated strong financial performance for the quarter ending [Date]. The increase in revenue, stable gross margin, and effective cost management have contributed to the company'sprofitability. The strong liquidity and moderate leverage positions the company well for future growth. However, the company should continue to monitor its expenses and manage its working capital to ensure sustainable growth.Recommendations- Continue to invest in research and development to maintain a competitive edge.- Explore new markets and expand the company's customer base.- Implement cost-saving initiatives to enhance profitability.- Maintain a strong liquidity position to support future growth.Appendix- Detailed financial statements for the quarter ending [Date]- Industry benchmarks for financial ratios- Key performance indicators (KPIs)This report provides a comprehensive analysis of XYZ Corporation's financial performance. It is recommended that stakeholders use this report as a basis for making informed decisions regarding their investment in the company.。
- 1、下载文档前请自行甄别文档内容的完整性,平台不提供额外的编辑、内容补充、找答案等附加服务。
- 2、"仅部分预览"的文档,不可在线预览部分如存在完整性等问题,可反馈申请退款(可完整预览的文档不适用该条件!)。
- 3、如文档侵犯您的权益,请联系客服反馈,我们会尽快为您处理(人工客服工作时间:9:00-18:30)。
2015年9月
解决三个目标问题
英文报表的直观差异是什么?
报表项目是什么意思? 如何看懂英文报表?
英文报表的直观差异是什么? 财务报表的组成 会计期间
会计年度结束时间各有不同,但原则上是满一年的结账日。
以美国公司报表为准
资产负债表、利润表、股东权益表及பைடு நூலகம்金流量表和综合收益表
BALANCE SHEETS(资产负债表)
英文报表主要项目 Assets Current assets Cash and cash equivalents Available-for-sale securities-at fair value Short-term investment Accounts receivable Allowance for doubtful accounts Inventories Prepaid expenses Total current assets Long-term investment Plant assets, net of depreciation Intangible assets, net of amortization Goodwill Other assets Total assets 中文释义 资产 流动资产 现金和现金等价物 可供出售证券-公允价值 短期投资 应收账款 坏账准备 存货 预付费用 流动资产合计 长期投资 固定资产折旧后净值 无形资产摊销后净值 商誉 其他资产 资产总额
美国的财务会计准则委员会并没有对企业的会计年度起讫日期做出特
别规定,只是由政府部门公布了一个指导时间——10月制(10月1日至次 年9月30日为一个会计年度),实际上允许企业根据自己所在行业和经营
情况来灵活选择自己的会计年度。
比较性财务报表
INCOME STATEMENT(损益表)
英文报表主要项目 Net sales Cost of goods sold Gross profit Selling expenses Administrative expenses Income from operations Other revenues and gains Other expenses and losses Income before tax Income tax Net income for the year Earnings per share 中文释义 净销售收入【注】 销货成本 毛利 销售费用 管理费用 经营收益 其他收入和利得 其他费用和损失 税前收益 所得税 本年净收益 每股收益
【注】Net sales including sales, discounts, allowances, returns and other related information.
INCOME STATEMENT(损益表)
英文报表项目 Selling expenses Sales salaries and commissions Sales office salaries Travel and entertainment Advertising expense Freight and transportation-out Shipping supplies and expense Postage and stationery Telephone and Internet expense Depreciation of sales equipment 英文报表项目 Administrative expenses Officers' salaries Legal and professional services Utilities expense Insurance expense Depreciation of building Depreciation of office equipment Stationery, supplies and postage Miscellaneous office expenses 管理人员工资 法律和专业服务费 水电费 保险费 房屋折旧 办公设备折旧 办公用品、物料和邮费 其他办公费 中文释义 销售费用 销售人员工资和佣金 销售办工资 差旅费和招待费 广告费 运费 船运物料和费用 邮费和办公用品 通讯费 销售设备折旧费 中文释义 管理费用
BALANCE SHEETS(资产负债表)
英文报表主要项目 Liabilities and Shareowners„ Equity Current liabilities Notes payable Payable to suppliers and others Accrued interest on notes payable Accrued salaries, wages Accrued liabilities Dividend payable Accrued income taxes Deferred revenue Current maturities of long-term debt Other current liabilities Long-term debt Obligations under capital leases Other liabilities, mainly deferred income tax Shareowners„ equity Paid in on capital stock Preferred stock authorized 40sh.;none issued Capital stock,$0.15 par value;authorized14sh;issued 13sh Capital surplus Earnings retained in the business Cumulative translation adjustments 中文释义 负债和所有者权益 流动负债 应付票据 应付账款 应付票据利息 应付薪酬 应计负债 应付股利 应付所得税 递延收益 年内到期的长期负债 其他流动负债 长期负债 融资租赁义务 其他负债,递延所得税为主 所有者权益 实收资本 优先股,核准4000万股,发行0股 股本,面值$0.15,核准1400万股,发 行1300万股 资本公积 留存收益 外币折算调整累计数