APPARATUS FOR EVALUATING STABILITY OF CORRUGATED BOARD UNDER LOAD IN CYCLIC HUMIDITY ENVIRO
JASO M351-1998 汽车零部件——外饰件由氙气弧光灯加速自然干燥试验方法

Light
Light
Light
Dark
40
-
20
Spraying
60
-
60
-
I
Water spray on rear surface Humidity (%RH)
I
I
-
I
I -
50I5
I
95i5
I
I 50=5
I
I
Spraying
95I5
2
JAS0 M351:1998
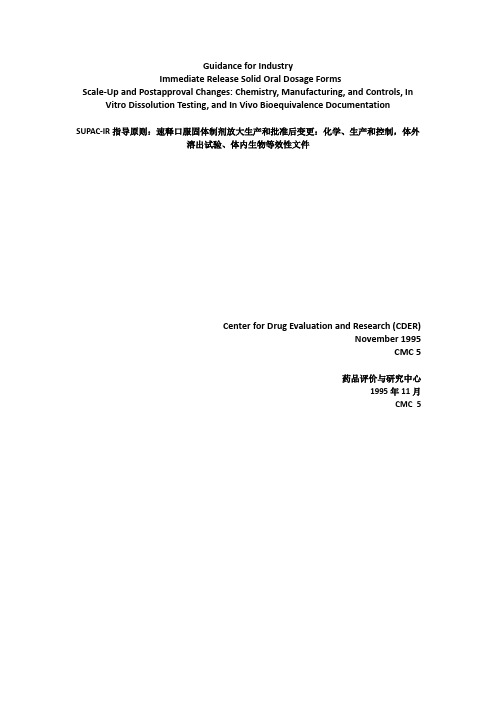
4.3 Test apparatus The apparatus shall comprise the test chamber, light emitter, xenon-arc starting and stabilizing device, irradiance adjuster, temperature controller, humidity controller, specimen holder, cooling unit, and instruments, and shall meet the following performance requirements. 4.3.1 Light Irradiation a) Configuration of light emitter In order to specified meet the test requirements 4.2, the light
4. Test Method 4.1 Items to be evaluated Evaluated items include; colour, gloss, and other. 4.2 Test conditions Test conditions such as temperature, humidity, and irradiance which affect the test results shall be as follows. a) Temperature Light periods: 6.P.T 6 3 I 3 " C or 8 3 I 3 " C Dark periods: 6.P .T 38-t2@C
ASTM D5374 1993评定实验室烘箱的标准方法
required to maintain the oven at a given temperature with its ports open and(2)the average power required to maintain the oven at the same temperature with its ports closed.The test is conducted at100°C and at the maximum temperature at which the oven may be used.6.1.2Seal all openings into the oven,including,but not necessarily limited to,the vent ports,door,thermometer ports, and the space around the blower shaft(if the blower motor is mounted externally).6.1.3Install a watt-hour meter,as described in5.5,in the oven electrical supply line.6.1.4Install a temperature sensor,such as a thermometer,2 m to3m away from the oven,at least1m away from any solid object,and approximately level with the oven air e the oven temperature indicator to measure the internal tem-perature of the oven.6.1.5Raise the oven temperature to10062°C.When the temperature of the oven has stabilized,measure the consump-tion of power over a measured period of30to40min.Begin and end the measuring period at corresponding points of the cyclic temperaturefluctuation;for example,the moment when the heaters are switched on by the thermostat in the case of an “on/off”control.Measure and record the room temperature, which must not vary by more than2°C during the test.6.1.6Remove the seals to restore the oven to its normal operating condition.If necessary,adjust the vents and dampers to positions estimated to provide the specified rate of ventila-tion.6.1.7Repeat6.1.5.The average ambient air temperature must be within2°C of the average ambient temperature measured in6.1.5.6.1.8Calculate the rate of ventilation in the oven using the following equation:N53.59~P22P1!/~V·r·D T!(1) where:N5number of air changes per hour,P15average power consumption,with no ventilation, obtained by dividing the energy consumption deter-mined from the watt-hour meter readings by theduration of the test in hours,W,P25average power consumption during ventilation,cal-culated in the same manner,W,V5total volume of air circulated within the oven,m3(see Note1),r5density of the ambient room air during the test, kg/m3(see Note2),andD T5difference in temperature between the oven and theambient room temperature,°C.N OTE1—This volume includes space outside the testing chamber.The amount of this additional space depends on the physical design of the oven.N OTE2—The density of air at one atmosphere and20°C is1.205kg/m3.6.1.9If the rate of ventilation is not within the specified limits for the oven,adjust the vents and dampers and repeat 6.1.7through6.1.8.6.1.10Repeat6.1.2through6.1.9,except heat the oven to the maximum temperature at which the oven may be used.6.1.11Report the following information:6.1.11.1Identification of the oven,6.1.11.2Date and location of test,6.1.11.3Test temperatures,and6.1.11.4Rate of ventilation at each temperature.6.2Temperature Variation,Gradient,and Fluctuation: 6.2.1Summary of Test Method—Simultaneous temperature measurements are made at nine points in the oven chamber over a period of time to determine the time and space variations of temperature.The time variation(temperaturefluctuation) and the space variation(temperature gradient)can be reported separately from temperature variation,which is the combina-tion of the two.6.2.2Set the vents and dampers in the oven to the settings needed for the specified range of rate of ventilation.6.2.3Install nine thermocouples in the oven chamber(see 5.1and5.2).Place one thermocouple in each of the eight corners of the chamber50to60mm from each wall,and the ninth thermocouple within25mm of the geometric center of the chamber.Leave at least300mm of wire for each thermo-couple within the oven chamber,in order to minimize effects of heat conduction along the wire.6.2.4Bring the oven to the selected operating temperature and allow it to stabilize for a minimum of16h.6.2.5Measure the temperatures indicated by the nine ther-mocouples to0.1°C a sufficient number of times during one complete temperature variation cycle to permit the determina-tion of the maximum,minimum,and mean temperatures of each thermocouple during one cycle.Ambient room tempera-ture must not vary by more than a total of10°C,and supply voltage to the oven must not vary by more than a total of5% during this measuring period.6.2.5.1Calculate the average of the nine mean temperatures to0.1°C and record as the set temperature of the oven.6.2.5.2Calculate the difference between the highest maxi-mum temperature and the lowest minimum temperature deter-mined in6.2.5and record as the temperature variation.6.2.5.3Calculate the difference between the highest tem-perature and the lowest temperature at any specific time during the temperature cycle,and record as the temperature gradient.6.2.5.4Determine which thermocouple has the greatest difference between maximum temperature and minimum tem-perature over the temperature cycle and record difference as the temperaturefluctuation.6.2.6Maintain the oven at the same operating temperature forfive days after the end of the stabilization period,and after the measurement of temperatures specified in6.2.5.Maintain ambient room temperature and supply voltage within the limits in6.2.5during the entire period.Repeat the measurements and calculations in6.2.5daily.6.2.7For routine monitoring of oven characteristics,for example,as recommended in Appendix X1of Specification D5423,the stabilization time specified in 6.2.4may be reduced to8h,and the length of the test period following the initial temperature measurements specified in6.2.6may be reduced to24h(one day),with a single repetition of the temperature measurements.In case of doubt or dispute,use the longer time periods.6.2.8Report the followinginformation:6.2.8.1Identification of the oven,6.2.8.2Date and location of test,6.2.8.3Calculated set temperature for each measurement,6.2.8.4Temperature variation for each measurement,and6.2.8.5If specified,temperature gradient and temperaturefluctuation for each measurement.6.3Thermal Lag Time :6.3.1Summary of Test Method —A defined brass bar speci-men is placed in the heated oven,and the difference between itstemperature and the oven air temperature is plotted againsttime.The thermal lag time is the time in seconds required forthe temperature difference to be reduced to 10%of themaximum observed temperature difference.6.3.2Heat the oven to 20065°C and allow it to stabilizefor at least 1h.Stabilize a brass bar specimen (5.4)at roomtemperature for at least 1h.6.3.3Without turning off the oven,open the door(s)of theoven 90°.Quickly hang the specimen in the geometric centerof the oven,using a heat-resistant nonmetallic cord.Theorientation of the axis of the specimen is not significant.Suspend the other junction of the thermocouple 80to 100mmfrom the brass bar.Leave the oven door(s)open for a total of6061s,then close the oven.Record the temperaturedifference,as indicated by the two junctions of the differentialthermocouple,at least once every 10s until the maximumtemperature difference has been obtained.Continue recordingat least once every 30s until the temperature difference has dropped below 10%of maximum.6.3.4Plot the recorded temperature values against the time in seconds since closing the oven.6.3.5Divide the maximum temperature difference by ten and record as T 10.Then record as the thermal lag time the time in seconds,taken from the plot of temperature difference versus time,for the temperature difference to reach T 10,after the time of maximum temperature difference.6.3.6Report the following information:6.3.6.1Identification of the oven,6.3.6.2Date and location of the test,6.3.6.3Set temperature of the oven,and 6.3.6.4The determined thermal lag time,in seconds.7.Precision and Bias 7.1The precision of the individual methods given herein has not been determined,and no activity is planned to determine the precision.7.2The bias of the individual methods is largely dependent upon the accuracy of temperature measurement attainable using the available apparatus.8.Keywords 8.1forced-convection;ovens;set temperature;temperature fluctuation;temperature gradient;thermal endurance evalua-tion;thermal lag time;ventilated;ventilation rateThe American Society for Testing and Materials takes no position respecting the validity of any patent rights asserted in connection with any item mentioned in this ers of this standard are expressly advised that determination of the validity of any such patent rights,and the risk of infringement of such rights,are entirely their own responsibility.This standard is subject to revision at any time by the responsible technical committee and must be reviewed every five years and if not revised,either reapproved or withdrawn.Your comments are invited either for revision of this standard or for additional standards and should be addressed to ASTM Headquarters.Your comments will receive careful consideration at a meeting of the responsible technical committee,which you may attend.If you feel that your comments have not received a fair hearing you should make your views known to the ASTM Committee on Standards,100Barr Harbor Drive,West Conshohocken,PA19428.。
航海英语部分词汇解释
Angle of loll负稳性初倾角,负稳性横倾角,失稳横倾角A ship having a very small negative initial metacentric height GM need not necessarily capsize. This situation produces an angle of loll. 初稳性高度为一个非常小的负值的船舶不一定倾覆。
这种情况产生负稳性横倾角。
As the angle of heel increases, the centre of buoyancy will move out still further to the low side. If the centre of buoyancy moves out to a position vertically under G, the capsizing moment will have disappeared. The angle of heel at which this occurs is called the angle of loll. It will be noticed that at the angle of loll, the GZ is zero. 随着横倾角增大,浮心将缓慢向外移,进一步移到较低的一舷。
如果浮心向外移至船舶重心的正下方某一位置,倾覆力矩将会已经消失。
这时的横倾角称为负稳性横倾角。
将会注意到在负稳性横倾角处静稳性力臂为0。
【美国原题】1. An upright vessel has negative GM. GM becomes positive at the angle of loll because the ______.A. free surface effects are reduced due to pocketingB. KG is reduced as the vessel seeks the angle of lollC. effective beam is increased causing BM to increase有效船宽增大导致BM增大[GM=KB+BM-KG,如果(KB-KG)不变而BM增大,从而导致GM增大并转为正值]。
详解烟点仪的使用流程
详解烟点仪的使用流程The smoke point test is an essential step in determining the quality and stability of different types of oil. 烟点测试是确定不同类型的油的质量和稳定性的重要步骤。
It is a process that involves heating the oil to a specific temperature and observing its reaction to the heat. 这是一个过程,涉及将油加热到特定的温度,并观察它对热的反应。
The smoke point tester, also known as a smoke point apparatus or smoke point reflectometer, is the device used to conduct this test. 烟点测试仪,也被称为烟点设备或烟点反射仪,是用来进行这项测试的设备。
The first step in using a smoke point tester is to ensure that it is properly calibrated. 使用烟点测试仪的第一步是确保它被正确校准。
Calibration is crucial in obtaining accurate and reliable test results. 校准对于获得准确可靠的测试结果至关重要。
This involves setting the correct temperature and ensuring that the device is functioning correctly. 这涉及设置正确的温度并确保设备正常运行。
Calibration should be done according to the manufacturer's instructions and guidelines. 校准应按照制造商的指示和指南进行。
贝尔盐雾试验标准
The test specimens to be examined shall be removed from the brazing operation directly after the brazing operation and shall be stored for at least 7 days until testing.
Valid is the released version in the system Author: H.Christl, EA-7 Editor: Fr.Wust, G-Q1 Management Systems Technical Documents Service Specialized responsibility:
= = = =
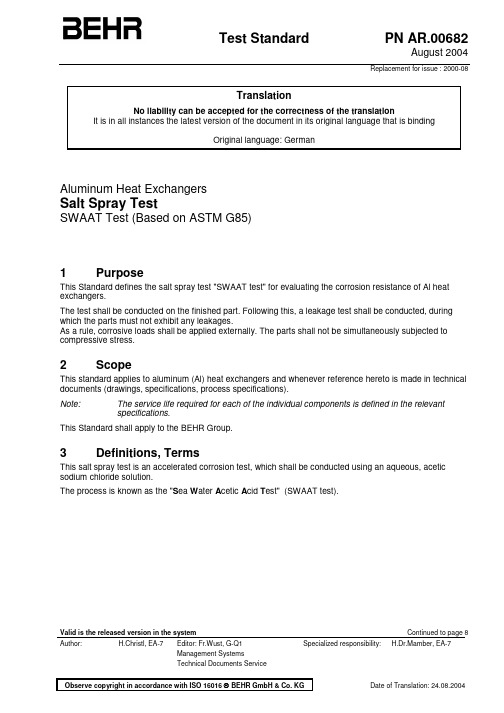
Temperature sensor Spray nozzle Measuring cylinder Test sheet
Fig. 2 Table 3 Designation Temperature sensor + nozzle Measuring cylinder (upper edge of funnel) Test sheet (lower edge) Height (mm) 450 325 380
Prüfteil = Prüfteilaufnahme =
Specimen Specimen holder
Fig. 1
Observe copyright in accordance with ISO 16016 BEHR GmbH & Co. KG
Page 4 PN AR.00682 : 2004-08
6.5
Layout of the measuring points
翻译(SUPAC-IR指导原则:速释口服固体制剂:放大生产和批准后变更)
Guidance for IndustryImmediate Release Solid Oral Dosage FormsScale-Up and Postapproval Changes: Chemistry, Manufacturing, and Controls, In Vitro Dissolution Testing, and In Vivo Bioequivalence DocumentationSUPAC-IR指导原则:速释口服固体制剂放大生产和批准后变更:化学、生产和控制,体外溶出试验、体内生物等效性文件Center for Drug Evaluation and Research (CDER)November 1995CMC 5药品评价与研究中心1995年11月CMC 5TABLE OF CONTENTS目录I. PURPOSE OF GUIDANCE (本指导原则的目的). . . . . . . . . . . . . . . . . . . . . . . . . .. . . . . . . . . . . . 1 II. DEFINITION OF TERMS(术语定义). . . . . . . . . . . . . . . . . . . . . . . . . . . . . . . . . . . . . . . . . . . . . .. 3 PONENTS AND COMPOSITION(辅料成分或组成的变更). . . . . . . . . . . . . . . . . . . . . . . . .. 6 IV. SITE CHANGES(地点变更). . . . . . . . . . . . . . . . . . . . . . . . . . . . . . . . . . . . . . . . . . . . . . . . . . . . .. 13 V. CHANGES IN BATCH SIZE (SCALE-UP/SCALE-DOWN)(批量大小(放大/缩小)的变更). .. . . . 16 VI. MANUFACTURING(生产变更). . . . . . . . . . . . . . . . . .. . . . . . . . . . . . . . . . . . . . . . . . . . . . . . . . . 18 VII. IN VITRO DISSOLUTION (体外溶出试验). . . . .. . . . . . . . . . . . . . . . . . . . . . . . . . . . . . . . . . . . . 23 VIII. IN VIVO BIOEQUIVALENCE STUDIES (体内生物等效性). . . . . . . . . . . . . . . . . . . . . . . . . . . . . 23 IX. REFERENCES(参考文献). . . . . . . . . . . . . . . . . . . . . . . . . . . . . . . . . . . . . . . . . . . . . . . . . . . . . . 25 APPENDIX A: NARROW THERAPEUTIC RANGE DRUGS(附录A:治疗窗狭窄药物). . . . . . . . . A-1GUIDANCE FOR INDUSTRY 1IMMEDIATE RELEASE SOLID ORAL DOSAGE FORMS SCALE-UP AND POSTAPPROVAL CHANGES: CHEMISTRY, MANUFACTURING, AND CONTROLS, IN VITRO DISSOLUTION TESTING, AND IN VIVO BIOEQUIVALENCE DOCUMENTATION速释口服固体制剂放大生产和批准后变更:化学、生产和控制,体外溶出试验、体内生物等效性文件I. PURPOSE OF GUIDANCE(本指导原则的目的)This guidance provides recommendations to sponsors of new drug applications (NDA's), abbreviated new drug applications (ANDA's), and abbreviated antibiotic applications (AADA's) who intend, during the postapproval period, to change: 1) the components or composition; 2) the site of manufacture; 3) the scale-up/scale-down of manufacture; and/or 4) the manufacturing (process and equipment) of an immediate release oral formulation.本指导原则所提供的的建议适用于新药申请(NDA's)、仿制药申请(ANDA's)和抗生素仿制药申请(AANA’S)的企业的批准后变更,内容包括:1)成分或组分的变更;2)生产地点的变更;3)放大/缩小生产规模的变更;和/或4)生产过程(工艺和设备)的变更This guidance is the result of: 1) a workshop on the scale-up of immediate release drug products conducted by the American Association of Pharmaceutical Scientists in conjunction with the United States Pharmacopoeial Convention and the Food and Drug Administration (FDA); 2) research conducted by the University of Maryland at Baltimore on the chemistry, manufacturing and controls of immediate release drug products under the FDA/University of Maryland Manufacturing Research Contract; 3) the drug categorization research conducted at the University of Michigan and the University of Uppsala on the permeability of drug substances; and 4) the Scale-Up and Post Approval Changes (SUPAC) Task Force which was established by the Center for Drug Evaluation and Research (CDER) Chemistry, Manufacturing and Controls Coordinating Committee to develop guidance on scale-up and other postapproval changes.本指导原则是以下工作的成果:1)在美国药学科学家协会与美国药典委员会和FDA的指导下,进行速释药品放大生产的车间;2)在位于巴尔的摩的马里兰大学指导下,并在FDA/马里兰大学生产研究合同下的速释药品的化学、生产和控制的研究;3)在密歇根大学和乌普萨拉大学指导下的药品分类学研究中关于药物渗透性的研究;4)由药品评价和研究中心(CDER)化学、生产和控制协调委员会成立的放大生产和批准后变更(SUPAC)特别小组,来制定关于放大生产和其它的批准后变更的指导原则。
美国_变电站抗震设计推荐规程_评介

第6期··电力建设Electric Power Construction第30卷第6期2009年6月Vol.30No.6Jun,2009美国《变电站抗震设计推荐规程》评介尤红兵1,赵凤新1,刘锡荟2(1.中国地震灾害防御中心,北京市,100029;2.信息产业部电子信息中心,北京市,100846)[摘要]简要介绍了美国《变电站抗震设计推荐规程》(IEEE Std 693—2005)的基本情况,详细讨论了变电站电气设备抗震性能标准,并与我国《电力设施抗震设计规范》进行了比较。
介绍了IEEE Std 693—2005规范对变电站电气设备振动台试验输入时程的规定,并给出了满足IEEE Std693—2005要求的推荐输入时程。
以断路器为例,简要介绍IEEE Std 693—2005抗震性能的评定方法和评定步骤。
结合我国情况,提出了建立变电站电气设备抗震性能检测标准的建议。
[关键词]变电站电气设备;抗震规范;性能检测;IEEE Std 693—2005中图分类号:TM63文献标志码:A文章编号:1000-7229(2009)06-0043-050引言四川汶川地震中,变电站电气设备破坏严重,不仅造成难以估量的经济损失,而且影响整个社会和国民经济的发展。
电气设备的抗震规范是在地震设防区进行设计施工的依据,在减轻地震灾害中发挥着积极的、重要的作用。
历次大地震震害的经验和教训推动着各国规范的不断修订和完善;相关的科学研究和抗震试验进展也推动各种规范的不断完善和发展。
唐山地震推动了我国各种抗震规范的编制。
我国先后制订了《高压开关设备抗震性能试验》[1]、《电力设施抗震设计规范》[2]以及《工业企业电气设备抗震设计规范》[3](2008,报批稿)。
但我国电气设备抗震性能检测工作比较滞后,缺少相应的管理体制,也没有变电站电气设备统一的检测标准,这也是造成汶川地震中变电站电气设备破坏严重的原因之一。
美国药典2011-5-3

171 VITAMIN B12 ACTIVITY ASSAY
Chemical Tests and Assays
Identification Tests
18BASES 191 IDENTIFICATION TESTS-GENERAL 194 IDENTIFICATION-TETRACYCLINES 197 SPECTROPHOTOMETRIC IDENTIFICATION TESTS 201 THIN-LAYER CHROMATOGRAPHIC IDENTIFICATION TEST
651 CONGEALING TEMPERATURE 661 CONTAINERS 671 CONTAINERS-PERMEATION 691 COTTON 695 CRYSTALLINITY 698 DELIVERABLE VOLUME 699 DENSITY OF SOLIDS 701 DISINTEGRATION 711 DISSOLUTION 721 DISTILLING RANGE 724 DRUG RELEASE
)尚未收入的新药和新制剂。 美国药典最新版为USP34-NF29,2010 年12 月出版,2011年5月1日生效。
Introduction
Front Matter
General Notices General Chapters Dietary Supplements Chapters Reagents
Chart 9 Chart 10 Chart 11 Chart 12 Chart 13
General Tests and Assays
Physical Tests and Determinations
601 AEROSOLS, NASAL SPRAYS, METEREDDOSE INHALERS,AND DRY POWDER INHALERS 616 BULK DENSITY AND TAPPED DENSITY 621 CHROMATOGRAPHY 631 COLOR AND ACHROMICITY 641 COMPLETENESS OF SOLUTION 643 TOTAL ORGANIC CARBON 645 WATER CONDUCTIVITY
- 1、下载文档前请自行甄别文档内容的完整性,平台不提供额外的编辑、内容补充、找答案等附加服务。
- 2、"仅部分预览"的文档,不可在线预览部分如存在完整性等问题,可反馈申请退款(可完整预览的文档不适用该条件!)。
- 3、如文档侵犯您的权益,请联系客服反馈,我们会尽快为您处理(人工客服工作时间:9:00-18:30)。
APPARATUS FOR EVALUATING STABILITY OF CORRUGATED BOARD UNDER LOAD IN CYCLIC HUMIDITY ENVIRONMENTby D.E. Gunderson and T.L. LaufenbergThe strength of a corrugated con-tainer is usually determined and reported as crush strength under progressively increasing top-to-bottom compressive load.1 The test is performed in seconds in a controlled constant temperature and relative humidity environment. However, a dynamic strength test under controlled conditions cannot account for the reduction in load-carrying ability inherent in the extended duration and changing humidity environment of actual warehousing and storage. In actual use, the container may be required to carry load for a period of many months, experiencing dozens of cyclic changes in relative humidity and, less significantly, temperature. Apparently, other means are needed to effectively measure and predict the long-term, load-carrying ability of corrugated board and containers in the actual service environment.2-4ASTM Method D4577-665 has been approved for the testing of containers, but suitable standards have not been set for testing paperboard and corru-gated board.In 1987, Considine and Gunderson6 described a method for mechanical testing of paperboard during compressive creep in a cyclic humidity environment. The USDA Forest Service, Forest Products Laboratory (FPL), recently devel-oped a device for evaluating corrugated board (the composite of linerboard faces and fluted corrugating medium) under conditions of constant load in a cyclic humidity environment. In this new device, corrugated board specimens can be loaded in either edgewise compression or flat-wise bending. Corru-gated board performance in these two modes is generally accepted as the dominant factor in determining container strength in dynamic tests.’ Because our constant load tests are necessarily of extended duration, testing multiple specimens at the same time is most efficient. The FPL apparatus is D.E. Gunderson is Research General Engineer. and T.L. Laufenberg is Supervisory Research General Engineer, USDA Forest Service, Forest Products Laboratory, Madison, WI.configured to load 28 specimens in edgewise compression and 30 specimens in four-point bending, but it can be recon-figured to test as many as 70 specimens in compression or 50 in bending.LOADING APPARATUS AND SPECIMEN DESCRIPTIONCompressionThe compression load frame is designed to provide con-stant edgewise load to the specimen. While under load, the specimen swells and shrinks as the relative humidity (RH) increases and decreases. Also, specimen height decreases progressively (compressive creep) over the extended load period.Design of the compression load frame is shown schemati-cally in Fig. 1. Access for installing or removing specimens is convenient because the load head is cantilevered from the guide rod. Load applied to the specimen may be increased or decreased by adjusting the position of the weight to the left or right on the lever arm. Load is applied to, or removed from, all specimens at the same time by lowering, or raising, the weight elevator.The platform (Fig. 1), which carries multiple load devices. is 305 by 710 mm and includes 14 separate load frames. The specimen is 51 mm wide and 38 mm high, the size specified by the Technical Association of the Pulp and Paper Industry (TAPPI) for measuring the edgewise compressive strength of corrugated board.8 The upper and lower edges of the specimen are paraffin-treated in accordance with TAPPI procedure. In our apparatus, a single-ply, C-size corrugated board specimen with a nominal crush strength of 8 kN/m at 50 percent RH would be loaded at 2 to 3 kN/m to evaluate its ability to carry load for an extended period with RH cycling between 50 and 90 percent. Performance of the specimen, at a given load. is defined as a function of time and deformation of the load head relative to the platform (Fig. 1). Time to fail and rate ofVolume 18, No. 1 January/February 1994Experimental Techniques 27mechanism (follower). In this device, an air-nozzle probe-head is linked with a pneumatic cylinder to form a closed loop servo system capable of following z-axis displacements with-out actual contact between probe-head and specimen. The pneumatic cylinder also provides capability for extending and retracting the probe-head. The system has a measurement range (z-direction) of ±25 mm with repeatability of 0.013 mm over the entire range. The air jet emitted by the nozzle in the probe-head applies 8 to 10 g of gauging force to the surface being gauged. In our system, the gantry positions the displace-ment gage over the selected specimen; the displacement gage extends, reads deformation. and retracts. The gantry then proceeds to the next specimen. A measurement cycle requires 15-s per specimen and approximately 15 min for the full array of 58 specimens and calibration steps.Deformation of a compression specimen is measured by positioning the gage over the appropriate specimen and ex-tending the probe to the top surface of the load head (Fig. 1). Deformation of bending specimens is determined from a single reading at center span of the bending specimen. A more precise measure of bending deformation can be determined from a series of readings on each specimen taken as the gantry traverses the constant moment portion of the specimen. Ra-dius of curvature of the deformed specimen is computed from a best fit to the data, i.e., pairing the readings of traverse along the specimen with vertical deformation.The complete instrument (Fig. 4) consists of compression and bending load frames, supporting table, weight elevator, gage positioning gantry, and noncontact displacement gage.A computer operates the gage and gantry and collects and analyzes deformation data. The instrument, without the com-puter, is situated in a humidity-controlled room where the RH can be cycled over the range from 30 to 90 percent while temperature is either held constant or cycled from 10°C to Fig. 4—Multi-specimen, compressive and bending creep evaluation apparatus. Actual device configured for 28 compression load frames and 30 bending load frames 32°C. The computer is located in an adjacent room held at 23°C and 50 percent RH.TEST RESULTSTwo corrugated boards made from the same linerboard and corrugating medium components were tested. Board A was assembled using a water-resistant adhesive, board B with a conventional starch adhesive. The two boards exhibited equal edgewise compressive strength at 73°F (23°C) and 50 percent RH when measured by TAPPI Standard T-811. The loads applied to the specimens were identical in the tests reported here. Additional samples of both A and B specimens were dip-coated with paraffin wax to retard the absorption of water vapor. Results obtained with these specimens are indicative of performance in a stable RH environment.The cyclic RH test samples included 16 uncoated speci-mens and 12 wax-coated specimens. These groups were di-vided into specimens bonded with water-resistant adhesive (A), or starch adhesive (B). All specimens carried the same compressive load: 25 percent of the average strength at 50 percent RH. The RH was cycled between 50 and 90 percent at constant 25°C. Relative humidity was ramped from one level to the other in a period of 1 h and held constant for 6 h. Cycle length was 14 h.CompressionFigure 5 shows data from a compression test of more than 3 days (more than six RH cycles) duration. In this environ-ment all uncoated B specimens failed during the first two cyclic changes to the 90-percent RH level, i.e., within the first 28 h. During this period, only one uncoated A specimen failed. The remainder of the uncoated A specimens failed during the third, fourth, and fifth cycles at 90 percent RH. i.e., between 28 and 70 h. The RH cycles on the displacement data of Fig. Fig. 5—Compressive creep deformation curves for corrugated board specimens under constant load at 25 percent of compressive strength. Relative humidity cycled from 50 to 90 percent, I-h ramp,6-h hold, 14-h cycle. Linerboard and fluting bonded withwater-resistant adhesive (A) or starch adhesive (B)Experimental Techniques 295 show that all the failures occurred during either the absorp-tion period or the hold period at 90 percent RH.Figure 5 also shows the slower, progressive (noncyclical)compressive displacement of the wax-coated specimens–both A and B. In plotting these data, we did not differentiate between A and B specimens because we found no significant difference in their performance when coated with paraffin.Three aspects of the test are noteworthy: (a) the uncoated specimens failed at a load level approximately one-quarter of the strength determined in a standard edgewise compression test: (b) the load carrying abilities of uncoated A and B specimens were shown to be different even though the speci-mens had the same strength at standard conditions: and (c)the mode of deformation and failure of the corrugated board under extended duration of load was different from the mode of deformation and failure for the linerboard and medium components of the corrugated board.When linerboard and medium were evaluated for compres-sive strength. as in the short-span compression strength tester 9or the FPL vacuum restraint apparatus,10 failure was highly localized. The rest of the sheet remained in-plane and was not visibly affected (Fig. 6). The total strain imposed on a speci-men to bring it to failure is nominally 0.5 to 1.0 percent.However. under long-term compressive loading in the cyclic Fig. 6—Compressive failure of linerboard in dynamic compression test at 50 percent relative humidity, performed on FPL vacuum restraint apparatus Fig. 7—Small-scale buckling failure of linerboard component of corrugated board subjected to constant compressive load in a cyclic humidity environmentRH environment, corrugated board developed a highly exag-gerated pattern of small-scale buckling deformation between the glue lines at the flutes over the entire surface of the test specimen (Fig. 7). This pattern developed long before failure,but became progressively more exaggerated as failure ap-proached. In a previous study, this pattern was less apparent,but also happened in dynamic compression of corrugated board. 11Strain-at-failure for the corrugated board was an order of magnitude greater than that observed for the com-pressive failure of the components.Bending The bending load frame subjected the mid-third portion of the specimen to a constant-moment load (zero-shear stress).The specimen responded by bowing or bending. We moni-tored this out-of-plane deformation and reported the result as center displacement of best-fit-radius-of-curvature for the mid-third of the specimen. Physical constraints of the appa-ratus limited our measurement to a minimum radius of curva-ture of 860 mm (center deflection approximately 4 mm). This corresponds to a bulge of just over 25 mm in a container 300mm high.If we envision that bending is the result of equal amounts of tensile and compressive strain in the top and bottom faces of the corrugated board, the bending test can be understood as a very sensitive evaluation of creep strain in the top and bottom linerboards. For a C-size flute corrugated board with typical thickness of 4.2 mm, the maximum strain in each linerboard is only 0.25 percent at the limit of bending within the load frame. Bending creep curves show compressive and tensile deformation of the linerboards in a strain range that is an order of magnitude smaller than that of the compression test.In this demonstration test of more than 3 days (more than six RH cycles) duration, all 16 uncoated specimens (both A and B) deformed to the limit (displacement of 4 mm) by the end of the second 90-percent RH cycle under load. The wax-coated specimens deformed at a very slow constant rate.After approximately six RH cycles, curvature caused by bending creep was virtually imperceptible.CONCLUDING REMARKSThis report describes a useful testing apparatus for meas-uring the deformation of large numbers of specimens using a single LVDT. The application of this equipment requires long term monitoring of specimens subjected to load and cyclic relative humidity conditions. This equipment is instrumental in demonstrating the affect of cyclic moisture on the creep properties of corrugated board when loaded in edgewise compression and flat-wise bending.30 January/February 1994ACKNOWLEDGMENTS REFERENCESThe authors gratefully acknowledge the exceptional com-petence and generous contributions of the following: Steve Hankel and Isthmus Engineering and Manufacturing Co-op in mechanical design consultation and fabrication; Wayland Tobey in concept development, component selection, and computer implementation; and Roland Gleisner, Tim Scott, and Rod Shea in fabrication, assembly, mechanical debug-ging, and development.1. TAPPI Test Methods T804 om-88, TAPPI Press, Atlanta, ISBN 0-89852-201-3, (1988).2. Byrd, V.L., TAPPI J., 67 (7), 86, (1984).3. Leake, C.H., TAPPI J., 71 (10), 71, (1988).4. Laufenberg, T.L., Proc.Int’l Paper Physics Conf., Kona, HI, (Sept. 1991).5. Annual Book of ASTM Standards Section 15, 15.09, ISBN 0-8031-1379-X. American Society of Testing and Materials, Philadelphia, (1989).6. Considine, J.M., and Gunderson, D.E., EXPERIMENTAL TECH-NIQUES, 11 (9), 18, (1987).7. McKee, R.C., Gander, J.W., and Wachuta, J.R., Paperboard Packaging, 48 (8), 149-159, (1963).8. TAPPI Test Methods T811 om-88, TAPPI Press, Atlanta, ISBN 0-89852-201-3,(1988).9. Calvin, S. and Fellers, C., Svensk Papperstidning, 78 (9), 321-332, (1975).10. Gunderson, D.E., Appita, 37 (2), 137-141, (1983).11. Urbanik, TJ., TAPPI J., 73 (10), 263-268, (1990).Printed on recycled paperExperimental Technique 31。