wireshark抓包实验之TCP(陕师大)
wireshark 抓取tcp信息原理
wireshark 抓取tcp信息原理
Wireshark是一款常用的网络协议分析工具,可以用来抓取和分析网络中的数据包,包括TCP信息。
以下是使用Wireshark抓取TCP信息的基本原理:
1. 监听网络接口:Wireshark需要将网络接口(如以太网、WiFi等)置于
监听模式,以便捕获经过网络接口的数据包。
2. 过滤数据包:在抓取数据包时,Wireshark可以通过过滤器来限制抓取的数据包类型和范围,以便只捕获感兴趣的TCP数据包。
3. 分析TCP数据包:当TCP数据包经过网络接口时,Wireshark会捕获这些数据包并进行分析。
TCP协议的数据包结构包括源端口和目的端口、序列号、确认号、窗口大小等。
这些信息可以帮助Wireshark识别和分类TCP
数据包。
4. 显示结果:Wireshark会将抓取到的TCP数据包以易于理解的格式展示
在屏幕上,用户可以查看每个数据包的详细信息,如源IP地址、目的IP地址、端口号、序列号等。
通过以上步骤,用户可以使用Wireshark抓取和分析TCP信息,了解网络
中TCP数据包的传输情况,从而进行故障排除、性能分析和安全审计等操作。
wireshark抓包实验报告
wireshark抓包实验报告Wireshark抓包实验报告1. 实验简介本次实验旨在通过使用Wireshark软件进行网络抓包,深入了解网络通信过程中的数据传输和协议交互。
通过分析抓包数据,我们可以了解网络流量的组成、协议的运作方式以及网络安全的相关问题。
2. 实验准备在进行实验之前,我们需要准备一台运行Wireshark软件的计算机,并连接到一个网络环境中。
Wireshark是一款开源的网络协议分析工具,可以在各种操作系统上运行。
安装并配置好Wireshark后,我们就可以开始进行抓包实验了。
3. 实验步骤3.1 启动Wireshark打开Wireshark软件,选择需要抓包的网络接口。
Wireshark会监听该接口上的所有网络流量,并将其显示在界面上。
3.2 开始抓包点击“开始”按钮,Wireshark开始抓取网络数据包。
此时,我们可以看到界面上实时显示的数据包信息,包括源地址、目标地址、协议类型等。
3.3 过滤抓包数据由于网络流量非常庞大,我们可以使用过滤器来筛选出我们感兴趣的数据包。
Wireshark提供了丰富的过滤器选项,可以根据协议、源地址、目标地址等条件进行过滤。
3.4 分析抓包数据选中某个数据包后,Wireshark会显示其详细信息,包括协议分层、数据字段等。
通过分析这些信息,我们可以了解数据包的结构和内容,进一步了解网络通信的细节。
4. 实验结果与讨论在实验过程中,我们抓取了一段时间内的网络流量,并进行了分析。
通过对抓包数据的观察和解读,我们得出了以下几点结果和讨论:4.1 协议分层在抓包数据中,我们可以清晰地看到各种协议的分层结构。
从物理层到应用层,每个协议都承担着不同的功能和责任。
通过分析协议分层,我们可以了解协议之间的关系,以及它们在网络通信中的作用。
4.2 数据传输过程通过分析抓包数据,我们可以追踪数据在网络中的传输过程。
我们可以看到数据包从源地址发送到目标地址的路径,了解中间经过的路由器和交换机等设备。
Wireshark抓包实验
Wireshark抓包实验报告一、实验名称TCP报文分析二、实验目的利用wireshark抓包工具抓取网络数据包,分析传输层TCP协议,加强对教材知识的理解,特别是TCP连接的特征,三次握手建立连接,累计确认方式,以及报文段的数据结构。
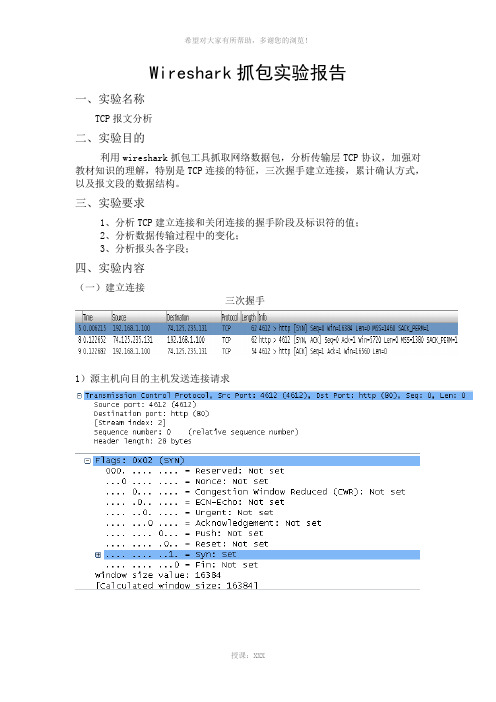
三、实验要求1、分析TCP建立连接和关闭连接的握手阶段及标识符的值;2、分析数据传输过程中的变化;3、分析报头各字段;四、实验内容(一)建立连接三次握手1)源主机向目的主机发送连接请求报头:源端口号:4612目的端口号:http(80)序列号:0(源主机选择0作为起始序号)报头长度:28字节标志位:仅SYN设为1,请求建立连接,ACK:not set 窗口大小:16384字节选项字段:8字节2)目的主机返回确认信号报头:源端口号:http(80)目的端口号:4612序列号:0(目的主机选择0作为起始序号)报头长度:28字节标志位:SYN设为1,ACK设为1,确认允许建立连接窗口大小:5720字节选项字段:8字节3)源主机再次返回确认信息,并可以携带数据报头:源端口号:4612目的端口号:http(80)序列号:1(发送的报文段编号)报头长度:22字节标志位:SYN=1,ACK=1窗口大小:16560字节(二)关闭连接四次握手1)源主机向目的主机发送关闭连接请求,FIN=12)目的主机返回确认信号,ACK=13)目的主机允许关闭连接,FIN=14)源主机返回确认信号,ACK=1五、总结及心得体会TCP协议是传输层的最重要的内容,面向连接,可靠传输,提供流量控制和拥塞控制,对TCP协议的理解和掌握有助于对网络层的学习。
通过抓包实验,对wireshark软件的操作更为熟练了,对教材所讲的内容也有了巩固。
(注:可编辑下载,若有不当之处,请指正,谢谢!)。
wireshark抓包实验报告
wireshark抓包实验报告Wireshark抓包实验报告引言:网络是现代社会中不可或缺的一部分,人们在日常生活中几乎无时无刻不在使用网络。
然而,网络的复杂性使得网络问题的排查变得困难。
Wireshark作为一款强大的网络抓包工具,可以帮助我们深入分析网络数据包,从而更好地理解和解决网络问题。
本文将介绍Wireshark的基本原理和使用方法,并通过实际抓包实验来验证其功能和效果。
一、Wireshark的基本原理Wireshark是一款开源的网络协议分析工具,可以运行在多个操作系统上。
它通过捕获网络接口上的数据包,并将其解析成可读的形式,以便我们进行深入分析。
Wireshark支持多种协议,包括以太网、无线网络、TCP/IP等,使得我们能够全面了解网络通信的细节。
二、Wireshark的使用方法1. 下载和安装Wireshark可以从其官方网站上免费下载,根据自己的操作系统选择合适的版本进行安装。
安装完成后,打开Wireshark并选择要抓包的网络接口。
2. 抓包设置在开始抓包之前,我们需要进行一些设置以确保我们能够捕获到想要分析的数据包。
首先,我们可以设置抓包过滤器来过滤出特定的数据包,以减少不必要的干扰。
其次,我们可以选择是否启用深度分析,以获取更详细的协议信息。
3. 开始抓包一旦设置完成,我们可以点击“开始”按钮开始抓包。
Wireshark将开始捕获网络接口上的数据包,并将其显示在主界面上。
我们可以看到每个数据包的详细信息,包括源IP地址、目标IP地址、协议类型等。
4. 数据包分析Wireshark提供了丰富的功能和工具,使得我们可以对抓包的数据包进行深入分析。
我们可以通过点击每个数据包来查看其详细信息,并根据需要进行过滤、排序和搜索。
此外,Wireshark还提供了统计功能,帮助我们了解网络流量的情况。
三、实验验证为了验证Wireshark的功能和效果,我们进行了一次抓包实验。
实验中,我们使用Wireshark抓取了一段时间内的网络数据包,并进行了分析。
WireShark抓取TCP与UDP包
1.引上次我们说了IPS测试,对大家来说,基本没什么给予,不过提到个WireShark抓包软件,这个软件与软件背后的知识模块倒是很值得学习的,想当初测试IPS所用的数据包都是应用这个软件来抓的(保存格式为.pcap,供Tomahawk做发包)。
用WireShark抓包一是方便,因为它在Windows平台上,图形界面,易操作,二是其强大的过滤器决定了这个抓包器的地位(关于过滤器的使用,可参见其软件的Help->Manual Pages->WireShark Filter帮助),三是该软件对所抓的包有十分详细的解释,很适合学习,特别是对网络协议的熟悉与掌握。
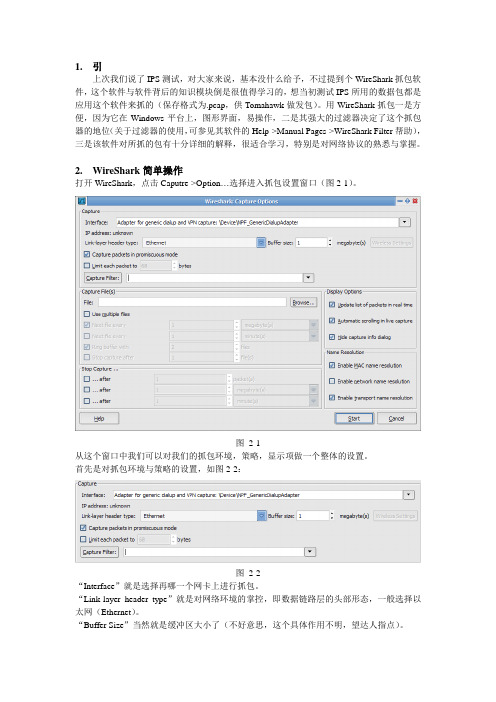
2.WireShark简单操作打开WireShark,点击Caputre->Option…选择进入抓包设置窗口(图2-1)。
图2-1从这个窗口中我们可以对我们的抓包环境,策略,显示项做一个整体的设置。
首先是对抓包环境与策略的设置,如图2-2:图2-2“Interface”就是选择再哪一个网卡上进行抓包。
“Link-layer header type”就是对网络环境的掌控,即数据链路层的头部形态,一般选择以太网(Ethernet)。
“Buffer Size”当然就是缓冲区大小了(不好意思,这个具体作用不明,望达人指点)。
“Caputre packets in promiscuous mode”当然就是开启网卡的混杂模式,使得软件对网络上经过该网卡的包都捕获下来。
“Limit packet to”就是限制抓包的大小。
“Capture Filter”就是过滤器,用于对抓包的类型进行控制。
点击,可以选择已有的过滤器。
其次,“Stop Capture…”栏,就是可以设置抓包的停止条件,分别可以从抓包数,抓包的总大小,抓包时间进行设置。
再次,“Display Options”设置显示选项,其下三点内容包括抓包实施更新显示,自动滚屏,隐藏捕捉信息对话框。
wireshark抓包实验之HTTP(陕师大)
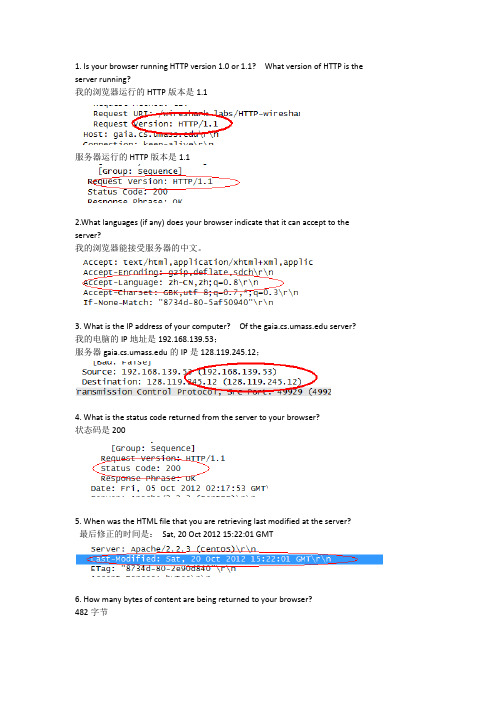
1. Is your browser running HTTP version 1.0 or 1.1? What version of HTTP is the server running?我的浏览器运行的HTTP版本是1.1服务器运行的HTTP版本是1.12.What languages (if any) does your browser indicate that it can accept to the server?我的浏览器能接受服务器的中文。
3. What is the IP address of your computer? Of the server? 我的电脑的IP地址是192.168.139.53;服务器的IP是128.119.245.12;4. What is the status code returned from the server to your browser?状态码是2005. When was the HTML file that you are retrieving last modified at the server?最后修正的时间是:Sat, 20 Oct 2012 15:22:01 GMT6. How many bytes of content are being returned to your browser?482字节7. By inspecting the raw data in the packet content window, do you see any headerswithin the data that are not displayed in the packet-listing window? If so, nameone.?8. Inspect the contents of the first HTTP GET request from your browser to theserver. Do you see an “IF-MODIFIED-SINCE” line in the HTTP GET?无,因为IE 浏览器选择工具-Internet 选项-删除文件,钩选“删除全部文件”从你的浏览器中移除缓存的文件9. Inspect the contents of the server response. Did the server explicitly return thecontents of the file? How can you tell?Yes10. Now inspect the contents of the second HTTP GET request from your browser tothe server. Do you see an “IF-MODIFIED-SINCE:” line in the HTTP GET? Ifso, what information follows the “IF-MODIFIED-SINCE:” header?有显示的内容:If-Modified-Since: Fri, 05 Oct 2012 05:25:01 GMT\r\n11. What is the HTTP status code and phrase returned from the server in response tothis second HTTP GET? Did the server explicitly return the contents of the file?Explain.状态码是304;没有显示返回文件的具体内容,而是返回304 告诉客户端其本地cache 的页面是最新的,于是客户端就可以直接从本地加载页面了,这样在网络上传输的数据就会大大减少,同时也减轻了服务器的负担。
wireshark抓包分析实验报告
Wireshark抓包分析实验若惜年一、实验目的:1.学习安装使用wireshark软件,能在电脑上抓包。
2.对抓出包进行分析,分析得到的报文,并与学习到的知识相互印证。
二、实验内容:使用抓包软件抓取HTTP协议通信的网络数据和DNS通信的网络数据,分析对应的HTTP、TCP、IP协议和DNS、UDP、IP协议。
三、实验正文:IP报文分析:从图中可以看出:IP报文版本号为:IPV4首部长度为:20 bytes数据包长度为:40标识符:0xd74b标志:0x02比特偏移:0寿命:48上层协议:TCP首部校验和:0x5c12源IP地址为:119.75.222.18目的IP为:192.168.1.108从图中可以看出:源端口号:1891目的端口号:8000udp报文长度为:28检验和:0x58d7数据长度:20 bytesUDP协议是一种无需建立连接的协议,它的报文格式很简单。
当主机中的DNS 应用程序想要惊醒一次查询时,它构造一个DNS查询报文段并把它给UDP,不需要UDP之间握手,UDP为报文加上首部字段,将报文段交给网络层。
第一次握手:从图中看出:源端口号:56770目的端口号:80序列号为:0首部长为: 32 bytesSYN为1表示建立连接成功当fin为1时表示删除连接。
第二次握手:从图中看出:源端口号是:80目的端口号为:56770序列号为:0ack为:1Acknowledgement为1表示包含确认的报文Syn为1表示建立连接。
第三次握手:从图中看出:源端口:56770目的端口:80序列号为:1ACK为:1首部长为:20bytesAcknowledgement为1表示包含确认的报文所以,看出来这是TCP连接成功了Tcp是因特网运输层的面向连接的可靠的运输协议,在一个应用进程可以开始向另一个应用进程发送数据前,这两个进程必须先握手,即它们必须相互发送预备文段,建立确保传输的参数。
发送报文:GET/HTTP/1.1:是请求一个页面文件HOST:是请求的主机名Connection:持续连接Accept: 收到的文件User-Agent : 浏览器的类型Accept-encoding: gzip ,deflate ,sdch限制回应中可以接受的内容编码值,指示附加内容的解码方式为gzip ,deflate ,sdch 。
wireshark抓包实验报告
本科实验报告实验名称:利用EtherPeek工具进行的网络抓包实验学员:学号:专业:所属学院:国防科学技术大学训练部制【实验名称】利用Wireshark工具进行的抓包实验【实验目的】通过Wireshark软件捕获并观察ARP协议、ICMP协议、FTP协议、HTTP协议以及TCP协议的工作原理,包括协议序列和报文内容【实验内容】实验环境描述:网络环境:因特网操作系统:Windows 7软件:Wiresharkv1.12.4实验步骤:1.Ping命令(ARP, ICMP分析)2.在实验主机使用FTP应用(FTP分析)3.在实验主机使用web应用(HTTP分析)【实验过程】1.ping命令(ICMP、ARP分析)实验主机的IP地址为:实验主机的MAC地址为:9c:4e:36:cf:db:e4在实验主机的命令框内输入命令:pingWireshark抓获的数据包如下:观察可得,抓获的报文里协议类型有ICMP与ARP。
(前12条是输入ping命令后抓取的)(1)ICMP分析:首先明确一下ICMP的相关知识:ICMP是(Internet Control Message Protocol)Internet控制报文协议。
它是TCP/IP协议族的一个子协议,用于在IP主机、路由器之间传递控制消息。
控制消息是指网络通不通、主机是否可达、路由是否可用等网络本身的消息。
这些控制消息虽然并不传输用户数据,但是对于用户数据的传递起着重要的作用。
各种ICMP报文的前32bits都是三个长度固定的字段:type类型字段(8位)、code代码字段(8位)、checksum校验和字段(16位) 8bits类型和8bits代码字段:一起决定了ICMP报文的类型。
常见的有:类型0、代码0:回应应答。
类型3、代码0:网络不可达类型3、代码1:主机不可达类型5、代码1:为主机重定向数据包类型8、代码0:回应类型11、代码0:传输中超出TTL(常说的超时)16bits校验和字段:包括数据在内的整个ICMP数据包的校验和,其计算方法和IP头部校验和的计算方法是一样的。
wireshark抓包实验之TCP(陕师大)
实验六 Wireshark Lab: TCP一、实验目的1.通过wireshark 抓包理解应用层TCP 协议。
二、实验器材1.PC 机电脑一台。
2.Wireshark 软件。
三、实验内容1.依照Wireshark Lab 提供的实验步骤完成实验。
2.回答实验中的问题。
四、实验操作实践与步骤2. A first look at the captured trace1. What is the IP address and TCP port number used by the client computer (source) that is transferring the file to ? To answer this question, it’s probably easiest to select an HTTP message and explore the details of the TCP packet used to carry this HTTP message, using the “details of the selected packet header window”2. What is the IP address of ? On what port number is itsending and receiving TCP segments for this connection? Source IP address :129.168.1.102Source TCP portnumber :1161Destination IP address :128.119.245.12Destination TCPport number:80If you have been able to create your own trace, answer the following question:3. What is the IP address and TCP port number used by your client computer (source) to transfer the file to ?3. TCP Basics4. (1)What is the sequence number of the TCP SYN segment that is used to initiate the TCP connection between the client computer and ? (2)What is it in the segment that identifies the segment as a SYN segment?(1) SYN sequence number =0(2) What is in the red region of the figure above identifies the segment as a SYN segment.5. (1)What is the sequence number of the SYNACK segment sent by to the client computer in reply to the SYN?(2) What is the value of the ACKnowledgement field in the SYNACK segment? How did determine that value? What is it in the segment that identifies the segment as a SYNACK segment?(1)SYNACK sequence number =0, ACKnowledgement=1(2)ACKnowledgement value= initiate sequence number of the TCP SYN segment+1(3)What is in the red region of the figure above identifies the segment as a SYN segment.6. What is the sequence number of the TCP segment containing the HTTP POST command? Note that in order to find the POST command, you’ll need to dig into the packet content field at the bottom of the Wireshark window, looking for a segment with a “POST” wi thin itsDATA field.The sequence number of the TCP segment containing the HTTP POST command is 1.7. Consider the TCP segment containing the HTTP POST as the first segment in the TCP connection. (1)What are the sequence numbers of the first six segments in the TCP connection (including the segment containing the HTTP POST)? (2)At what time was each segment sent? When was the ACK for each segment received?(3) Given the difference between when each TCP segment was sent, and when its acknowledgement was received, what is the RTT value for each of the six segments?(4) What is the EstimatedRTT value (see page 249 in text) after the receipt of each ACK? (5)Assume that the value of the EstimatedRTT is equal to the measured RTT for the first segment, and then is computed using the EstimatedRTT equation on page 249 for allsubsequent segments.Note: Wireshark has a nice feature that allows you to plot the RTT for each of the TCP segments sent. Select a TCP segment in the “listing of captured packets” window that is being sent from the client to the server. Then select: Statistics->TCP Stream Graph- >Round Trip Time Graph(1) The first sixsegments are the No.4, 5, 7, 8, 10, and 11 segments.(circled in red)The sequence numbers of them respectively are1, 566, 2026, 3486, 4946, 6406, 7866.(2)They were respectively sent at the time circled int the figure bellow.(3)ACK received time are given in the figure bellow:(4)RTT value for each of the six segmentsSent time ACK received time RTT value Segment1 0.026477 0.053937 0.02746 Segment2 0.041737 0.077294 0.035557 Segment3 0.054026 0.124085 0.070059 Segment4 0.054690 0.169118 0.11443(5)EstimatedRTT = 0.875 * EstimatedRTT + 0.125 * SampleRTT EstimatedRTT after the receipt of the ACK of segment 1: EstimatedRTT = RTT for Segment 1 = 0.02746 secondsegment 2:EstimatedRTT = 0.875 * 0.02746 + 0.125 * 0.035557 = 0.0285 segment 3:EstimatedRTT = 0.875 * 0.0285 + 0.125 * 0.070059 = 0.0337 segment 4:EstimatedRTT = 0.875 * 0.0337+ 0.125 * 0.11443 = 0.0438 segment 5:EstimatedRTT = 0.875 * 0.0438 + 0.125 * 0.13989 = 0.0558 segment 6:EstimatedRTT = 0.875 * 0.0558+ 0.125 * 0.18964 = 0.0725Figure: Round Trip Time Graph8. What is the length of each of the first six TCP segments?The length of the first TCP segments (containing the HTTP POST) is 566 bytes. The length of each of the other five TCP segments is 1460 bytes.9. What is the minimum amount of available buffer space advertised at the received for the entire trace? Does the lack of receiver buffer space ever throttle the sender?The minimum amount of available buffer space at advertised at for the entire trace is 5840 bytes, which shows in the first acknowledgement (No.2 segment )from the server. This receiver window grows steadily until a maximum receiver buffer size of 62780bytes. The sender is never throttled due to lacking of receiver buffer space by inspecting this trace.Figure : Minimum receive window (packet No.2)10. Are there any retransmitted segments in the trace file? What did you check for (in the trace)in order to answer the question?There is no retransmitted segments in the trace file.In order to answer the question , I checked for the sequence numbers of the TCP segments in the trace file. In the Time-Sequence-Graph (Stevens) of this trace, all sequence numbers from 192.168.1.102 to 128.119.245.12 are increasing linear and monotonically. If there is a retransmitted segment, the Time-Sequence-Graph (Stevens) should be different from what we see.11.(1) How much data does the receiver typically acknowledge in an ACK?(2) Can you identify cases where the receiver is ACKing every other received segment (see Table 3.2 on page 257 in the text).The receiver typically acknowledged sequence numbers of the ACKs are listed in the following table.Acknowledged sequence number Acknowledged data SegmentnumberACK16 566 566ACK29 2026 1460ACK312 3486 1460ACK414 4946 1460ACK515 6406 146012. What is the throughput (bytes transferred per unit time) for the TCP connection? Explain how you calculated this value.The TCP connection started to transmit data at segment 4,and end in segment 202. We can see from the figure bellow:data1=1 byte t1=0.026477data2=164091 bytes t2=5.455830total data=164091-1=164090 bytesit takes time: total time=5.455830-0.026477=5.429353 secondsSo the throughput for the TCP connection is calculated as164090/5.4294353= 30.222 KByte/sec13. Use the Time-Sequence-Graph(Stevens) plotting tool to view the sequence number versus time plot of segments being sent from the client to the server. Can you identify where TCP’s slow start phase begins and ends, and where congestion avoidance takes over?Comment on ways in which the measured data differs from the idealized behavior of TCP that we’ve studied in the text.We can see from the figure above(Time-Sequence-Graph(Stevens)) that the TCP Slow Start begins at the start of the connection.The identification of the TCP slow start phase and congestion avoidance phase depends on the value of the congestion window size of this TCP sender. So once we know the congestion window size of this TCP sender, we can tell easily where TCP’s slow ends and where congestion avoidance takes over.When answering the previous question, we can know that the TCP window size is larger than 8192 Bytes.But there is no data sent more than 8192 Bytes. It indicates before the end of the start phase,the application already stops transmitting . That is to say, the TCP’s slow ends and congestion avoidance haven’t taken place.五、实验结论总的来说,这一次实验做的很痛苦,因为一开始问题回答不出来。
Wireshark抓包实验报告.
第一次实验:利用Wireshark软件进行数据包抓取1.3.2 抓取一次完整的网络通信过程的数据包实验一,实验目的:通过本次实验,学生能掌握使用Wireshark抓取ping命令的完整通信过程的数据包的技能,熟悉Wireshark软件的包过滤设置和数据显示功能的使用。
二,实验环境:操作系统为Windows 7,抓包工具为Wireshark.三,实验原理:ping是用来测试网络连通性的命令,一旦发出ping命令,主机会发出连续的测试数据包到网络中,在通常的情况下,主机会收到回应数据包,ping采用的是ICMP协议。
四,验步骤:1.确定目标地址:选择作为目标地址。
2.配置过滤器:针对协议进行过滤设置,ping使用的是ICMP协议,抓包前使用捕捉过滤器,过滤设置为icmp,如图 1- 1图 1-13.启动抓包:点击【start】开始抓包,在命令提示符下键入ping , 如图 1-2图 1-2停止抓包后,截取的数据如图 1-3图 1-34,分析数据包:选取一个数据包进行分析,如图1- 4图1-4每一个包都是通过数据链路层DLC协议,IP协议和ICMP协议共三层协议的封装。
DLC协议的目的和源地址是MAC地址,IP协议的目的和源地址是IP地址,这层主要负责将上层收到的信息发送出去,而ICMP协议主要是Type和Code来识别,“Type:8,Code:0”表示报文类型为诊断报文的请求测试包,“Type:0,Code:0”表示报文类型为诊断报文类型请正常的包。
ICMP提供多种类型的消息为源端节点提供网络额故障信息反馈,报文类型可归纳如下:(1)诊断报文(类型:8,代码0;类型:0代码:0);(2)目的不可达报文(类型:3,代码0-15);(3)重定向报文(类型:5,代码:0--4);(4)超时报文(类型:11,代码:0--1);(5)信息报文(类型:12--18)。
1.4.1,TCP协议的分析实验一,实验目的:通过本次实验,掌握使用Wireshark抓取TCP协议的数据包的技能,能够在深入分析“TCP的三次握手”,TCP的四次挥手协议在网络数据流的基础上,进一步提高理论联系实践的能力。
- 1、下载文档前请自行甄别文档内容的完整性,平台不提供额外的编辑、内容补充、找答案等附加服务。
- 2、"仅部分预览"的文档,不可在线预览部分如存在完整性等问题,可反馈申请退款(可完整预览的文档不适用该条件!)。
- 3、如文档侵犯您的权益,请联系客服反馈,我们会尽快为您处理(人工客服工作时间:9:00-18:30)。
实验六 Wireshark Lab: TCP一、实验目的1.通过wireshark 抓包理解应用层TCP 协议。
二、实验器材1.PC 机电脑一台。
2.Wireshark 软件。
三、实验内容1.依照Wireshark Lab 提供的实验步骤完成实验。
2.回答实验中的问题。
四、实验操作实践与步骤2. A first look at the captured trace1. What is the IP address and TCP port number used by the client computer (source) that is transferring the file to ? To answer this question, it’s probably easiest to select an HTTP message and explore the details of the TCP packet used to carry this HTTP message, using the “details of the selected packet header window”2. What is the IP address of ? On what port number is itsending and receiving TCP segments for this connection? Source IP address :129.168.1.102Source TCP portnumber :1161Destination IP address :128.119.245.12Destination TCPport number:80If you have been able to create your own trace, answer the following question:3. What is the IP address and TCP port number used by your client computer (source) to transfer the file to ?3. TCP Basics4. (1)What is the sequence number of the TCP SYN segment that is used to initiate the TCP connection between the client computer and ? (2)What is it in the segment that identifies the segment as a SYN segment?(1) SYN sequence number =0(2) What is in the red region of the figure above identifies the segment as a SYN segment.5. (1)What is the sequence number of the SYNACK segment sent by to the client computer in reply to the SYN?(2) What is the value of the ACKnowledgement field in the SYNACK segment? How did determine that value? What is it in the segment that identifies the segment as a SYNACK segment?(1)SYNACK sequence number =0, ACKnowledgement=1(2)ACKnowledgement value= initiate sequence number of the TCP SYN segment+1(3)What is in the red region of the figure above identifies the segment as a SYN segment.6. What is the sequence number of the TCP segment containing the HTTP POST command? Note that in order to find the POST command, you’ll need to dig into the packet content field at the bottom of the Wireshark window, looking for a segment with a “POST” wi thin itsDATA field.The sequence number of the TCP segment containing the HTTP POST command is 1.7. Consider the TCP segment containing the HTTP POST as the first segment in the TCP connection. (1)What are the sequence numbers of the first six segments in the TCP connection (including the segment containing the HTTP POST)? (2)At what time was each segment sent? When was the ACK for each segment received?(3) Given the difference between when each TCP segment was sent, and when its acknowledgement was received, what is the RTT value for each of the six segments?(4) What is the EstimatedRTT value (see page 249 in text) after the receipt of each ACK? (5)Assume that the value of the EstimatedRTT is equal to the measured RTT for the first segment, and then is computed using the EstimatedRTT equation on page 249 for allsubsequent segments.Note: Wireshark has a nice feature that allows you to plot the RTT for each of the TCP segments sent. Select a TCP segment in the “listing of captured packets” window that is being sent from the client to the server. Then select: Statistics->TCP Stream Graph- >Round Trip Time Graph(1) The first sixsegments are the No.4, 5, 7, 8, 10, and 11 segments.(circled in red)The sequence numbers of them respectively are1, 566, 2026, 3486, 4946, 6406, 7866.(2)They were respectively sent at the time circled int the figure bellow.(3)ACK received time are given in the figure bellow:(4)RTT value for each of the six segmentsSent time ACK received time RTT value Segment1 0.026477 0.053937 0.02746 Segment2 0.041737 0.077294 0.035557 Segment3 0.054026 0.124085 0.070059 Segment4 0.054690 0.169118 0.11443(5)EstimatedRTT = 0.875 * EstimatedRTT + 0.125 * SampleRTT EstimatedRTT after the receipt of the ACK of segment 1: EstimatedRTT = RTT for Segment 1 = 0.02746 secondsegment 2:EstimatedRTT = 0.875 * 0.02746 + 0.125 * 0.035557 = 0.0285 segment 3:EstimatedRTT = 0.875 * 0.0285 + 0.125 * 0.070059 = 0.0337 segment 4:EstimatedRTT = 0.875 * 0.0337+ 0.125 * 0.11443 = 0.0438 segment 5:EstimatedRTT = 0.875 * 0.0438 + 0.125 * 0.13989 = 0.0558 segment 6:EstimatedRTT = 0.875 * 0.0558+ 0.125 * 0.18964 = 0.0725Figure: Round Trip Time Graph8. What is the length of each of the first six TCP segments?The length of the first TCP segments (containing the HTTP POST) is 566 bytes. The length of each of the other five TCP segments is 1460 bytes.9. What is the minimum amount of available buffer space advertised at the received for the entire trace? Does the lack of receiver buffer space ever throttle the sender?The minimum amount of available buffer space at advertised at for the entire trace is 5840 bytes, which shows in the first acknowledgement (No.2 segment )from the server. This receiver window grows steadily until a maximum receiver buffer size of 62780bytes. The sender is never throttled due to lacking of receiver buffer space by inspecting this trace.Figure : Minimum receive window (packet No.2)10. Are there any retransmitted segments in the trace file? What did you check for (in the trace)in order to answer the question?There is no retransmitted segments in the trace file.In order to answer the question , I checked for the sequence numbers of the TCP segments in the trace file. In the Time-Sequence-Graph (Stevens) of this trace, all sequence numbers from 192.168.1.102 to 128.119.245.12 are increasing linear and monotonically. If there is a retransmitted segment, the Time-Sequence-Graph (Stevens) should be different from what we see.11.(1) How much data does the receiver typically acknowledge in an ACK?(2) Can you identify cases where the receiver is ACKing every other received segment (see Table 3.2 on page 257 in the text).The receiver typically acknowledged sequence numbers of the ACKs are listed in the following table.Acknowledged sequence number Acknowledged data SegmentnumberACK16 566 566ACK29 2026 1460ACK312 3486 1460ACK414 4946 1460ACK515 6406 146012. What is the throughput (bytes transferred per unit time) for the TCP connection? Explain how you calculated this value.The TCP connection started to transmit data at segment 4,and end in segment 202. We can see from the figure bellow:data1=1 byte t1=0.026477data2=164091 bytes t2=5.455830total data=164091-1=164090 bytesit takes time: total time=5.455830-0.026477=5.429353 secondsSo the throughput for the TCP connection is calculated as164090/5.4294353= 30.222 KByte/sec13. Use the Time-Sequence-Graph(Stevens) plotting tool to view the sequence number versus time plot of segments being sent from the client to the server. Can you identify where TCP’s slow start phase begins and ends, and where congestion avoidance takes over?Comment on ways in which the measured data differs from the idealized behavior of TCP that we’ve studied in the text.We can see from the figure above(Time-Sequence-Graph(Stevens)) that the TCP Slow Start begins at the start of the connection.The identification of the TCP slow start phase and congestion avoidance phase depends on the value of the congestion window size of this TCP sender. So once we know the congestion window size of this TCP sender, we can tell easily where TCP’s slow ends and where congestion avoidance takes over.When answering the previous question, we can know that the TCP window size is larger than 8192 Bytes.But there is no data sent more than 8192 Bytes. It indicates before the end of the start phase,the application already stops transmitting . That is to say, the TCP’s slow ends and congestion avoidance haven’t taken place.五、实验结论总的来说,这一次实验做的很痛苦,因为一开始问题回答不出来。