中级宏观经济学CHAP08
中级宏观经济学Abel_Chapter08

Copyright © 2009 Pearson Education Canada
8-13
The Business Cycle Facts (continued)
Two important characteristics of the cyclical behaviour:
the direction in which a macroeconomic variable moves relative to the direction of aggregate economic activity; the timing of the variable’s turning points relative to the turning points of the business cycle.
Copyright © 2009 Pearson Education Canada 8-5
What is a Business Cycle?
1. Fluctuation of “aggregate economic activity”. 2. Expansions and contractions.
Copyright © 2009 Pearson Education Canada 8-15
The Business Cycle Facts (continued)
A leading variable’s turning points occur before those of the business cycle. A coincident variable’s turning points occur around the same time as those of the business cycle. A lagging variable’s turning points occur later than those of the business cycle.
《中级宏观经济学》课件

详细描述
经济周期的成因多种多样,其中内因是主要原因之一 。内因主要包括总需求和总供给的变化、经济结构的 变化等。例如,总需求的变化会导致生产过剩或需求 不足,进而引发经济衰退或通货膨胀;经济结构的变 化也会导致资源重新配置,从而引发经济波动。此外 ,外因也是不可忽视的因素之一,如政策调整、国际 经济环境的变化等也会对经济周期产生影响。
宏观经济学与微观经济学的关系
宏观经济学和微观经济学是现代经济学的两大分支,微观经济学主要研究个体经济活动,而宏观经济学则更关注 整体经济运行。
宏观经济学的研究对象
总需求与总供给
宏观经济学主要研究总需求和总供给 的关系,以及如何通过政策手段调节 经济活动,以实现经济的稳定增长。
国民收入决定
国民收入是衡量一个国家经济状况的 重要指标,宏观经济学研究国民收入 如何决定,以及如何通过政策手段影 响国民收入水平。
货币政策实施效果
评估货币政策的实施效果,包括政策目标的实现程度、政策副作用等 。
财政政策与货币政策的配合使用
配合使用的必要性
阐述为什么需要财政政策和货币政策 配合使用,以及配合使用的优点和挑
战。
配合使用的策略
探讨如何实现财政政策和货币政策的 配合,包括政策目标的协调、政策工
具的搭配等。
配合使用的效果评估
06
财政政策与货币政策
财政政策及其效应分析
财政政策定义
财政政策效应分析
财政政策是指政府通过税收和支出等手段 来调节经济活动的政策。
财政政策对经济增长、就业、通货膨胀等 宏观经济指标的影响,以及如何通过财政 政策来稳定经济。
财政政策工具
财政政策实施效果
包括政府支出、税收、政府投资等,以及 如何根据经济形势选择合适的财政政策工 具。
中级宏观经济学ppt课件第7、8章

经济秩序紊乱
通货膨胀会破坏正常的经济秩序,导致市场 信号失真。
影响国际竞争力
通货膨胀会降低本国货币的实际购买力,影 响国际竞争力。
治理失业与通货膨胀的政策措施及效果评估
治理失业的政策措施
促进经济增长,创造 更多的就业机会。
实施积极的就业政策, 如提供职业培训和就 业指导等。
治理失业与通货膨胀的政策措施及效果评估
失业人员无法为社会创 造财富,导致社会总产
出减少。
增加社会负担
失业人员需要社会提供 救济和保障,增加政府
财政负担。
影响社会稳定
长期失业会导致社会不 稳定因素增加,如犯罪
率上升等。
通货膨胀对社会经济的影响
物价上涨
通货膨胀导致货币贬值,物价普遍上涨,降 低消费者购买力。
社会财富再分配
通货膨胀会导致社会财富重新分配,通常不 利于固定收入者和储蓄者。
事业得到发展,从而推动社会进步。
03
经济增长创造就业机会
经济增长促进了企业扩张和产业升级,创造了更多的就业机会,降低了
失业率。
经济发展促进经济增长
经济发展优化资源配置
通过技术进步、产业升级和制度创新等手段,经济发展能够优化 资源配置,提高生产效率,从而促进经济增长。
经济发展提高国际竞争力
经济发展有助于提升国家的国际地位和综合国力,增强国际竞争力, 为经济增长创造更加有利的外部环境。
完善社会保障制度,保障失业人员的基本生活。 治理通货膨胀的政策措施
控制货币供应量,稳定物价。
治理失业与通货膨胀的政策措施及效果评估
01
调整财政政策,减少政府开支。
02
提高生产效率,降低成本。
效果评估
03
中级宏观经济学课件8
• 模型分析
图11.10 全要素生产率持久提高的影响
二、真实经济周期模型
• 模型预测
表11.2 经验数据与真实经济周Байду номын сангаас模型的预测
变量 消费 投资 价格水平 货币供给 就业 实际工资 平均劳动生产率 经验数据 顺周期 顺周期 逆周期 顺周期 顺周期 顺周期 顺周期 模型 顺周期 顺周期 逆周期 —— 顺周期 顺周期 顺周期
利率上升
就业增加 实际工资下降 消费减少 投资减少
利率不变
就业增加 实际工资下降 消费不变 投资不变
二、模型应用
• 考虑当期资本存量K下降
图9.20 当期资本存量K下降的影响
二、模型应用
• 考虑当期资本存量K下降 ☆均衡效应 1、总产出Y减少; 2、利率上升; 3、就业减少; 4、实际工资下降; 5、消费减少; 6、投资增加;
一、凯恩斯协调失效模型
• 非理性繁荣说
凯恩斯认为,人类的“动物精神”使得市场容易出现非理性繁 荣或崩溃,即经济周期。 “动物精神”是指人类在潜意识里荒谬地假设自己总是会有好 运气,或多或少地高估自己获利的机会而低估亏损的几率。 而一旦形势逆转,立即又会过分悲观。
一、凯恩斯协调失效模型
• 模型预测
•政府 政府满足其现值预算约束
三、货币跨期模型
• 典型消费者和典型企业对银行服务的最优选择
图10.3 典型消费者对银行服务的最优选择
三、货币跨期模型
• 货币需求函数 M d PL(Y , r)
图10.6 货币需求曲线
三、货币跨期模型
图10.9 当期货币市场均衡
三、货币跨期模型
• 竞争性均衡
主要宏观经济变量与GDP的联动关系
中级宏观经济学 主要内容

第二章:国民收入核算
收入法、支出法、产出法
链式加权的实际GDP
第三章长期中的封闭经济模型
第五章长期中的开放经济模型小型、大型
第七、八章经济增长
第九-十一章短期中的封闭经济凯恩斯交叉图
IS-LM AS-AD
长短期调整
第十二章短期中的开放经济
第十三章政策无效性命题
第十四章DAD-DAS模型
考试题型:
1.单选题(15分-20分,2-3分/题)
2.作图题(15-20分,2题)
要求:
3.计算、分析、作图题(60-70分)
要求:要有计算步骤和必要的文字说明,作图要以题目的计算结果为基础,
小数位数的保留按照题目要求,
计算结果可保留分数和根号等形式。
考试具体题型及分布确定后会及时发送到课程邮箱。
考试时间:16周周一7-8节
作图题练习:
作图分析政府购买增加在各模型中的效应,对变量有何影响?。
(NEW)张延《中级宏观经济学》课后习题详解

目 录第一篇 宏观经济学导论第一章 宏观经济学概述第二章 宏观经济指标的度量第二篇 总需求分析第三章 产品市场均衡:收入-支出模型第四章 产品市场和货币市场的同时均衡:IS-LM模型第五章 宏观经济政策第三篇 总供给分析第六章 对劳动力市场状况的度量第七章 凯恩斯主义的总供给曲线第八章 新古典主义的总供给曲线第四篇 长期经济增长理论第九章 索洛经济增长模型第一篇 宏观经济学导论第一章 宏观经济学概述说明:作为教材的第一章,本章系统地介绍了宏观经济学的发展史、研究对象和研究方法。
考虑到宏观经济背景非常重要,建议读者予以重视。
本章无相关习题。
第二章 宏观经济指标的度量1假设某农业国只生产两种产品:橘子和香蕉。
利用下表的资料,计算2002年和2009年该国实际GDP的变化,但要以2002年的价格来计算。
根据本题的结果证明:被用来计算实际GDP的价格的确影响所计算的增长率,但一般来说这种影响不是很大。
答:(1)以2002年的价格为基期价格:2002年该国的实际GDP为:GDP2002=50×0.22+15×0.2=14;2009年该国的实际GDP为:GDP2009=60×0.22+20×0.2=17.2;实际GDP增长率为:(17.2-14)/14×100%=22.9%。
(2)以2009年的价格为基期价格:2002年该国的实际GDP为:GDP2002=50×0.25+15×0.3=17;2009年该国的实际GDP为:GDP2009=60×0.25+20×0.3=21;实际GDP增长率为:(21-17)/17×100%=23.5%。
由22.9%与23.5%只相差0.6%,由此可见,用来计算实际GDP的价格的确影响所计算的增长率,但一般来说这种影响不是很大。
2根据国民收入核算恒等式说明:(1)税收的增加(同时转移支付保持不变)一定意味着在净出口、政府购买或储蓄-投资差额上的变化。
中级宏观经济学macro-ch8

即维持人均资本 k 不变所必需的投资量 包括:
k 折旧 n k 为新工人提供资本所需要的投资
g k 为由于技术进步所创造的新的“效率工人” 提供资本所需要的投资
11/21/2019
slide 7
Tech. progress in the Solow model
slide 21
1. Evaluating the Rate of Saving
1. k = 2.5 y
2. k = 0.1 y
3. MPK k = 0.3 y
To determine MPK, divide 3 by 1:
MPK k 0.3 y
k
2.5 y
MPK 0.3 0.12
1. Evaluating the Rate of Saving
1. k = 2.5 y
2. k = 0.1 y
3. MPK k = 0.3 y
To determine , divide 2 by 1:
k 0.1y k 2.5 y
0.1 0.04
2.5
11/21/2019
so n + g = 0.03
Thus, in the U.S.,
MPK = 0.08 > 0.03 = n + g
结论:
美国经济(资本存量)低于黄金律稳定状态:如果提高储蓄 率(即提高投资水平),经济将获得更快的增长,并最终达 到更高人均消费水平的新的稳定状态
11/21/2019
slide 23
c* = y* i*
= f (k*) ( + n + g) k*
《中级宏观经济学》第八讲货币供给.ppt
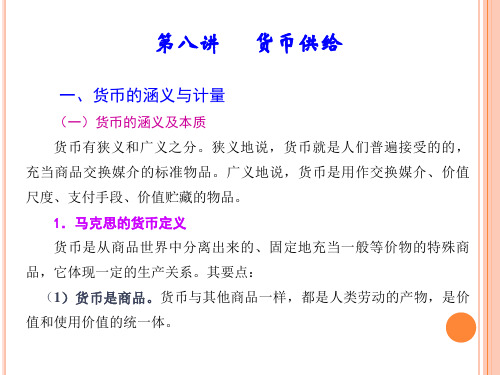
在一个典型的市场经济体系中,商业银行向中央银行借款, 会增加准备金存款,也即基础货币的数量,从而能支持更多地 创造存款货币。所以,在其他条件不变时,商业银行增加中央 银行借款会扩大货币供应量,减少中央银行借款会减少货币供 应量。
决定商业银行向中央银行借款的行为动机也是成本收益动 机,市场利率的高低,正相关地影响从银行借款的多少;而中 央银行贴现率的高低,对于商业银行借款数量的多少,则是负 相关的。
B=R+C= Rr+ Re+C=Rd+ Rt +Re+C
(8-5)
基础货币又称为高能货币或强力货币(high-powered money)。
基础货币的特点:①它是中央银行的负债;②它的流通性很 强,持有者可以自主运用,是所有货币中最活跃的部分;③它运动 的结果能够产生数倍于其自身的货币;④中央银行能够控制它,并 通过对它的控制来实现对货币供给的控制。
按国际货币基金组织(IMF)的口径,在一般情况下,货币可 区分以下三个层次:
第一, M0,指流通于银行体系以外的现金,包括流
通中居民手中的现金和企业单位的备用金。 第二,M1,即狭义货币。它等于现金与活期存款之和:
M1= M0+活期存款。许多国家都把控制货币供应量的主要 措施放在这一层次,使之成为货币政策调控的主要对象。
表8-1 中国1990-2006年货币供应量(亿元)
400000 350000 300000 250000 200000 150000 100000
50000 0
1990 1991 1992 1993 1994 1995 1996 1997 1998 1999 2000 2001 2002 2003 2004 2005 2006
- 1、下载文档前请自行甄别文档内容的完整性,平台不提供额外的编辑、内容补充、找答案等附加服务。
- 2、"仅部分预览"的文档,不可在线预览部分如存在完整性等问题,可反馈申请退款(可完整预览的文档不适用该条件!)。
- 3、如文档侵犯您的权益,请联系客服反馈,我们会尽快为您处理(人工客服工作时间:9:00-18:30)。
Technological progress causes E to grow at the rate g, and L grows at rate n so the number of workers L × E is growing at rate n + g. Now, the change in the capital stock per worker is: ∆k = i –(δ+n +g)k, where i is equal to s f(k). k sf(k) The Steady State (δ + n + g)k k Note: k = K/LE and y=Y/(L × Ε). So, y = f(k) is now different. Investment, Also, when the g term is added, k sf(k) gk is needed to provided capital to new “effective workers” created by technological progress. Capital per worker, k
Chapter Eight 10
The property of catch-up is called convergence. If there is not convergence, countries that start off poor are likely to remain poor. The Solow model makes predictions about when convergence should occur. According to the model, whether two economies will converge depends on why they differ in the first place (i.e., savings rates, population growth rates, and human capital accumulation).
Chapter Eight 3
To incorporate technological progress, the Production Function is now written as: Y = F (K, L × E) The term L × E measures the number of workers. This takes into account the number of workers L and the efficiency of each worker, E. It states that total output Y depends on capital K and workers L × E. The essence of this model is that increases in E (efficiency) are analogous to increases in L (number of workers). In other words, a single worker (if twice as productive) can be thought of as two workers. L × E doubles and the economy benefits from the increased production of goods and services.
Chapter Eight
9
According to the Solow model, technological progress causes the values of many variables to rise together in the steady state This property is called balanced growth. In the steady state, output per worker, Y/L, and capital stock per worker, K/L, both grow at rate g, which is the rate of technological progress. This is consistent with U.S. data in that g has been about 2 percent consistently over the past 50 years. Technological progress also affects factor prices. The real wage grows at the rate of technological progress, but the real rental price of capital remains constant over time. Again, over the last 50 years, the real wage has increased by 2 percent and has increased by about the same as real GDP. Yet, the real rental price of capital (real capital income divided by the capital stock) has been about the same.
0 0 g n+g
8
So far we have introduced technological progress into the Solow model to explain sustained growth in standards of living. Let’s now discuss what happens when theory meets facts.
Chapter Eight 2
To examine how a nation’s public policies can influence the level and growth of the citizens’ standard of living, we must ask five questions. 1) Should our society save more or less? 2) How can policy influence the rate of saving? 3) Are there some types of investment that policy should encourage? 4) What institutions ensure that the economy’s resources are put to their best use? 5) How can policy increase the rate of technological progress? The Solow model provides the theoretical framework within which we consider these issues.
5
Chapter Eight
k*
Important…
Labor-augmenting technological progress at rate g affects the Solow growth model in much the same way as did population growth at rate n. Now that k is defined as the amount of capital per effective worker, increases in the number of effective workers because of technological progress tend to decrease k. In the steady state, investment sf(k) exactly offsets the reductions in k because of depreciation, population growth, and technological progress.
Chapter Eight
6
Capital per effective worker is constant in the steady state. Because y = f(k), output per effective worker is also constant. But the efficiency of each actual worker is growing at rate g. So, output per worker, (Y/L = y × E) also grows at rate g. Total output Y = y × (E × L) grows at rate n + g.
®
CHAPTER 8 Economic Growth II
A PowerPoint Tutorial
™
To Accompany
MACROECONOMICS, 6th. ed.
N. Gregory Mankiw By
Chapter Eight
Mannig J. Simidian
1
The Solow model does not explain technological progress but, instead, takes it as given and shows how it interacts with other variables in the process of economic growth.