Prediction of particle deposition onto indoor surfaces by CFD with a modified Lagrangian method
无尘室落尘量测试流程

无尘室落尘量测试流程英文回答:To test the particle deposition in a cleanroom, there are several steps involved. First, it is important to prepare the cleanroom environment by ensuring that all surfaces are clean and free of any dust or contaminants. This can be done by thoroughly cleaning the room and using air filters to remove any airborne particles.Next, the testing equipment needs to be set up. This typically includes a particle counter, which is used to measure the number and size of particles in the air. The particle counter should be calibrated and properlypositioned in the cleanroom to ensure accurate measurements.Once the cleanroom is ready and the equipment is set up, the actual testing can begin. This involves running the particle counter for a specified period of time, typically several hours. During this time, the particle counter willcontinuously sample the air and record the number and size of particles present.After the testing period is complete, the datacollected by the particle counter needs to be analyzed. This involves examining the particle size distribution and determining the total particle count. The data can be compared to the cleanroom standards or specifications to evaluate the cleanliness level of the cleanroom.In addition to the particle count, it is also common to perform surface particle testing. This involves using adhesive tapes or swabs to collect particles from various surfaces within the cleanroom. The collected samples can then be analyzed under a microscope to determine the type and size of particles present.Overall, the process of testing particle deposition in a cleanroom involves preparing the environment, setting up the equipment, running the tests, analyzing the data, and performing surface particle testing. This helps ensure that the cleanroom meets the required cleanliness standards andhelps identify any potential sources of contamination.中文回答:为了测试无尘室的落尘量,需要进行一系列的步骤。
贝叶斯正则化Bayesian BP Regulation
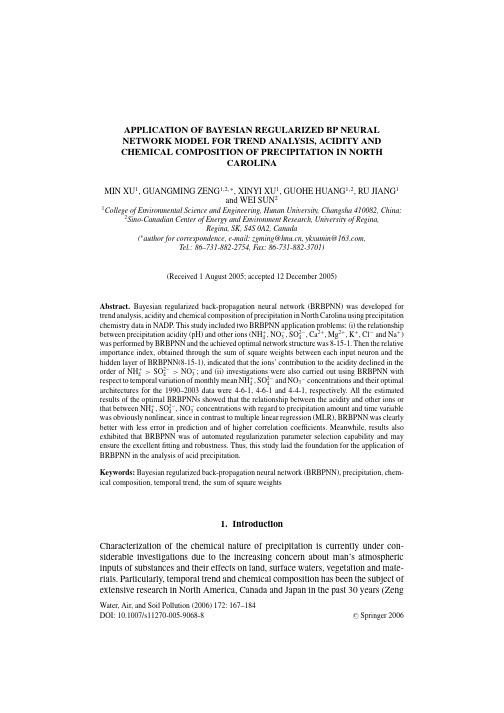
APPLICATION OF BAYESIAN REGULARIZED BP NEURALNETWORK MODEL FOR TREND ANALYSIS,ACIDITY ANDCHEMICAL COMPOSITION OF PRECIPITATION IN NORTHCAROLINAMIN XU1,GUANGMING ZENG1,2,∗,XINYI XU1,GUOHE HUANG1,2,RU JIANG1and WEI SUN21College of Environmental Science and Engineering,Hunan University,Changsha410082,China;2Sino-Canadian Center of Energy and Environment Research,University of Regina,Regina,SK,S4S0A2,Canada(∗author for correspondence,e-mail:zgming@,ykxumin@,Tel.:86–731-882-2754,Fax:86-731-882-3701)(Received1August2005;accepted12December2005)Abstract.Bayesian regularized back-propagation neural network(BRBPNN)was developed for trend analysis,acidity and chemical composition of precipitation in North Carolina using precipitation chemistry data in NADP.This study included two BRBPNN application problems:(i)the relationship between precipitation acidity(pH)and other ions(NH+4,NO−3,SO2−4,Ca2+,Mg2+,K+,Cl−and Na+) was performed by BRBPNN and the achieved optimal network structure was8-15-1.Then the relative importance index,obtained through the sum of square weights between each input neuron and the hidden layer of BRBPNN(8-15-1),indicated that the ions’contribution to the acidity declined in the order of NH+4>SO2−4>NO−3;and(ii)investigations were also carried out using BRBPNN with respect to temporal variation of monthly mean NH+4,SO2−4and NO3−concentrations and their optimal architectures for the1990–2003data were4-6-1,4-6-1and4-4-1,respectively.All the estimated results of the optimal BRBPNNs showed that the relationship between the acidity and other ions or that between NH+4,SO2−4,NO−3concentrations with regard to precipitation amount and time variable was obviously nonlinear,since in contrast to multiple linear regression(MLR),BRBPNN was clearly better with less error in prediction and of higher correlation coefficients.Meanwhile,results also exhibited that BRBPNN was of automated regularization parameter selection capability and may ensure the excellentfitting and robustness.Thus,this study laid the foundation for the application of BRBPNN in the analysis of acid precipitation.Keywords:Bayesian regularized back-propagation neural network(BRBPNN),precipitation,chem-ical composition,temporal trend,the sum of square weights1.IntroductionCharacterization of the chemical nature of precipitation is currently under con-siderable investigations due to the increasing concern about man’s atmospheric inputs of substances and their effects on land,surface waters,vegetation and mate-rials.Particularly,temporal trend and chemical composition has been the subject of extensive research in North America,Canada and Japan in the past30years(Zeng Water,Air,and Soil Pollution(2006)172:167–184DOI:10.1007/s11270-005-9068-8C Springer2006168MIN XU ET AL.and Flopke,1989;Khawaja and Husain,1990;Lim et al.,1991;Sinya et al.,2002; Grimm and Lynch,2005).Linear regression(LR)methods such as multiple linear regression(MLR)have been widely used to develop the model of temporal trend and chemical composition analysis in precipitation(Sinya et al.,2002;George,2003;Aherne and Farrell,2002; Christopher et al.,2005;Migliavacca et al.,2004;Yasushi et al.,2001).However, LR is an“ill-posed”problem in statistics and sometimes results in the instability of the models when trained with noisy data,besides the requirement of subjective decisions to be made on the part of the investigator as to the likely functional (e.g.nonlinear)relationships among variables(Burden and Winkler,1999;2000). On the other hand,recently,there has been increasing interest in estimating the uncertainties and nonlinearities associated with impact prediction of atmospheric deposition(Page et al.,2004).Besides precipitation amount,human activities,such as local and regional land cover and emission sources,the actual role each plays in determining the concentration at a given location is unknown and uncertain(Grimm and Lynch,2005).Therefore,it is of much significance that the model of temporal variation and precipitation chemistry is efficient,gives unambiguous models and doesn’t depend upon any subjective decisions about the relationships among ionic concentrations.In this study,we propose a Bayesian regularized back-propagation neural net-work(BRBPNN)to overcome MLR’s deficiencies and investigate nonlinearity and uncertainty in acid precipitation.The network is trained through Bayesian reg-ularized methods,a mathematical process which converts the regression into a well-behaved,“well-posed”problem.In contrast to MLR and traditional neural networks(NNs),BRBPNN has more performance when the relationship between variables is nonlinear(Sovan et al.,1996;Archontoula et al.,2003)and more ex-cellent generalizations because BRBPNN is of automated regularization parameter selection capability to obtain the optimal network architecture of posterior distri-bution and avoid over-fitting problem(Burden and Winkler,1999;2000).Thus,the main purpose of our paper is to apply BRBPNN method to modeling the nonlinear relationship between the acidity and chemical compositions of precipitation and improve the accuracy of monthly ionic concentration model used to provide pre-cipitation estimates.And both of them are helpful to predict precipitation variables and interpret mechanisms of acid precipitation.2.Theories and Methods2.1.T HEORY OF BAYESIAN REGULARIZED BP NEURAL NETWORK Traditional NN modeling was based on back-propagation that was created by gen-eralizing the Widrow-Hoff learning rule to multiple-layer networks and nonlinear differentiable transfer monly,a BPNN comprises three types ofAPPLICATION OF BAYESIAN REGULARIZED BP NEURAL NETWORK MODEL 169Hidden L ayerInput a 1=tansig(IW 1,1p +b 1 ) Output L ayer a 2=pu relin(LW 2,1a 1+b 2)Figure 1.Structure of the neural network used.R =number of elements in input vector;S =number of hidden neurons;p is a vector of R input elements.The network input to the transfer function tansig is n 1and the sum of the bias b 1.The network output to the transfer function purelin is n 2and the sum of the bias b 2.IW 1,1is input weight matrix and LW 2,1is layer weight matrix.a 1is the output of the hidden layer by tansig transfer function and y (a 2)is the network output.neuron layers:an input layer,one or several hidden layers and an output layer comprising one or several neurons.In most cases only one hidden layer is used (Figure 1)to limit the calculation time.Although BPNNs with biases,a sigmoid layer and a linear output layer are capable of approximating any function with a finite number of discontinuities (The MathWorks,),we se-lect tansig and pureline transfer functions of MATLAB to improve the efficiency (Burden and Winkler,1999;2000).Bayesian methods are the optimal methods for solving learning problems of neural network,which can automatically select the regularization parameters and integrates the properties of high convergent rate of traditional BPNN and prior information of Bayesian statistics (Burden and Winkler,1999;2000;Jouko and Aki,2001;Sun et al.,2005).To improve generalization ability of the network,the regularized training objective function F is denoted as:F =αE w +βE D (1)where E W is the sum of squared network weights,E D is the sum of squared net-work errors,αand βare objective function parameters (regularization parameters).Setting the correct values for the objective parameters is the main problem with im-plementing regularization and their relative size dictates the emphasis for training.Specially,in this study,the mean square errors (MSE)are chosen as a measure of the network training approximation.Set a desired neural network with a training data set D ={(p 1,t 1),(p 2,t 2),···,(p i ,t i ),···,(p n ,t n )},where p i is an input to the network,and t i is the corresponding target output.As each input is applied to the network,the network output is compared to the target.And the error is calculated as the difference between the target output and the network output.Then170MIN XU ET AL.we want to minimize the average of the sum of these errors(namely,MSE)through the iterative network training.MSE=1nni=1e(i)2=1nni=1(t(i)−a(i))2(2)where n is the number of sample set,e(i)is the error and a(i)is the network output.In the Bayesian framework the weights of the network are considered random variables and the posterior distribution of the weights can be updated according to Bayes’rule:P(w|D,α,β,M)=P(D|w,β,M)P(w|α,M)P(D|α,β,M)(3)where M is the particular neural network model used and w is the vector of net-work weights.P(w|α,M)is the prior density,which represents our knowledge of the weights before any data are collected.P(D|w,β,M)is the likelihood func-tion,which is the probability of the data occurring,given that the weights w. P(D|α,β,M)is a normalization factor,which guarantees that the total probability is1.Thus,we havePosterior=Likelihood×PriorEvidence(4)Likelyhood:A network with a specified architecture M and w can be viewed as making predictions about the target output as a function of input data in accordance with the probability distribution:P(D|w,β,M)=exp(−βE D)Z D(β)(5)where Z D(β)is the normalization factor:Z D(β)=(π/β)n/2(6) Prior:A prior probability is assigned to alternative network connection strengths w,written in the form:P(w|α,M)=exp(−αE w)Z w(α)(7)where Z w(α)is the normalization factor:Z w(α)=(π/α)K/2(8)APPLICATION OF BAYESIAN REGULARIZED BP NEURAL NETWORK MODEL171 Finally,the posterior probability of the network connections w is:P(w|D,α,β,M)=exp(−(αE w+βE D))Z F(α,β)=exp(−F(w))Z F(α,β)(9)Setting regularization parametersαandβ.The regularization parameters αandβdetermine the complexity of the model M.Now we apply Bayes’rule to optimize the objective function parametersαandβ.Here,we haveP(α,β|D,M)=P(D|α,β,M)P(α,β|M)P(D|M)(10)If we assume a uniform prior density P(α,β|M)for the regularization parame-tersαandβ,then maximizing the posterior is achieved by maximizing the likelihood function P(D|α,β,M).We also notice that the likelihood function P(D|α,β,M) on the right side of Equation(10)is the normalization factor for Equation(3). According to Foresee and Hagan(1997),we have:P(D|α,β,M)=P(D|w,β,M)P(w|α,M)P(w|D,α,β,M)=Z F(α,β)Z w(α)Z D(β)(11)In Equation(11),the only unknown part is Z F(α,β).Since the objective function has the shape of a quadratic in a small area surrounding the minimum point,we can expand F(w)around the minimum point of the posterior density w MP,where the gradient is zero.Solving for the normalizing constant yields:Z F(α,β)=(2π)K/2det−1/2(H)exp(−F(w MP))(12) where H is the Hessian matrix of the objective function.H=β∇2E D+α∇2E w(13) Substituting Equation(12)into Equation(11),we canfind the optimal values for αandβ,at the minimum point by taking the derivative with respect to each of the log of Equation(11)and set them equal to zero,we have:αMP=γ2E w(w MP)andβMP=n−γ2E D(w MP)(14)whereγ=K−αMP trace−1(H MP)is the number of effective parameters;n is the number of sample set and K is the total number of parameters in the network. The number of effective parameters is a measure of how many parameters in the network are effectively used in reducing the error function.It can range from zero to K.After training,we need to do the following checks:(i)Ifγis very close to172MIN XU ET AL.K,the network may be not large enough to properly represent the true function.In this case,we simply add more hidden neurons and retrain the network to make a larger network.If the larger network has the samefinalγ,then the smaller network was large enough;and(ii)if the network is sufficiently large,then a second larger network will achieve comparable values forγ.The Bayesian optimization of the regularization parameters requires the com-putation of the Hessian matrix of the objective function F(w)at the minimum point w MP.To overcome this problem,the Gauss-Newton approximation to Hessian ma-trix has been proposed by Foresee and Hagan(1997).Here are the steps required for Bayesian optimization of the regularization parameters:(i)Initializeα,βand the weights.After thefirst training step,the objective function parameters will recover from the initial setting;(ii)Take one step of the Levenberg-Marquardt algorithm to minimize the objective function F(w);(iii)Computeγusing the Gauss-Newton approximation to Hessian matrix in the Levenberg-Marquardt training algorithm; (iv)Compute new estimates for the objective function parametersαandβ;And(v) now iterate steps ii through iv until convergence.2.2.W EIGHT CALCULATION OF THE NETWORKGenerally,one of the difficult research topics of BRBPNN model is how to obtain effective information from a neural network.To a certain extent,the network weight and bias can reflect the complex nonlinear relationships between input variables and output variable.When the output layer only involves one neuron,the influences of input variables on output variable are directly presented in the influences of input parameters upon the network.Simultaneously,in case of the connection along the paths from the input layer to the hidden layer and along the paths from the hidden layer to the output layer,it is attempted to study how input variables react to the hidden layer,which can be considered as the impacts of input variables on output variable.According to Joseph et al.(2003),the relative importance of individual input variable upon output variable can be expressed as:I=Sj=1ABS(w ji)Numi=1Sj=1ABS(w ji)(15)where w ji is the connection weight from i input neuron to j hidden neuron,ABS is an absolute function,Num,S are the number of input variables and hidden neurons, respectively.2.3.M ULTIPLE LINEAR REGRESSIONThis study attempts to ascertain whether BRBPNN are preferred to MLR models widely used in the past for temporal variation of acid precipitation(Buishand et al.,APPLICATION OF BAYESIAN REGULARIZED BP NEURAL NETWORK MODEL173 1988;Dana and Easter,1987;MAP3S/RAINE,1982).MLR employs the following regression model:Y i=a0+a cos(2πi/12−φ)+bi+cP i+e i i=1,2,...12N(16) where N represents the number of years in the time series.In this case,Y i is the natural logarithm of the monthly mean concentration(mg/L)in precipitation for the i th month.The term a0represents the intercept.P i represents the natural logarithm of the precipitation amount(ml)for the i th month.The term bi,where i(month) goes from1to12N,represents the monotonic trend in concentration in precipitation over time.To facilitate the estimation of the coefficients a0,a,b,c andφfollowing Buishand et al.(1988)and John et al.(2000),the reparameterized MLR model was established and thefinal form of Equation(16)becomes:Y i=a0+αcos(2πi/12)+βsin(2πi/12)+bi+cP i+e i i=1,2,...12N(17)whereα=a cosϕandβ=a sinϕ.a0,α,β,b and c of the regression coefficients in Equation(17)are estimated using ordinary least squares method.2.4.D ATA SET SELECTIONPrecipitation chemistry data used are derived from NADP(the National At-mospheric Deposition Program),a nationwide precipitation collection network founded in1978.Monthly precipitation information of nine species(pH,NH+4, NO−3,SO2−4,Ca2+,Mg2+,K+,Cl−and Na+)and precipitation amount in1990–2003are collected in Clinton Crops Research Station(NC35),North Carolina, rmation on the data validation can be found at the NADP website: .The BRBPNN advantages are that they are able to produce models that are robust and well matched to the data.At the end of training,a Bayesian regularized neural network has the optimal generalization qualities and thus there is no need for a test set(MacKay,1992;1995).Husmeier et al.(1999)has also shown theoretically and by example that in a Bayesian regularized neural network,the training and test set performance do not differ significantly.Thus,this study needn’t select the test set and only the training set problem remains.i.Training set of BRBPNN between precipitation acidity and other ions With regard to the relationship between precipitation acidity and other ions,the input neurons are taken from monthly concentrations of NH+4,NO−3,SO2−4,Ca2+, Mg2+,K+,Cl−and Na+.And precipitation acidity(pH)is regarded as the output of the network.174MIN XU ET AL.ii.Training set of BRBPNN for temporal trend analysisBased on the weight calculations of BRBPNN between precipitation acidity and other ions,this study will simulate temporal trend of three main ions using BRBPNN and MLR,respectively.In Equation(17)of MLR,we allow a0,α,β,b and c for the estimated coefficients and i,P i,cos(2πi/12),and sin(2πi/12)for the independent variables.To try to achieve satisfactoryfitting results of BRBPNN model,we similarly employ four unknown items(i,P i,cos(2πi/12),and sin(2πi/12))as the input neurons of BRBPNN,the availability of which will be proved in the following. 2.5.S OFTWARE AND METHODMLR is carried out through SPSS11.0software.BRBPNN is debugged in neural network toolbox of MATLAB6.5for the algorithm described in Section2.1.Concretely,the BRBPNN algorithm is implemented through“trainbr”network training function in MATLAB toolbox,which updates the weight and bias according to Levenberg-Marquardt optimization.The function minimizes both squared errors and weights,provides the number of network parameters being effectively used by the network,and then determines the correct combination so as to produce a network that generalizes well.The training is stopped if the maximum number of epochs is reached,the performance has been minimized to a suitable small goal, or the performance gradient falls below a suitable target.Each of these targets and goals is set at the default values by MATLAB implementation if we don’t want to set them artificially.To eliminate the guesswork required in determining the optimum network size,the training should be carried out many times to ensure convergence.3.Results and Discussions3.1.C ORRELATION COEFfiCIENTS OF PRECIPITATION IONSFrom Table I it shows the correlation coefficients for the ion components and precipitation amount in NC35,which illustrates that the acidity of precipitation results from the integrative interactions of anions and cations and mainly depends upon four species,i.e.SO2−4,NO−3,Ca2+and NH+4.Especially,pH is strongly correlated with SO2−4and NO−3and their correlation coefficients are−0.708and −0.629,respectively.In addition,it can be found that all the ionic species have a negative correlation with precipitation amount,which accords with the theory thatthe higher the precipitation amount,the lower the ionic concentration(Li,1999).3.2.R ELATIONSHIP BETWEEN PH AND CHEMICAL COMPOSITIONS3.2.1.BRBPNN Structure and RobustnessFor the BRBPNN of the relationship between pH and chemical compositions,the number of input neurons is determined based on that of the selected input variables,APPLICATION OF BAYESIAN REGULARIZED BP NEURAL NETWORK MODEL175TABLE ICorrelation coefficients of precipitation ionsPrecipitation Ions Ca2+Mg2+K+Na+NH+4NO−3Cl−SO2−4pH amountCa2+ 1.0000.4620.5480.3490.4490.6270.3490.654−0.342−0.369Mg2+ 1.0000.3810.9800.0510.1320.9800.1230.006−0.303K+ 1.0000.3200.2480.2260.3270.316−0.024−0.237Na+ 1.000−0.0310.0210.9920.0210.074−0.272NH+4 1.0000.7330.0110.610−0.106−0.140NO−3 1.0000.0500.912−0.629−0.258Cl− 1.0000.0490.075−0.265SO2−4 1.000−0.708−0.245pH 1.0000.132 Precipitation 1.000 amountcomprising eight ions of NH+4,NO−3,SO2−4,Ca2+,Mg2+,K+,Cl−and Na+,and the output neuron only includes pH.Generally,the number of hidden neurons for traditional BPNN is roughly estimated through investigating the effects of the repeatedly trained network.But,BRBPNN can automatically search the optimal network parameters in posterior distribution(MacKay,1992;Foresee and Hagan, 1997).Based on the algorithm of Section2.1and Section2.5,the“trainbr”network training function is used to implement BRBPNNs with a tansig hidden layer and a pureline output layer.To acquire the optimal architecture,the BRBPNNs are trained independently20times to eliminate spurious effects caused by the random set of initial weights and the network training is stopped when the maximum number of repetitions reaches3000epochs.Add the number of hidden neurons(S)from1to 20and retrain BRBPNNs until the network performance(the number of effective parameters,MSE,E w and E D,etc.)remains approximately the same.In order to determine the optimal BRBPNN structure,Figure2summarizes the results for training many different networks of the8-S-1architecture for the relationship between pH and chemical constituents of precipitation.It describes MSE and the number of effective parameters changes along with the number of hidden neurons(S).When S is less than15,the number of effective parameters becomes bigger and MSE becomes smaller with the increase of S.But it is noted that when S is larger than15,MSE and the number of effective parameters is roughly constant with any network.This is the minimum number of hidden neurons required to properly represent the true function.From Figure2,the number of hidden neurons (S)can increase until20but MSE and the number of effective parameters are still roughly equal to those in the case of the network with15hidden neurons,which suggests that BRBPNN is robust.Therefore,using BPBRNN technique,we can determine the optimal size8-15-1of neural network.176MIN XU ET AL.Figure2.Changes of optimal BRBPNNs along with the number of hidden neurons.parison of calculations between BRBPNN(8-15-1)and MLR.3.2.2.Prediction Results ComparisonFigure3illustrates the output response of the BRBPNN(8-15-1)with a quite goodfit.Obviously,the calculations of BRBPNN(8-15-1)have much higher correlationcoefficient(R2=0.968)and more concentrated near the isoline than those of MLR. In contrast to the previous relationships between the acidity and other ions by MLR,most of average regression R2achieves less than0.769(Yu et al.,1998;Baez et al.,1997;Li,1999).Additionally,Figures2and3show that any BRBPNN of8-S-1architecture hasbetter approximating qualities.Even if S is equal to1,MSE of BRBPNN(8-1-1)ismuch smaller and superior than that of MLR.Thus,we can judge that there havebeen strong nonlinear relationships between the acidity and other ion concentration,which can’t be explained by MLR,and that it may be quite reasonable to apply aAPPLICATION OF BAYESIAN REGULARIZED BP NEURAL NETWORK MODEL177TABLE IISum of square weights(SSW)and the relative importance(I)from input neurons to hidden layer Ca2+Mg2+K+Na+NH+4NO−3Cl−SO2−4 SSW 2.9589 2.7575 1.74170.880510.4063 4.0828 1.3771 5.2050 I(%)10.069.38 5.92 2.9935.3813.88 4.6817.70neural network methodology to interpret nonlinear mechanisms between the acidity and other input variables.3.2.3.Weight Interpretation for the Acidity of PrecipitationTo interpret the weight of the optimal BRBPNN(8-15-1),Equation(15)is used to evaluate the significance of individual input variable and the calculations are illustrated in Table II.In the eight inputs of BRBPNN(8-15-1),comparatively, NH+4,SO2−4,NO−3,Ca2+and Mg2+have greater impacts upon the network and also indicates thesefive factors are of more significance for the acidity.From Table II it shows that NH+4contributes by far the most(35.38%)to the acidity prediction, while SO2−4and NO−3contribute with17.70%and13.88%,respectively.On the other hand,Ca2+and Mg2+contribute10.06%and9.38%,respectively.3.3.T EMPORAL TREND ANALYSIS3.3.1.Determination of BRBPNN StructureUniversally,there have always been lowfitting results in the analysis of temporal trend estimation in precipitation.For example,the regression R2of NH+4and NO−3 for Vhesapeake Bay Watershed in Grimma and Lynch(2005)are0.3148and0.4940; and the R2of SO2−4,NH+4and NO−3for Japan in Sinya et al.(2002)are0.4205, 0.4323and0.4519,respectively.This study also applies BRBPNN to estimate temporal trend of precipitation chemistry.According to the weight results,we select NH+4,SO2−4and NO−3to predict temporal trends using BRBPNN.Four unknown items(i,P i,cos(2πi/12),and sin(2πi/12))in Equation(17)are assumed as input neurons of BRBPNNs.Spe-cially,two periods(i.e.1990–1996and1990–2003)of input variables for NH+4 temporal trend using BRBPNN are selected to compare with the past MLR results of NH+4trend analysis in1990–1996(John et al.,2000).Similar to Figure2with training20times and3000epochs of the maximum number of repetitions,Figure4summarizes the results for training many different networks of the4-S-1architecture to approximate temporal variation for three ions and shows the process of MSE and the number of effective parameters along with the number of hidden neurons(S).It has been found that MSE and the number of effective parameters converge and stabilize when S of any network gradually increases.For the1990–2003data,when the number of hidden neurons(S)can178MIN XU ET AL.Figure4.Changes of optimal BRBPNNs along with the number of hidden neurons for different ions.∗a:the period of1990–2003;b:the period of1990–1996.increase until10,we canfind the minimum number of hidden neurons required to properly represent the accurate function and achieve satisfactory results are at least 6,6and4for trend analysis of NH+4,SO2−4and NO−3,respectively.Thus,the best BRBPNN structures of NH+4,SO2−4and NO−3are4-6-1,4-6-1,4-4-1,respectively. Additionally for NH+4data in1990–1996,the optimal one is BRBPNN(4-10-1), which differs from BRBPNN(4-6-1)of the1990–2003data and also indicates that the optimal BRBPNN architecture would change when different data are inputted.parison between BRBPNN and MLRFigure5–8summarize the comparison results of the trend analysis for different ions using BRBPNN and MLR,respectively.In particular,for Figure5,John et al. (2000)examines the R2of NH+4through MLR Equation(17)is just0.530for the 1990–1996data in NC35.But if BRBPNN method is utilized to train the same1990–1996data,R2can reach0.760.This explains that it is indispensable to consider the characteristics of nonlinearity in the NH+4trend analysis,which can make up the insufficiencies of MLR to some extent.Figure6–8demonstrate the pervasive feasibility and applicability of BRBPNN model in the temporal trend analysis of NH+4,SO2−4and NO−3,which reflects nonlinear properties and is much more precise than MLR.3.3.3.Temporal Trend PredictionUsing the above optimal BRBPNNs of ion components,we can obtain the optimal prediction results of ionic temporal trend.Figure9–12illustrate the typical seasonal cycle of monthly NH+4,SO2−4and NO−3concentrations in NC35,in agreement with the trend of John et al.(2000).APPLICATION OF BAYESIAN REGULARIZED BP NEURAL NETWORK MODEL179parison of NH+4calculations between BRBPNN(4-10-1)and MLR in1990–1996.parison of NH+4calculations between BRBPNN(4-6-1)and MLR in1990–2003.parison of SO2−4calculations between BRBPNN(4-6-1)and MLR in1990–2003.Based on Figure9,the estimated increase of NH+4concentration in precipita-tion for the1990–1996data corresponds to the annual increase of approximately 11.12%,which is slightly higher than9.5%obtained by MLR of John et al.(2000). Here,we can confirm that the results of BRBPNN are more reasonable and im-personal because BRBPNN considers nonlinear characteristics.In contrast with180MIN XU ET AL.parison of NO−3calculations between BRBPNN(4-4-1)and MLR in1990–2003Figure9.Temporal trend in the natural log(logNH+4)of NH+4concentration in1990–1996.∗Dots (o)represent monitoring values.The solid and dashed lines respectively represent predicted values and estimated trend given by BRBPNN method.Figure10.Temporal trend in the natural log(logNH+4)of NH+4concentration in1990–2003.∗Dots (o)represent monitoring values.The solid and dashed lines respectively represent predicted values and estimated trend given by BRBPNN method.。
气象学【英文】

Disperse based on meteorological & topographic conditions Concentration --- usually stagnant conditions Dispersion
Topological conditions
Affected by presence of large buildings
Meteorological conditions prevailing wind speed & direction
Pollutants disperse over geographic area Any location receives pollutants from different sources in different amounts Need to understand how pollutants disperse to predict concentrations and predict violations at a particular location
Transport
Pollutants moved from source May undergo physical and chemical changes
Smog – interaction of NOx, HC, and solar energy Ozone formation
Concentration & Dispersion
Dispersion
General mean air motion Turbulent velocity fluctuations Diffusion due to concentration gradients – from plumes Aerodynamic characteristics of pollution particles
油气田产出水系统碳酸钙结垢预测

油气田产出水系统碳酸钙结垢预测牛鲁娜;蒋秀;郭龙江;屈定荣【摘要】结合热力学和动力学影响因素,综合考虑碳酸钙结垢的结晶、沉积和剥蚀过程,建立了油气田产出水系统中碳酸钙结垢的预测模型,运用编制的软件对某气田产出水井筒进行了碳酸钙结垢预测,选取靠近井口、井筒中部和井底的三个典型部位进行了室内模拟结垢实验和饱和指数法结垢趋势预测.结果表明,井筒结垢量随着井深增加而增大,在一定时间后达到垢物附着与脱落的动态平衡状态,软件模型预测法与实验测试结垢趋势相吻合,能够较好地预测油气田产出水的碳酸钙结垢,对产出水系统防垢除垢具有指导意义.【期刊名称】《安全、健康和环境》【年(卷),期】2018(018)005【总页数】5页(P11-15)【关键词】油气田;产出水;碳酸钙;结垢预测;动力学【作者】牛鲁娜;蒋秀;郭龙江;屈定荣【作者单位】中国石化青岛安全工程研究院,山东青岛266071;中国石化青岛安全工程研究院,山东青岛266071;中国石油大学(华东),山东青岛266000;中国石化青岛安全工程研究院,山东青岛266071【正文语种】中文水力压裂技术是油气田开采中广泛使用的技术,压裂完成后返排到地面的液体包括返排液和采出水。
随着返排时间的延长,尤其是在产出水阶段,由于与地层接触时间长,体系中的金属离子含量增高,可能出现结垢的风险。
结垢对油层、井筒、地面管线和设备都会造成严重的损害,极大影响正常生产和经济效益。
油气田最常见的水垢是碳酸钙垢,为了降低油气田产出水系统结垢的危害、合理指导企业防垢清垢工作,对碳酸钙结垢进行有效预测非常必要[1,2]。
碳酸钙结垢预测技术,主要有化学计算预测法[3-7]、实验预测法和软件预测法[8]三种。
化学计算法主要基于热力学模型进行结垢趋势预测,常进行假设忽略某些因素的影响,易造成预测结果偏差;实验预测法利用挂片的增重或成垢离子的质量浓度变化来判断结垢类型和计算沉淀量,工作量大,适用范围有限;软件预测法大多是将标准方法利用编程工具软件化,使用成本高。
不同尺寸管道中细颗粒的沉积运动规律研究
摘要:研究不同尺寸管道中颗粒物的运动沉积情况,对于采用合理管道,以减少管道中的颗粒物具有重
要价值。利用流体分析软件模拟不同尺寸管道内水介质中细颗粒物的沉积运动规律,得出管道尺寸对
细颗粒物沉积运动的影响。结果表明:流体在管道中流动的过程中,壁面附近的流体流速低于管道内部
流体流速,壁面附近的压力高于管道内部;流体在管道运动过程中,逐渐发展完全,压力与流速在后半段
第39卷第5期 2019年]0月
核科学与工程 Nuclear Science and Engineering
Vol. 39 No. 5 Oct. 2019
不同尺寸管道中细颗粒的沉积运动规律研究
朱亮宇周涛1,2,3,* ,秦雪猛1,2,3, 丁锡嘉1,2,3,张家磊1,2,3
(1.华北电力大学核科学与工程学院,北京102206;2.华北电力大学核热工安全与标准化研究所,北京102206; 3.华北电力大学非能动核能安全技术北京市重点实验室,北京102206)
(1. School of Nuclear Science and Engineering, North China Electric Power University, Beijing, 102206, China; 2. Institute o£ Nuclear Thermal-hydraulic Safety and Standardization.» North China Electric Power University, Beijing, 102206, China;
文章标志码:A
文章编号:0258-0918(2019)05-0695-06
Study on sedimentation movement of fine particles in pipelines of different sizes
拜耳水性分散体资料

– High viscosity of prepolymer requires co-solvent 高粘的预聚 物需用溶剂
– Use of aromatic di-isocyanates 不可用芳香族的异氰酸脂 – Limit on neutralizing amines 中和用的氨基试剂有限 – Reproducibility 重复性差
– 完全反应的聚氨酯聚合物分散在水相中; – 不含活性的-OH基和-NCO基; – 成膜机理不是由于-OH基和-NCO基的反应固化,而是由
于水和助溶剂的挥发,聚合物微粒聚结成膜。
水介质中的离散颗粒 Discrete Particles in Aqueous Media
基片上颗粒沉积 Deposition of Particles on Substrate
Hexamethylene Diisocyanate
Prepolymer Mixing Methods 预聚物混合法
2n HO
CH3
OH + n HOCH2C CH2OH + 4n OCN R NCO CO2 H
O
O
O
CH3 O
O
O
OCN R NHCO OCNH R NHCO CH2C CH2OCNH R NHCO OCNH R NCO
反应速率:胺 > 醇/水 > 酸 Reaction rates: amine > alcohol / water > acid
Components of a PUD 成份
• Isocyanates 异氰酸脂 • Polyols and glycols 多醇 • Amine chain extenders 氨基链增长剂 • Hydrophilic groups 亲水基团 • Neutralizers 中和剂
(asce)0733-9372(2007)133_3(331)
基于微米级颗粒临界沉积
化工进展Chemical Industry and Engineering Progress2023 年第 42 卷第 12 期基于微米级颗粒临界沉积/剥离标准的研究进展邵宏勋,谢俊,桂玉双,李润东(沈阳航空航天大学能源与环境学院,辽宁 沈阳110136)摘要:基于气固两相流动的微颗粒沉积一直是一个棘手的问题,作为一种常见的物理现象,带来的影响更多是负面的,如砂粒导致涡轮叶片的磨损,飞灰颗粒引起锅炉换热面结垢腐蚀等一系列问题。
尽管吹灰方案的不断优化已经很大程度减少了飞灰沉积带来的负面影响,但仍有一些不可控或意外的问题存在。
因此,归纳分析颗粒黏附行为规律对工程颗粒沉积的抑制具有重要意义。
本文以锅炉飞灰沉积为主要背景,阐述了以惯性撞击为主导机制的颗粒黏附机理与特性,回顾了近年来对临界沉积标准的研究工作,重点剖析了沉积因素对颗粒黏附/反弹判据标准的影响,总结了颗粒剥离的主要判断准则,通过横向对比相关判据存在的问题与联系,说明了颗粒黏附判据标准的研究现状与存在的问题,为实现锅炉沉积的有效抑制及颗粒剥离理论的推广提供技术理论支撑。
关键词:微米颗粒;沉积模型;临界捕集速度;恢复系数;临界剪切速度中图分类号:TK-9;TQ021 文献标志码:A 文章编号:1000-6613(2023)12-6141-16Research progress of critical deposition/stripping standards based onmicron-sized particlesSHAO Hongxun ,XIE Jun ,GUI Yushuang ,LI Rundong(College of Energy and Environment, Shenyang Aerospace University, Shenyang 110136, Liaoning, China)Abstract: It is a thorny problem for micro-particle deposition based on gas-solid flow. Particle deposition is a common physical phenomenon but with more negative impact, such as the wear of turbine blades caused by sand particles, scale corrosion caused by fly ash particles on boiler heat exchange surface and so on. Although the continuous optimization of soot blowing scheme has greatly reduced the negative impact of fly ash deposition, there are still some uncontrollable problems. Therefore, it is of great significance to summarize and analyze the law of particle adhesion behavior to suppress particle deposition in engineering. Based on the main background of boiler fly ash deposition, this paper expounded the mechanism and characteristics of particle adhesion dominated by inertial impact, reviewed the research work on critical deposition criteria in recent years, focused on the analysis of the influence of deposition factors on the criteria of particle adhesion/rebound, and summarized the main criteria of particle detachment. By comparing the problems and connections of relevant criteria horizontally, the research status and existing problems of particle adhesion criteria was explained, which provided technical and theoretical support for the effective suppression of boiler deposition and the promotion of particle detachment theory.综述与专论DOI :10.16085/j.issn.1000-6613.2023-0084收稿日期:2023-01-17;修改稿日期:2023-03-13。
血流剪切力在动脉粥样硬化中所起的作用
血流剪切力在动脉粥样硬化中所起的作用动脉粥样硬化(atherosclerosis,AS)是严重威胁人类身体健康的疾病,临床资料表明,动脉粥样硬化好发于动脉开口、分叉和弯曲的部位,说明血流动力学在动脉粥样硬化的形成过程中起了重要作用。
多项研究表明,不合适的血流剪切力会通过一系列的机制影响血管内皮细胞重构、增殖及凋亡,促进单核/巨噬细胞游走至血管弹力层,形成平滑肌细胞并病理性增殖,促进低密度脂蛋白(LDL)在血管内皮的沉积等等,从而在动脉粥样硬化的发生、发展及演变中起了极其重要的作用。
[Abstract]Atherosclerosis is a dangerous disease to human being. Clinical data show that atherosclerosis is inclined to dwell on the opening position,bifurcate and curve parts of the artery,which indicates that hematodynamics plays an important role in the process of atherosclerosis. Thousands of researches have revealed that the unsuitable blood flow shear stress can influence vascular endothelial cell reconstruction,generation and apoptosis as well,hasten monocaryon/macrophage migrating to the elastic layer of artery to form smooth muscle cells with pathological proliferation and then promote the deposition of the low-density lipoprotein(LDL) in vascular endothelium,which plays an extremely important role in the formation,development and evolution of atherosclerosis.[Key words]Atherosclerosis; Blood flow shearing force; Gene; Inflammation.动脉粥样硬化(atherosclerosis,AS)是严重威胁人类身体健康的疾病,其发生与高血压病、高胆固醇血症、吸烟、糖尿病等密切相关。
北大考研-工学院研究生导师简介-李喜青
爱考机构-北大考研-工学院研究生导师简介-李喜青李喜青所受教育(EDUCATION)05/02–12/05博士(环境工程),UniversityofUtah论文:胶体在多孔介质中的迁移-实验和理论的比较09/94–07/97硕士(辐射化学),中国科学技术大学论文:利用国家同步辐射实验室200MeV直线加速器研究光致核反应09/89–07/94学士(应用化学),中国科学技术大学论文:磷系织物阻燃剂的合成与研究工作经历(WORKEXPERIENCE)09/06至今特聘研究员北京大学工学院,环境学院(合聘)02/06–08/06访问助理教授(VisitingAssistantProfessor) DepartmentofEarthandAtmosphericSciences,CityCollegeofNewYork05/02–02/06研究助理(ResearchAssistant) DepartmentofGeologyandGeophysics,UniversityofUtah08/01–05/02助教(TeachingAssistant)DepartmentofChemistry,UniversityofUtah08/00–07/01销售与服务工程师CitivigorLimited,HongKong03/00–05/00业务票夹部副经理MediyangGroup,Changshu,Jiangsu10/97–02/00技术翻译,助理调试协调员,技术部员工AsiaPacificPaperProductsCo.Ltd.(现芬欧汇川(常熟)纸业有限公司)所加入学术团体(PREFESSIONALAFFILIATIONS)AmericanChemicalSociety,USA AmericanGeologicalUnion,USANationalGroundWaterAssociation,USA SocietyofEnvironmentalToxicologyandChemistry研究方向胶体在多孔介质中迁移的机理胶体对污染物在地下环境中迁移的促进持久性污染物在环境中的手性行为在中国推广河岸过滤的可行性分析期刊论文(JOURNALPUBLICATIONS)Li,X.,Yang,L.,Jans,U.,Melcer,M.,Zhang,P.,2006,Lackofenantioselectivedegradationofchlordanein LongIslandSoundsediment,Environ.Sci.Technol.,inrevision.Johnson,W.P.,Li,X.,Yal,G.,2006,Colloidretentioninporousmedia:mechanisticsimulationsofwedging andretentioninzonesofflowstagnation,acceptedtoEnviron.Sci.Technol..Johnson,W.P.,Li,X.,andAssemi,S.,2006,Depositionandre-entrainmentdynamicsofmicrobesandnon-biologicalcolloidsduringnon-perturbedtransportinporousmediainthepresenceofanenergybarriertode position,acceptedtoAdvancesinWaterResources.Li,X.,Lin,C.L.,Miller,J.D.,Johnson,W.P.,2006,Roleofgraintograincontactsonprofilesofretainedcollo idsinporousmediainthepresenceofanenergybarriertodeposition,Environ.Sci.Technol.,3762-3768. Li,X.,Lin,C.L.,Miller,J.D.,Johnson,W.P.,2006,Pore-scaleobservationofmicrospheredepositionatgrai ntograincontactsoverassemblage-scaleporousmediadomainsusingx-raymicrotomography,Environ.S ci.Technol.,3769-3774.Johnson,W.P.,Li,X.,2005,Commenton“Breakdownofcolloidfiltrationtheory:roleofthesecondaryenergyminimumandsurfacechargehetero geneities”,Langmuir,21,10895-10895.Li,X.,Zhang,P.,Lin,C.L.,Johnson,W.P.,2005,Roleofhydrodynamicdragonmicrospheredepositionand re-entrainmentinporousmediaunderunfavorabledepositionconditions,Environ.Sci.Technol.,39(11),4 012-4020.Li,X.,andJohnson,W.P.,2005,Non-monotonicvariationsinremovalratecoefficientsofmicrospheresinp orousmediaunderunfavorabledepositionconditions,Environ.Sci.Technol.,39(6);1658-1665. Tong,M.,Li,X.,Brow,C.,Johnson.W.P.,2005,Detachment-influencedtransportofanadhesion-deficient bacterialstrainwithinwater-reactiveporousmedia,Environ.Sci.Technol.39(8),2500-2508. Johnson.W.P.,Li,X.,Tong,M.,2005,Colloidretentionbehaviorinenvironmentalporousmediachallenge sexistingtheory,Eos,86(18),May3,2005.Brow,C.,Li,X.,Ricka,J.,Johnson,W.P.,2005,Comparisonofmicrospheredepositioninporousmediaver sussimpleshearsystems,ColloidsSurf.A:Physicochem.Eng.Aspects,253(1),125-136.Li,X.,Scheibe,T.D.,andJohnson,W.P.,2004,Apparentdecreasesincolloiddepositionratecoefficientswi thdistanceoftransportunderunfavorabledepositionconditions:ageneralphenomenon,Environ.Sci.Tec hnol.38,5616-5625.会议报告(CONFERENCEPRESENTATIONS)Li,X.,Yang,L.,Jans,U.,Melcer,M.,Zhang,P.,2006,Concentrationsandchiralsignaturesoforganochlori nepesticidesinLongIslandSoundsediments,SocietyofEnvironmentalToxicologyandChemistryAsia/ PacificConference,Beijing,P.R,ChinaJohnson,W.P.,Li,X.,YalG.,2006,Directobservationsand3-Dmechanisticsimulationsofcolloiddepositi oninporousmediainthepresenceofanenergybarrier:theinfluenceofgraintograincontacts,80thACSColl oidandSurfaceScienceSymposium,Denver,Colorado.Li,X.,Johnson,W.P.,C.L.Lin,ler,2006,Directobservationofparticledepositionatgrain-grainc ontactsinporousmediausingx-raymicrotomography,FifthWorldCongressonParticleTechnology,Orla ndo,Florida.Li,X.,Johnson,W.P.,C.L.Lin,ler,2005,Directobservationofcolloiddepositionatgrain-grainc ontactsusingx-raymicrotomography,2005GSAAnnualMeeting,SaltLakeCity,Utah.Li,X.,Johnson,W.P.,C.L.Lin,ler,2005,Directobservationofmicrospheredepositionatgrain-g raincontactsusingx-raymicrotomography,TheJointInternationalSymposiumforSubsurfaceMicrobiol ogy(ISSM2005)andEnvironmentalBiogeochemistry(ISEBXVII),JacksonHole,Wyoming.Li,X.,Johnson,W.P.,C.L.Lin,ler,2005,Directobservationofdepositionatgrain-graincontacts usingx-raymicrotomography,79thACSColloidandSurfaceScienceSymposium,Potsdam,NewYork. Johnson,W.P.,Li,X.,Tong,M.,Assemi,S.,2005Depositionandre-entrainmentdynamicsofmicrobesand non-biologicalcolloidsduringnon-perturbedTransportinporousmediainthepresenceofanenergybarrie rtodeposition,79thACSColloidandSurfaceScienceSymposium,Potsdam,NewYork.Li,X.,Johnson,W.P.,C.L.Lin,2005,DirectobservationofparticlestrainingusingX-raymicrotomograph y,229thAmericanChemicalSocietyNationalMeeting,SanDiego,California.Li,X.,Tong,M.,Brow,C.,Johnson,W.P.,2004,Colloidtransportinporousmedia:deviationfromtheoryist henorm,nottheexception,AmericanGeologicalUnion2004FallMeeting,SanFrancisco,California. Li,X.,Johnson,W.P.,2004,Distance-dependentremovalofmicrospheresinglassbeadsandmasscenterm ovementofremovedmicrosphereswithshortelutiontimeinquartzsand,78thACSColloidandSurfaceSci enceSymposium,NewHaven,Connecticut.Li,X.,Johnson,W.P.,2004,Possiblemechanismsofre-entrainmentofmicrospheresinporousmediaunde rnon-perturbedconditions,78thACSColloidandSurfaceScienceSymposium,NewHaven,Connecticut .Zhang,P.,Li,X.,Johnson,W.P.,2003,Roleofhydrodynamicshearincolloidattachmentanddetachmentdu ringtransportinporousmedia,225thAmericanChemicalSocietyNationalMeeting,NewOrleans,Louisi ana.Johnson,W.P.,Li,X.,Tong,M.,andScheibe,T.D.,2003,DistributedAttachmentRates:CommontoBiolo gicalandNon-BiologicalColloids,225thAmericanChemicalSocietyNationalMeeting,NewOrleans,L ouisiana.联系方式逸夫二楼3656,北京大学,100871电话:010-6275-3246,传真:010-6275-1938,E-mail:">。
- 1、下载文档前请自行甄别文档内容的完整性,平台不提供额外的编辑、内容补充、找答案等附加服务。
- 2、"仅部分预览"的文档,不可在线预览部分如存在完整性等问题,可反馈申请退款(可完整预览的文档不适用该条件!)。
- 3、如文档侵犯您的权益,请联系客服反馈,我们会尽快为您处理(人工客服工作时间:9:00-18:30)。
Prediction of Particle Deposition onto Indoor Surfaces by CFD with aModified Lagrangian MethodZ. ZHANG a, Q. CHEN a* a National Air Transportation Center of Excellence for Research in the Intermodal Transport Environment (RITE), School of Mechanical Engineering, Purdue University, 585 Purdue Mall, West Lafayette, IN 47907-2088, USAAbstract: Accurate prediction of particle deposition indoors is important to estimate exposure risk of building occupants to particulate matter. The prediction requires accurate modeling of airflow, turbulence, and interactions between particles and eddies close to indoor surfaces. This study used a 2′−v f turbulence model with a modified Lagrangian method to predict the particle deposition in enclosed environments. The 2′−v f model can accurately calculate the normal turbulence fluctuation 2′v , which mainly represents the anisotropy of turbulence near walls. Based on the predicted 2′v , we proposed an anisotropic particle-eddy interaction model for the prediction of particle deposition by the Lagrangian method. The model performance was assessed by comparing the computed particle deposition onto differently oriented surfaces with the experimental data in a turbulent channel flow and in a naturally convected cavity available from the literature. The predicted particle deposition velocities agreed reasonably with the experimental data for different sizes of particles ranging from 0.01μm to 50μm in diameter. This study concluded that the Lagrangian method can predict indoor particle deposition with reasonable accuracy provided the near-wall turbulence and its interactions with particles are correctly modeled.Keywords: Particle deposition, Lagrangian method, CFD, v2f, indoor environment1. IntroductionScientific studies discovered significant association between the particle pollution and people’s mortality and morbidity (Pope, 2000; Long et al., 2000). A recent research found that the chance of lung cancer death increased by 8% for every 10 μg/m 3 increase of long-term fine particle exposure in the ambient air (Pope et al., 2002). Since people spend more than 90% of their time indoors and particle concentration indoors is often higher than that outdoors (He et al., 2005), exposure to indoor particulate matter (PM) can be a major threat to our health. Good understanding of the indoor particle exposure is thus necessary and important.Particle deposition onto indoor surfaces can greatly alter the indoor particle exposure level. According to Nazaroff (2004), particle deposition removes 10 μm particles 10 times and 2.5 μm * Corresponding author. Tel.: +765 496 7562; E-mail address: yanchen@Zhang, Z. and Chen, Q. 2009. “Prediction of particle deposition onto indoor surfaces by CFD with a modified Lagrangian method,” Atmospheric Environment , 43(2), 319-328.particles 1 time as much as the ventilation does, for typical indoor environments with one air exchange rate per hour. So the accurate modeling of particle deposition is crucial in predicting the actual PM exposure level in an indoor environment.In general, there are two methods studying the particle deposition: experimental investigations and numerical simulations. Experimental investigations provide accurate indoor particle deposition data, such as those summarized by Lai (2002) and conducted more recently by Bouilly et al. (2005) and Lai and Nazaroff (2005). Although those measured deposition rates vary with particle sizes in a similar trend, they can differ by one to two orders of magnitude between different experiments. The large variations in measurements indicate that factors other than particle size also influence the particle deposition rates. Those factors can be the airflow pattern, turbulence level, and properties of indoor surfaces, etc. However, it is often very difficult to measure and report all those crucial information in experiment. So those measurements may not be comparable, and the interpretation of the large variations on deposition rates can be difficult.Alternatively, the numerical modeling approach can accurately control most of those important factors, making the comparison and interpretation between numerical results viable and meaningful. However, to develop an accurate particle deposition model is very challenging, which requires accurate modeling of airflow, turbulence, and particle-eddy interactions. Commonly used airflow and particle models may not be adequate. For example, Tian and Ahmadi (2007) compared different model predictions of particle depositions in channel flows. The predicted particle deposition velocities, based on the popular k-ε model, were higher than the measured data by one to four orders of magnitude for particles ranging 0.01 to 10 μm in diameters. Such errors in deposition predictions can have a major impact on the prediction accuracy of PM exposure indoors. Therefore, to develop an accurate particle deposition model along with appropriate airflow model is necessary.In this paper, we propose a numerical model for accurate prediction of particle deposition in indoor environments. The model is validated and evaluated by quality experimental data in the literature, and is used to analyze indoor particle deposition characteristics.2. Research methods2.1 Brief review of modeling methods of predicting indoor particle depositionThere are two modeling methods in predicting particle deposition: the Eulerian and Lagrangian methods. The Eulerian method treats particles as continuum and correlates particle deposition to airflow properties inside the concentration boundary layer. The airflow properties are input parameters of the deposition model and can be obtained analytically by assuming ideal airflow conditions and by fitting with experimental data. For example, Lai and Nazaroff (2000) developed an indoor particle deposition model that represents the state-of-the-art of such Eulerian method. By presuming an airflow parameter (i.e., the friction velocity) their model prediction agreed reasonably well with the experimental data by Cheng et al. (1997). However, the model prediction was less satisfactory in predicting particle deposition in another enclosed environment (Lai and Nazaroff, 2005). Such Eulerian deposition model is semi-empirical, andrelies on the assumptions of the flow features inside the boundary layer. Due to the complexity of the indoor airflow, those assumptions could fail, and the performance and robustness of the Eulerian method can be affected.Alternatively, the Lagrangian method tracks each particle directly based on the predicted airflow field by computational fluid dynamics (CFD), and avoids presuming flow conditions inside the boundary layer. However, the performance of the Lagrangian method is very sensitive to the accuracy of the predicted mean flow and turbulence, particularly near walls. The strict requirement on near-wall flow and turbulence modeling challenges the modeling capacity of many Reynolds-averaged-Navier-Stokes (RANS) models (Zhao et al., 2004; Zhang and Chen, 2006).Effective near-wall treatment for the Lagrangian method is therefore necessary to the accurate prediction of particle deposition. Li and Ahmadi (1992) developed a near-wall model using DNS analysis of simple flows to quantify the wall-normal turbulent fluctuation within the viscous layer near a wall. Tian and Ahmadi (2007) successfully applied the near-wall model with a Reynolds stress model (RSM) to predict particle depositions in channel flows. Lai and Chen (2007) adopted a similar method with the RNG k-ε turbulence model to predict indoor particle dispersion and deposition. The Lagrangian prediction of deposition fractions agreed with their Eulerian simulations. However, the deposition prediction was not further validated experimentally due to the lack of directly measured deposition data. Bouilly et al. (2005) conducted both Lagrangian simulations and experimental measurements of particle deposition rates in an indoor environment. They used large eddy simulation to predict the airflow and turbulence. The predicted deposition rates of coarse particles (5 μm and 10 μm in diameters) agreed well with their measured data. Measured deposition rates for finer particles were reported, but no corresponding numerical results were provided. They indicated that further validation, especially for finer particles, was still necessary. More efforts need to be made in developing an accurate Lagrangian particle deposition model for both fine and coarse particles for indoor environments. This requires both suitable airflow and particle-eddy interaction models.2.2 Modeling of airflow and turbulence features by CFDAccurate prediction of airflow and turbulence is crucial to the success of modeling the particle deposition onto surfaces (Tian and Ahmadi, 2007). Zhai et al. (2007) and Zhang et al. (2007) evaluated a large variety of turbulence models in predicting airflow and turbulence in enclosed environments. These models covered a wide range of CFD approaches including RANS, detached eddy simulation, and large eddy simulation. Among these models, a modified 2′−v f model (Lien and Kalitzin 2001; Davidson et al. 2003) had the best accuracy in predicting the mean flow and the turbulence. This study thus applied the 2′−v f model (hereafter v2f-dav model) in predicting the airflows. The model formulation has the general form:j ,eff j j j u S t x x x φφ⎡⎤∂φ∂φ∂∂φρ+ρ−Γ=⎢⎥∂∂∂∂⎢⎥⎣⎦, (1)where φ represents independent flow variables, ,eff φΓ the effective diffusion coefficient, S φ thesource term of an equation, and the over bars denote the Reynolds averaging. Table 1summarizes the mathematical form of each transport equation of the v2f-dav model. In Table 1, u i is the velocity component in i direction, T air temperature, k the kinetic energy of turbulence, ε the dissipation rate of turbulent kinetic energy, 2v ′ the wall-normal turbulence fluctuation, p air pressure, H air enthalpy, μt eddy viscosity, G φ the turbulence production for φ, S the rate of the strain, and f is a part of the 2v ′source term that accounts for the non-local blocking effect near walls. Note that the T in 2v ′and f equations represents the turbulence time scale.The modeled 2v ′ is different from the normal component of the Reynolds stress vector in y direction. It is only a scalar that behaves similar to the wall-normal Reynolds stress close to walls due to the mathematical treatment in the turbulence model (Durbin and Pettersson Reif, 2001). The forms of the transport equations and their associated boundary conditions assure 2v ′ of correct near-wall features. The appropriate boundary conditions of the turbulence variables at wall are as follows:22k k v f 0,2,y′===ε=νΔ (2)Where Δy is the wall distance.2.3 Modeling of particle motion by the Lagrangian methodThe Lagrangian method tracks particles by solving the following equations based on the predicted airflow field:()()()i p p,i D p i p,i i L,i Th,i pg du C Re 1u u n t F F dt 24ρ−ρ=−++++τρ, (3)The left hand side of the equation represents the inertial force per unit mass (m/s 2), where p,i u is the particle velocity component in i direction. The first term on the right hand side is the drag term, where τ is the particle relaxation time, C D the drag coefficient, Re p the Reynolds number based on the particle diameter, particle velocity, and air velocity. The second term represents the gravity and buoyancy, where ρ and ρp are the density of the air and particles, respectively. The ()i n t , L,i F and Th,i F are the Brownian force, the shear induced lift force, and the thermophoretic force on a unit mass basis, respectively.The drag coefficient for a spherical particle was calculated according to Hinds (1982):()p p D 0.687p p p24Re 1;Re C 2410.15Re 1Re 400.Re ⎧<⎪⎪=⎨⎪+≤<⎪⎩ (4)In general, the drag force is the dominant force on particles while the other forces can become important depending on the particle size and flow conditions. So these forces are included and modeled as follows:2.5i p n (t)d −=ζ, (5))()1/2ij i p,i 1L,i p p lk kl d u u F 5.188d d d −νρ−=⋅ρ, (6)()2s p t -2Th,i p p m p t i -36μC k/k C Kn 1T F d ρρ(13C Kn)(12k/k 2C Kn)T x +∂=⋅+++∂, (7)where, ζ is a Gaussian random number with zero mean and unit variance, σ is the Stefan-Boltzmann constant, Δt is the time step for particle tracking, d ij is the rate of deformation tensor, k and k p are conduction coefficient of fluid and particle, and Kn is the Knudsen number. More detailed information of those forces is available in the FLUENT reference manual (FLUENT, 2005).2.4 Modeling the turbulent dispersion of particles and the particle-eddy interactions near wallsParticle turbulent dispersion is associated with the instantaneous flow fluctuations and is an important mechanism of particle deposition. When particles are in the turbulent core and the turbulence is assumed to be isotropic, the discrete random walk model (DRW) can be used to model the particle turbulent dispersion. The isotropic DRW model correlates the instantaneousi u'ζ= (8)where i u' is the modeled fluctuation velocity in i direction, ζ is a Gaussian random number with zero mean and unit variance. The sum of the i u'and the mean velocity i u was used as the instantaneous air velocity u i in equations (3) and (6).Previous studies have confirmed that the isotropic DRW model is effective and accurate in modeling particle dispersion and distribution in various flows (Gosman and Ioannides, 1981; Lai and Chen, 2007; Zhang and Chen, 2007). However, directly applying the isotropic DRW model with a RANS model (e.g. standard k-ε model) can lead to significant over prediction of particle deposition rate. This is because RANS models with simple wall treatment cannot predict the extremely anisotropic turbulence near wall. The turbulence fluctuation perpendicular to wall is damped out significantly faster than that in other directions close to a surface. Since the v2f-dav model directly predicted the wall-normal fluctuation 2′v near wall, this investigation used the 2′v profile to modify the isotropic DRW model. The modified DRW model accounted for the anisotropic particle-eddy interactions near wall, and can be expressed as:u'ζu'ζ⊥==&; Lim y y ++≤i u'ζζ==; otherwise(9)where the subscripts ⊥ and & denotes the spatial coordinates normal and parallel to a wall, and Lim y +sets the upper bound of the anisotropic region.The generated instantaneous fluctuations by equation (9) remained unchanged for a particle trajectory within a time that is the minimum of the eddy life time and the time needed for the particle to cross the eddy (FLUENT, 2005).2.5 Calculation of the particle deposition velocity from Lagrangian trajectoriesThe particle deposition velocity measures the rate of the deposition process and is given as:d J V C ∞=, (10)where J is the deposition flux onto a surface defined as the number of particles deposited per unit time and unit area of the surface, and C ∞ represents the mean particle concentration.The study used two schemes to derive V d according to two different Lagrangian tracking strategies. For the first tracking strategy, particles are initially uniformly distributed in a domain and are released simultaneously. Each trajectory represents the path line of a single particle. When the trajectory hits the wall at time t, it indicates one particle deposits at that time as shown in Figure 1(a). The particle deposition velocity onto a surface can be estimated by counting the number of deposited trajectories in a time period:()d d N /t A V N /V⋅= (11)where N d is the number of trajectories deposited within time period t, A is the area of the surface, N is the time averaged number of particles in the space, and V is the volume of the space. Zhang and Ahmadi (2000) successfully applied such scheme in simulating particle deposition in channel flows.For the second tracking strategy, particles are released simultaneously from a point source. Each trajectory represents a strike line and carries certain flow rate of particles. When the trajectory hits the wall at time t, succeeding particles will hit at the same location on the wall after time t as illustrated in Figure 1(b). So the particle deposition flux J can be estimated as:()n dep imax i i 1max M t t J t A =−=∑ (12)where n is the number of trajectories, iM is the particle number flow rate carried by each trajectory i, dep i t is the time at which trajectory i deposits, and t max is the maximum computing time for each particle. t max was set to be identical for all trajectories. If a particle has not yet deposited at the end of the computation, dep i t =t max . The averaged particle concentration at time t max can be estimated accordingly as:n dep i i i 1M t C V=∞=∑ (13)Therefore, the particle deposition velocity can be also expressed as:()n dep maxi i 1d n depmax i i 1t t V V t A t==−=∑∑ (14)The second tracking strategy is in accord with the experiments that release particles continuously during measurements (e.g., Thatcher et al., 1996) while the first strategy simulates the conditions that particles are premixed and particle concentration continues to decay during measurements (e.g., Bouilly et al., 2005). In the present study, we used both deposition calculation schemes to correspond to the tracking strategies and associated experimental conditions.2.6 Numerical proceduresThis study used commercial CFD software, FLUENT (version 6.2) to predict both air motion and particle deposition. The numerical procedure for the flow simulation was identical to that used by Zhang et al. (2007), and was not repeated here. For the particle simulations, the isotropic DRW model is not compatible with the anisotropic near-wall treatment as state in equation (9). The near-wall treatment was implemented into an anisotropic DRW model associated with a Reynolds stressmodel (RSM) by using user-defined functions. The anisotropic DRW model can be expressed as:i u'ζ= (15)where i i u'u' is the normal Reynolds stress component in i direction.Hence, we used the v2f-dav model in predicting the airflow and adopted the RSM affiliated Lagrangian method to predict particle dispersion and deposition. Final status of each trajectory including its deposition time and position was recorded to calculate the particle deposition velocities using additional user-defined functions.3. Results and discussionThis investigation first validated the deposition model in an isothermal turbulent channel flow because of quality experimental data available in the literature. The validated model was then applied to study particle deposition onto surfaces of different orientations in a naturally convected cavity. The experimental data by Thatcher et al. (1996) had superior quality and was used to further analyze and evaluate the model performance.3.1 Predicting particle deposition in a channel flowFigure 2(a) shows the geometry of the channel with 0.02m in width and 0.4m in length. The Reynolds number based on the mean flow and the channel width was 6667. Figures 2(b) and 2(c) show the computational grid distribution. The first grid centroid was 0.05 mm above the wall,which corresponded to about y+ = 1. The computational domain and the flow conditions were in accord with those designed by Tian and Ahmadi (2007) in order to further compare with their simulations.Figure 3 shows the comparison of predicted flow profiles at X=0.3m downstream by the v2f-dav model and the DNS results by Kim et al. (1987). The predictions of the v2f-dav model agreed well with the DNS results in both the mean flow and its turbulence statistics. As a reference, this study also included the prediction of turbulence by the RNG k-ε model and by the quadratic function used by Tian and Ahmadi (2007). The RNG k-ε model predicted the correct k profile but not the 2′v profile due to the isotropic assumption used. The quadratic function was only accurate in the viscous sublayer within y+ < 4 above the wall.For particle simulations, the study tracked particles of 26 different sizes between 0.01μm and 50μm in diameters. The density of all particles is 2450 kg/m3. For each particle size, 30,000 particles were initially uniformly distributed within y+ < 30 above the lower wall. Initial particle velocities were identical to the ambient airflow. Particle deposition velocities were calculated according to equation (11). An ensemble of 30,000 trajectories ensured sufficient statistical confidence of the predicted deposition velocities. Figure 4 shows the comparison of predicted results and experimental data from the literature collected by Sippola (2002). The deposition velocity and the particle relaxation time were normalized by the friction velocity u* and the u/ν. Numerical predictions by Tian and Ahmadi (2007) were marked as turbulence time scale *2grey lines, which were only approximate readings from their work for general comparison. One should refer to original paper for accurate data. Nevertheless, it is clear that particle deposition velocity can be dramatically over predicted based on RANS models without accurate prediction of the wall-normal fluctuation near walls. Because the v2f-dav model and the quadratic correction presented correct near-wall turbulent structures, both methods well predicted deposition velocities for particles of various sizes. The comparison confirmed that it is important to predict accurately the near-wall turbulence in order to correctly model the particle deposition by the Lagrangian method.Comparison of Figures 4 (a) and (b) shows the impact of gravity on deposition for particles of different sizes. When particles are small with the dimensionless relaxation time less than 10-2, gravity does not have visible impact on the particle deposition. The downward gravitational settling becomes increasingly important for coarser particles, and the surface orientation greatly alters the deposition characteristics. Since an indoor environment consists of surfaces of different orientations, it is important that the particle model can accurately predict particle deposition onto differently oriented surfaces.Although the deposition model with v2f-dav proposed here and that with the RSM model by Tian and Ahmadi (2007) are both accurate in turbulent channel flows, their computing costs are different. In fact, Zhang et al. (2007) reported that a RSM model requires about 2-4 times computing time compared with the v2f-dav model, while the RSM model could experience convergence difficulties in complicated indoor environments. Meanwhile, the v2f-dav model has better accuracy than the RSM model tested by Zhang et al. (2007) in different flow scenarios. Therefore, the particle deposition model based on the v2f-dav model is potentially suitable for indoor environmental studies and was further tested.3.2 Predicting particle deposition onto differently oriented surfaces in a naturally convected cavityThe particle model was validated in the previous section in an isothermal channel flow. Since the flow features in channel is simple and well understood, it is not surprising that the CFD simulations could reasonably predict the deposition behaviors. In contrast, the thermo-fluid conditions in indoor environments are more complicated and case dependent. The present case studied is to further test the model performance in predicting particle deposition onto differently oriented surfaces in a naturally convected indoor environment. Figure 5 presents the general information of the experimental chamber constructed by Thatcher et al. (1996). It is a cubic cavity with a vertical wall and the floor heated and with the ceiling and another wall cooled. The temperature differential between heated and cooled surfaces is 20 K while the front and back surfaces are well insulated and adiabatic. The Rayleigh number was about 4×10⁹, similar to that of a typical full sized room with the wall-to-air temperature difference of ±1.25K. The whole experimental chamber was carefully designed and controlled so that the surface temperature was uniform even at the corners. The thermal boundary conditions formed a counter-clockwise airflow in the cavity.In the particle deposition experiment, highly mono-dispersed spherical particles were released from the cavity center. Overall particle concentration in the chamber was monitored and deposited particles onto four non-adiabatic surfaces were collected and analyzed to calculate the deposition velocity. Thatcher et al. (1996) measured particle deposition velocities in five different sizes including 0.1μm, 0.5μm, 0.7μm, 1.3μm, and 2.5μm in diameters. All particles were solid ammonium fluorescein particles with a density of 1350 kg/m3. Experiments were repeated for each particle size to ensure the statistical confidence of the experimental results. The airflow simulation used boundary conditions in accord with the experiments. The computational domain was two-dimensional, containing 60×60 computing cells with refined mesh near all surfaces to capture the near-wall turbulence. The first grid point was 1 mm above the surfaces corresponding to y+ = 0.5 to 1. Predicted mean airflow pattern is shown in Figure 5, and the turbulence in Figure 6. The strongest turbulence occurred in the lower-left and upper-right corners due to the confrontations of air streams with high temperature differential. The strong turbulence at corners partially explained that the measured particle deposition velocities were higher at these corners than at other regions in the experiment.Further validation of the airflow and temperature distribution is difficult as the experimental study did not provide very detailed flow information. However, the performance of the v2f-dav model in the naturally convected space is reliable according to the recent study by Zhang et al. (2007). Then this investigation applied the Lagrangian method to predict the particle dispersion and deposition. The anisotropic near-wall treatment as stated in equation (9) were applied to y+ < 60 region above the walls. The particle sizes studied were 0.1μm, 0.2μm, 0.3μm, 0.4μm, 0.5μm, 0.7μm, 1.3μm, 2.2μm, and 2.5μm in diameters, respectively, and 10,000 trajectories were tracked for each particle size. This study used a constant time step of Δt=10-3 (s) and tracked totally 2×10⁵ time steps for each trajectory. The deposition velocities in the present case were calculated according to equation (14).Figure 7 compares the predicted and measured particle deposition velocities onto different surfaces. As a reference, the simulated results without considering Brownian force were also presented. In general, the predictions with and without the Brownian force are similar. Both the predictions agreed reasonably well with the measured data on all the surfaces while some differences still exist.As shown in Figure 7(c), the predicted deposition rate without considering the Brownian force reduced to zero for particles smaller than 0.4μm, which deviated from the measured data. In contrast, the Brownian force did not significantly alter the deposition rates on other surfaces for particles coarser than 0.1μm as shown in Figures 7 (a), (b) and (d). According to Li and Ahmadi (1992), the Brownian force was only significant in the deposition process for particles smaller than 0.05μm in diameter. The Brownian force above the floor is not expected to be comparable with the drag force for particles larger than 0.1 μm in diameter. Therefore, the significance of the Brownian force in particle deposition onto the floor is likely associated with some unique flow features that only occurred near the floor.Figure 8(a) illustrates the difference of the flow structures near the heated floor. The mean wall-normal velocity above the floor was pointing upwards within at least 10mm above the floor. This was due to the upward buoyancy effect near the heated floor. The upward velocity led to upward drag to particles near the floor. For small particles whose gravity is negligible, the Brownian force became the only important force that can create downward motion and can deposit on the floor. Without considering the Brownian force, small particles are unlikely to deposit onto the floor. In contrast, the wall-normal velocity near the heated vertical wall was pointing towards the surface as shown in Figure 8(b). A particle could thus deposit to the wall due to the dominant wall-pointing drag force. The same theory could be applied to the cooled ceiling and wall. The near-wall drag force, rather than the Brownian force, determined the deposition rates for small particles on these surfaces.The study also studied the importance of the thermophoretic force and the lift force in the deposition process. For the particles of 0.1-2.5 μm in diameters, the predicted deposition velocities onto all surfaces did not alter significantly by excluding either the thermophoretic or the lift force.Meanwhile, the present numerical model predicted significant deposition on the warm wall for super micron particles. This finding agreed with the experimental data but not with the semi-empirical Eulerian model by Nazaroff and Cass (1989), which would predict a low deposition rate. Thatcher et al. (1996) reported that the high flow instability led to high particle deposition rates in their measurements. In addition, our analysis showed that the wall-pointing airflow near the warm wall was also an important factor to the high particle deposition velocities. With such a complex flow in indoor environment, the accuracy of the semi-empirical Eulerian model can be affected. The Lagrangian method can have a better performance in predicting particle deposition. Although the predicted particle depositions agreed in general with the measured data, the numerical results remarkably over-predicted the particle deposition velocities onto the warm wall for particles smaller than 0.7 μm. The error is likely attributed to the profile of wall-normal。