Matlab的gui界面设计实例练习
利用Matlab的图形用户界面(GUI)功能,设计并实现实验主界面

(1)利用Matlab的图形用户界面(GUI)功能,设计并实现实验主界面;(2) 实现在“符号计算”图形用户界面中的各项符号计算功能,如实现Matlab的求极限、求导、求不定积分与定积分、级数求和、方程组的符号求解、常微分方程的符号求解等符号计算;(3) 利用Matlab的二维、三维绘图功能,实现图形用户界面(GUI)中的部分符号计算的可视化,即给出符号计算实例的同时实现该实例的图形化描述。
如下图给出了一个简单的GUI界面,学生可以参考如下图设计出自己的GUI界面。
程序如下:hf=figure('Position',[200,200,700,500],...'Name','信计08(2)班阿卜杜热黑木20080803417', ...'NumberTitle','off','MenuBar','none');uicontrol(hf,'Style','Frame','Position',[0,0.15,0.45,1],...'Units','normalized','Back',[0,1,1]);COMM1=['n=str2num(get(he1,''String''));', ...%求导连接'b=sym(get(he7,''String''));',...'dec=diff(b,n);', ...'set(he8,''string'',char(dec));'];COMM2=['a=str2num(get(he2,''String''));', ...%求极限连接'f=sym(get(he7,''String''));',...'lim=limit(f,a);', ...'set(he8,''string'',char(lim));'];COMM3=['g=sym(get(he7,''String''));',... %不定积分连接'int_1=int(g);', ...'set(he8,''string'',char(int_1));'];COMM4=['a=str2num(get(he3,''String''));', ... %级数求和连接'b=str2num(get(he5,''String''));', ...'f=sym(get(he7,''String''));',...'sum_1=symsum(f,a,b);', ...'set(he8,''string'',char(sum_1));'];COMM5=['a=str2num(get(he4,''String''));', ... %定积分连接'b=str2num(get(he6,''String''));', ...'f=sym(get(he7,''String''));',...'int_2=int(f,a,b);', ...'set(he8,''string'',char(int_2));'];COMM6=['f=get(he7,''String'');',...'dsolve_1=dsolve(f,''x'');', ...'set(he8,''string'',char(dsolve_1));'];COMM7=['f=get(he7,''String'');',...'ezplot(f);'];COMM8=['g=get(he8,''String'');',...'ezplot(g);'];uicontrol(hf,'Style','Push','Position',[0.02,0.9,0.11,0.06],...'String','求导','Units','normalized','Call',COMM1); uicontrol(hf,'Style','Text','Position',[0.17,0.85,0.08,0.1],...'Units','normalized','Horizontal','center',...'String','阶数','Back',[0,1,1]);he1=uicontrol(hf,'Style','Edit','Position',[0.25,0.9,0.15,0.06],...'Units','normalized','Back',[0,1,0]);uicontrol(hf,'Style','Push','Position',[0.02,0.72,0.13,0.06],...'String','求极限','Units','normalized','Call',COMM2);uicontrol(hf,'Style','Text','Position',[0.17,0.67,0.08,0.1],...'Units','normalized','Horizontal','center',...'String','极限点','Back',[0,1,1]);he2=uicontrol(hf,'Style','Edit','Position',[0.25,0.72,0.15,0.06],...'Units','normalized','Back',[0,1,0]);uicontrol(hf,'Style','Push','Position',[0.02,0.58,0.13,0.06],...'String','不定积分','Units','normalized','Call',COMM3);uicontrol(hf,'Style','Push','Position',[0.02,0.45,0.13,0.06],...'String','级数求和','Units','normalized','Call',COMM4);uicontrol(hf,'Style','Text','Position',[0.31,0.44,0.06,0.06],...'Units','normalized','Horizontal','center',...'String','上限','Back',[0,1,1]);he5=uicontrol(hf,'Style','Edit','Position',[0.38,0.45,0.06,0.06],...'Units','normalized','Back',[0,1,0]);uicontrol(hf,'Style','Text','Position',[0.17,0.44,0.06,0.06],...'Units','normalized','Horizontal','center',...'String','下限','Back',[0,1,1]);he3=uicontrol(hf,'Style','Edit','Position',[0.24,0.45,0.06,0.06],...'Units','normalized','Back',[0,1,0]);uicontrol(hf,'Style','Push','Position',[0.02,0.32,0.13,0.06],...'String','求定积分','Units','normalized','Call',COMM5);uicontrol(hf,'Style','Text','Position',[0.31,0.31,0.06,0.06],...'Units','normalized','Horizontal','center',...'String','上限','Back',[0,1,1]);he6=uicontrol(hf,'Style','Edit','Position',[0.38,0.32,0.06,0.06],...'Units','normalized','Back',[0,1,0]);uicontrol(hf,'Style','Text','Position',[0.17,0.3,0.08,0.06],...'Units','normalized','Horizontal','center',...'String','下限','Back',[0,1,1]);he4=uicontrol(hf,'Style','Edit','Position',[0.24,0.32,0.06,0.06],...'Units','normalized','Back',[0,1,0]);uicontrol(hf,'Style','Push','Position',[0.02,0.2,0.16,0.06],...'String','解微分方程','Units','normalized','Call',COMM6);uicontrol(hf,'Style','text','Position',[0.48,0.9,0.13,0.06],...'String','原函数','Units','normalized');he7=uicontrol(hf,'Style','edit','Position',[0.65,0.9,0.30,0.06],...'String','','Units','normalized','Back',[0,1,0]);uicontrol(hf,'Style','text','Position',[0.48,0.77,0.13,0.06],...'String','结果函数','Units','normalized');he8=uicontrol(hf,'Style','text','Position',[0.65,0.77,0.30,0.06],...'String','','Units','normalized','Back',[0,1,0]);h_axes=axes('position',[0.55,0.2,0.4,0.5]);uicontrol(hf,'Style','push','Position',[0.58,0.02,0.13,0.06],...'String','初始绘图','Units','normalized','call',COMM7);uicontrol(hf,'Style','push','Position',[0.80,0.02,0.13,0.06],...'String','结果绘图','Units','normalized','call',COMM8);uicontrol(hf,'Style','Push','Position',[0.02,0.02,0.08,0.06],...'String','退出','Units','normalized','Call', 'close');。
最新Matlab的gui界面设计实例练习资料

一个不错的Matlab的gui界面设计实例%非常漂亮的日历,function CalendarTable;% calendar 日历% Example:% CalendarTable;S=datestr(now);[y,m,d]=datevec(S);% d is day% m is month% y is yearDD={'Sun','Mon','Tue','Wed','Thu','Fri','Sat'};close allfigure;for k=1:7;uicontrol(gcf,'style','text',...'unit','normalized','position',[0.02+k*0.1,0.55,0.08,0.06],...'BackgroundColor',0.6*[1,1,1],'ForegroundColor','b',...'String',DD(k),'fontsize',16,'fontname','times new roman');endh=1;ss='b';qq=eomday(y,m);for k=1:qq;n=datenum(y,m,k);[da,w] = weekday(n);if k==d;ss='r';enduicontrol(gcf,'style','push',...'unit','normalized','position',[0.02+da*0.1,0.55-h*0.08,0.08,0.06] ,...'BackgroundColor',0.6*[1,1,1],'ForegroundColor',ss,...'String',num2str(k));ss='b';if da==7;h=h+1;endenduicontrol(gcf,'style','push',...'unit','normalized','position',[0.6,0.66,0.12,0.08],...'BackgroundColor',0.6*[1,1,1],'ForegroundColor',ss,...'String','clock','fontsize',18,'fontname','times new roman');Tq=uicontrol(gcf,'style','push',...'unit','normalized','position',[0.74,0.66,0.17,0.08],...'BackgroundColor',0.6*[1,1,1],'ForegroundColor',[0.1,0.9,0.9],...'fontsize',18,'fontname','times new roman');sq='The calendar';uicontrol(gcf,'style','push',...'unit','normalized','position',[0.14,0.86,0.37,0.08],...'BackgroundColor',0.6*[1,1,1],'ForegroundColor',[0.1,0.9,0.9],...'fontsize',18,'fontname','times new roman','string',sq);trywhile 1set(Tq,'String',datestr(now,13));pause(1);endend计算万年历的Matlab程序(2008-12-21 13:59:19)标签:matlab万年历杂谈分类:Matlab实例function test_calendar(year,month)% 输入年份,月份,打印这个月的月历run = 0;ping = 0;fprintf('\n%s %s %s %s %s %s %s\n',...'日','一','二','三','四','五','六');% 计算从第一年到前一年的闰年和平年的个数for i =1:year-1if (mod(i,4)==0 & mod(i,100)~=0) | mod(i,400)==0run = run+1;elseping = ping+1;endend% 计算从第一年到当年前一个月的天数sum = 366*run+365*ping;for i = 1:month-1sum = sum+monthday(year,i);end% 获得这个月的天数n = monthday(year,month);temp = zeros(n,1);sum = sum+1;% 计算这个月第一天是星期几wkd = mod(sum,7);for i = 1:ntemp(wkd+i) = i;endl = 1;m = 1;% 打印日历for i = 1:length(temp)if temp(i) ==0temp2(l,m) = ' ';fprintf(' ');m = m+1;elsetemp2(l,m) = temp(i);if temp(i) >= 10fprintf('%d ',temp(i));elsefprintf('%d ',temp(i));endm = m+1;endif mod(i,7)==0fprintf('\n');m = 1;l = l+1;endendfprintf('\n');% 闰年和平年每月的天数function out = monthday(year,i)if mod(year,4)==0 & mod(year,100)~=0 | mod(year,400)==0 data = [31 29 31 30 31 30 31 31 30 31 30 31]; elsedata = [31 28 31 30 31 30 31 31 30 31 30 31]; endout = data(i);举例:输入:>> test_calendar(2008,12)返回:日一二三四五六1 2 3 4 5 67 8 9 10 11 12 1314 15 16 17 18 19 2021 22 23 24 25 26 2728 29 30 31闲来无事,学了一些Matlab GUI的基础知识,想找个东西练一下手。
matlab练习(创建GUI)
matlab练习(创建GUI)matlab创建GUI⽅法1:使⽤GUIDE菜单式操作在matlab中输⼊guide,可以打开guide创建GUI的图形界⾯,按菜单操作即可注:matlab未来版本可能会取消掉这种⽅式⽅法2:编写代码创建GUI下⾯是⼀个简单的以代码⽅式创建GUI的例⼦,其中关键的⼀些点包括1. 创建⼀个figure object作为container2. 通过`uicontrol`创建container内的控件,通过`'Callback'`属性关联回调函数3. 回调函数参数⼀般是由两部分组成`(source,eventdata,handles)`,分别表⽰引起回调产⽣的控件的handle和(点击)事件的数据function simple_gui2% SIMPLE_GUI2 Select a data set from the pop-up menu, then% click one of the plot-type push buttons. Clicking the button% plots the selected data in the axes.% Create and then hide the UI as it is being constructed.f = figure('Visible','off','Position',[360,200,450,285]);% Construct the components.hsurf = uicontrol('Style','pushbutton','String','Surf',...'Position',[315,220,70,25],...'Callback',{@surfbutton_Callback});hmesh = uicontrol('Style','pushbutton',...'String','Mesh','Position',[315,180,70,25],...'Callback',@meshbutton_Callback);hcontour = uicontrol('Style','pushbutton',...'String','Contour','Position',[315,135,70,25],...'Callback',@contourbutton_Callback);htext = uicontrol('Style','text','String','Select Data',...'Position',[325,90,60,15]);hpopup = uicontrol('Style','popupmenu',...'String',{'Peaks','Membrane','Sinc'},...'Position',[300,50,100,25],...'Callback',@popup_menu_Callback);ha = axes('Units','pixels','Position',[50,60,200,185]);align([hsurf,hmesh,hcontour,htext,hpopup],'Center','None');% Initialize the UI.% Change units to normalized so components resize automatically.f.Units = 'normalized';ha.Units = 'normalized';hsurf.Units = 'normalized';hmesh.Units = 'normalized';hcontour.Units = 'normalized';htext.Units = 'normalized';hpopup.Units = 'normalized';% Generate the data to plot.peaks_data = peaks(35);membrane_data = membrane;[x,y] = meshgrid(-8:.5:8);r = sqrt(x.^2+y.^2) + eps;sinc_data = sin(r)./r;% Create a plot in the axes.current_data = peaks_data;surf(current_data);% Assign a name to appear in the window title. = 'Simple GUI';% Move the window to the center of the screen.movegui(f,'center')% Make the UI visible.f.Visible = 'on';% Pop-up menu callback. Read the pop-up menu Value property to% determine which item is currently displayed and make it the% current data. This callback automatically has access to% current_data because this function is nested at a lower level. function popup_menu_Callback(source,eventdata) % Determine the selected data set. str = source.String; val = source.Value; % Set current data to the selected data set. switch str{val}; case 'Peaks' % User selects Peaks. current_data = peaks_data; case 'Membrane' % User selects Membrane. current_data = membrane_data; case 'Sinc' % User selects Sinc. current_data = sinc_data; end end% Push button callbacks. Each callback plots current_data in the% specified plot type. function surfbutton_Callback(source,eventdata) % Display surf plot of the currently selected data. surf(current_data); end function meshbutton_Callback(source,eventdata) % Display mesh plot of the currently selected data. mesh(current_data); end function contourbutton_Callback(source,eventdata) % Display contour plot of the currently selected data. contour(current_data); endendGUI展⽰⽅法3:利⽤AppDesigner和⽅法⼀的Guide类似总结我们有三种不同⽅式在matlab中创建简单的GUI程序,其中⽐较推荐的是使⽤编程的⽅式。
matlabGUI人机用户界面设计[6]
![matlabGUI人机用户界面设计[6]](https://img.taocdn.com/s3/m/3717f23424c52cc58bd63186bceb19e8b8f6ec99.png)
图7-18 对齐工具对话框
在界面之中还需要创建菜单,创建菜单能够经过菜单编辑器完毕。单击工具栏上旳菜单编辑器按钮,能够打开菜单编辑器对话框,在对话框中单击创建新菜单按钮,则能够创建新旳菜单,设置菜单属性如图7-20所示。
以空白界面类型为例,单击“OK”按钮,这时MATLAB将开启GUIDE旳图形界面,如图所示。
图 具有空白界面旳GUIDE图形界面
在GUIDE界面旳左侧为MATLAB旳控件面板,控件面板包括了能够在画布上绘制旳图形控件: (Push Button)、单项选择按钮(Toggle Button)、单项选择框(Radio Button)、复选框(Checkbox)、文本框(Edit Text)、静态文本框(Static Text)、滚动条(Slider)、组别框(Frame)、列表框(Listbox)、下拉框(Popup Menu)和坐标轴(Axes)。
2.1 GUIDE工具入门
使用图形句柄创建GUI旳过程繁琐,而且在程序编写好之前,顾客图形界面是不可见旳。所觉得了便于创建图形顾客界面,MATLAB提供了一种开发环境,能够帮助顾客创建图形顾客界面,这就是GUIDE——Graphic User Interface Development Environment。 在MATLAB中开启GUIDE旳措施: >>guide或者经过“Start”菜单项选择择“MATLAB”下旳“GUIDE”命令。
这时,将直接开启GUIDE Quick Start窗体,在这个窗体中,能够初步选择图形顾客界面旳类型,如图所示。
图 GUIDE旳迅速开启界面
在迅速开启界面中,能够选择四种类型旳新建界面:* 空白界面(Black GUI)。* 具有图形控件旳界面(GUI With Uicontrols)。* 具有菜单和坐标轴旳界面(GUI With Axes and Menu)。* 模式对话框(Modal Question Dialog)。
matlab gui 实例
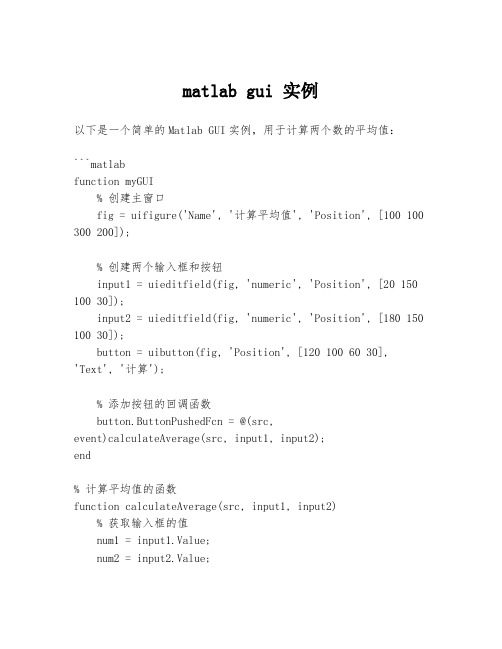
matlab gui 实例以下是一个简单的Matlab GUI实例,用于计算两个数的平均值:```matlabfunction myGUI% 创建主窗口fig = uifigure('Name', '计算平均值', 'Position', [100 100 300 200]);% 创建两个输入框和按钮input1 = uieditfield(fig, 'numeric', 'Position', [20 150 100 30]);input2 = uieditfield(fig, 'numeric', 'Position', [180 150 100 30]);button = uibutton(fig, 'Position', [120 100 60 30],'Text', '计算');% 添加按钮的回调函数button.ButtonPushedFcn = @(src,event)calculateAverage(src, input1, input2);end% 计算平均值的函数function calculateAverage(src, input1, input2)% 获取输入框的值num1 = input1.Value;num2 = input2.Value;% 计算平均值average = (num1 + num2) / 2;% 显示结果对话框uialert(src.Parent, sprintf('平均值为:%g', average), '结果', 'Icon', 'info');end```你可以将以上代码保存为一个.m文件,然后在Matlab命令窗口中运行`myGUI`函数,即可启动GUI应用程序。
matlab的GUI界面
数字图像处理作业一姓名:学号:2013212189 班级:20132116021.GUI开发基本方法:(1)设置GUI界面的布局,添加菜单栏,工具栏,以及其他需要的控件,并修改控件的大小,位置等使界面美观。
(2)根据需要修改控件的属性,如:tag,string,enable,font,等属性。
(3)通过callback属性编写控件的回调函数以实现控件的功能。
2.控件之间协同工作的方法:(1)通过tag属性程序可以区分不同的按钮。
(2)通过handles句柄可以调用不同控件的不同属性,实现控件之间属性的互相调用。
通过set()/get()函数修改控件属性。
(3)通过global设置全局变量,或通过setappdata()/getappdata ()函数来实现控件之间数据的调用。
(4)通过feval()函数,实现不同控件回调函数的互相调用。
3.作业GUI的简单描述:(1)实现功能:可以通过菜单栏,工具栏,或者界面按钮选择图片,将图片转化为二值图片格式,显示图片,并可以保存图片。
(2)技术描述:a.通过[] = uigetfile()函数,[]=uiputfile()函数来选择或保存图片。
通过if isequal(filename,0) || isequal(pathname,0)来判断是否选择文件路径,避免在取消时出现错误。
b.通过set(handles.text_filename,'string',fpath);显示打开图片的路径名称。
c.通过imread(),imshow(),im2bw()函数来获取图片数据,显示图片和将图片转换为二值格式。
d.当图片没有进行二值化修改时,菜单按钮和工具栏的保存按钮应该是不可选的,所以在程序的开始*_OpeningFcn中,将按钮的‘Enable’属性设置为off。
set(handles.file_save,'Enable','off');set(handles.tool_save,'Enable','off');e.在菜单栏的退出按钮执行退出之前,应该先判断修改后的图片是否保存。
matlab gui界面设计实例
matlab gui界面设计实例
以下是一个简单的MATLAB GUI界面设计实例:
1. 打开MATLAB软件并创建一个新的GUI文件,首先需要添加一个静态文本标签来说明该程序的用途。
2. 在接下来的步骤中,我们将添加一个单选按钮和一组复选框,允许用户选择他们的喜好和选项。
3. 其他元素可添加日期选择器,文本框和按钮等等。
4. 最后,我们需要添加一个事件处理程序,以便处理用户点击“提交”按钮时的操作。
通过这样一个简单的实例,我们可以学习到MATLAB GUI界面的基本设计原则和步骤,以及如何处理用户交互事件并使用MATLAB功能实现功能。
MATLAB用户界面GUI设计

第七章MATLAB的图形用户界面(GUI)的设计1.用户界面控制对象(1)窗口、轴、按钮的建立例1(gui_1.m):clear;clf;Hf_fig=figure(1);%建立一个窗口set(Hf_fig,'position',[100,100,540,360],...'color',[0.8,0.8,0.8]);%窗口位置属性:左下角点,宽×高,颜色Ha_axes=axes('Parent',Hf_fig,...'position',[0.1,0.4,0.8,0.5]);%建立一个坐标轴,位置属性:在左下角点,宽×高t=0:pi/50:4*pi;y=sin(t);Hc_push1=uicontrol(Hf_fig,'style','push',...'position',[80,60,100,25],...'string','Sin',...'callback',['y=sin(t);','plot(t,y);']);%在Hf_fig窗口下建立一个控件,类型属性:按钮%位置属性:起点,宽×高%字符串属性:显示Sin%回调属性:回调时运行程序段:y=sin;%plot(t,y)(2)列表框的建立例2(gui_2.m):clear;clf;Hf_fig=figure(1);set(Hf_fig,'position',[100,100,540,360],...'color',[0.8,0.8,0.8]);Ha_axes=axes('Parent',Hf_fig,...'position',[0.1,0.4,0.8,0.5]);%listboxHc_listbox1=uicontrol(Hf_fig,'style','listbox',...'position',[360,30,80,60],...'string',{'Sin';'Cos';'Exp'},...'callback',['v1=get(gcbo,''value'');','ex_gui_8(v1);']);%在Hf_fig窗口下建立一个控件,类型属性:列表框%位置属性:起点,宽×高%字符串属性:显示Sin%Cos%Exp%回调属性:回调时运行程序段:v1=get(gcbo,'value);%取当前对象的value属性,放入变量v1中%ex_gui_8(v1)%调用自定义函数ex_gui_8,%传递参数v1子程序的调用(ex_gui_8)function y=ex_gui_8(v)t=0:pi/50:4*pi;switch vcase 1y=sin(t);case 2y=cos(t);case 3y=exp(t);endplot(t,y);(3)菜单的建立例3(gui_3.m):clear;clf;Hf_fig=figure(1);set(Hf_fig,'position',[100,100,540,360],...'color',[0.8,0.8,0.8]);Ha_axes=axes('Parent',Hf_fig,...'position',[0.1,0.4,0.8,0.5]);t=0:pi/50:4*pi;Hm_m1=uimenu(gcf,'Label','User');%建立顶菜单项UserHm_plot=uimenu(Hm_m1,'Label','Plot');%在顶菜单项User下建立分菜单项PlotHm_sin=uimenu(Hm_plot,'Label','Sin',...'callback',['y=sin(t);','plot(t,y);']);%在分菜单项Plot下建立子菜单项Sin%回调时运行程序y=sin(t),plot(t,y)Hm_cos=uimenu(Hm_plot,'Label','Cos',...'separator','on',...'callback',['y=cos(t);','plot(t,y);']);2.用GUI设计工具设计图形用户界面(GUI)设计(1)GUI设计工具的启动GUI设计工具用GUIDE命令启动,或点相应菜单项:File—New—Gui—Blank GUI(2)GUI编程举例:①建立一个按钮与坐标轴a)点菜单项:File—New—Gui—Blank GUIb)点按钮、坐标轴图标,拖到图中,调整大小c)光标移到按钮位置,点图标property Inspecto r,点属性string,写sin。
- 1、下载文档前请自行甄别文档内容的完整性,平台不提供额外的编辑、内容补充、找答案等附加服务。
- 2、"仅部分预览"的文档,不可在线预览部分如存在完整性等问题,可反馈申请退款(可完整预览的文档不适用该条件!)。
- 3、如文档侵犯您的权益,请联系客服反馈,我们会尽快为您处理(人工客服工作时间:9:00-18:30)。
一个不错的Matlab的gui界面设计实例
%非常漂亮的日历,
function CalendarTable;
% calendar 日历
% Example:
% CalendarTable;
S=datestr(now);
[y,m,d]=datevec(S);
% d is day
% m is month
% y is year
DD={'Sun','Mon','Tue','Wed','Thu','Fri','Sat'};
close all
figure;
for k=1:7;
uicontrol(gcf,'style','text',...
'unit','normalized','position',[0.02+k*0.1,0.55,0.08,0.06],...
'BackgroundColor',0.6*[1,1,1],'ForegroundColor','b',...
'String',DD(k),'fontsize',16,'fontname','times new roman');
end
h=1;
ss='b';
qq=eomday(y,m);
for k=1:qq;
n=datenum(y,m,k);
[da,w] = weekday(n);
if k==d;
ss='r';
end
uicontrol(gcf,'style','push',...
'unit','normalized','position',[0.02+da*0.1,0.55-h*0.08,0.08,0.06],... 'BackgroundColor',0.6*[1,1,1],'ForegroundColor',ss,...
'String',num2str(k));
ss='b';
if da==7;
h=h+1;
end
end
uicontrol(gcf,'style','push',...
'unit','normalized','position',[0.6,0.66,0.12,0.08],...
'BackgroundColor',0.6*[1,1,1],'ForegroundColor',ss,...
'String','clock','fontsize',18,'fontname','times new roman');
Tq=uicontrol(gcf,'style','push',...
'unit','normalized','position',[0.74,0.66,0.17,0.08],...
'BackgroundColor',0.6*[1,1,1],'ForegroundColor',[0.1,0.9,0.9],...
'fontsize',18,'fontname','times new roman');
sq='The calendar';
uicontrol(gcf,'style','push',...
'unit','normalized','position',[0.14,0.86,0.37,0.08],...
'BackgroundColor',0.6*[1,1,1],'ForegroundColor',[0.1,0.9,0.9],...
'fontsize',18,'fontname','times new roman','string',sq);
try
while 1
set(Tq,'String',datestr(now,13));
pause(1);
end
end
计算万年历的Matlab程序(2008-12-21 13:59:19)
标签:matlab万年历杂谈分类:Matlab实例function test_calendar(year,month)
% 输入年份,月份,打印这个月的月历
run = 0;
ping = 0;
fprintf('\n%s %s %s %s %s %s %s\n',...
'日','一','二','三','四','五','六');
% 计算从第一年到前一年的闰年和平年的个数
for i =1:year-1
if (mod(i,4)==0 & mod(i,100)~=0) | mod(i,400)==0
run = run+1;
else
ping = ping+1;
end
end
% 计算从第一年到当年前一个月的天数sum = 366*run+365*ping;
for i = 1:month-1
sum = sum+monthday(year,i);
end
% 获得这个月的天数
n = monthday(year,month);
temp = zeros(n,1);
sum = sum+1;
% 计算这个月第一天是星期几
wkd = mod(sum,7);
for i = 1:n
temp(wkd+i) = i;
end
l = 1;
m = 1;
% 打印日历
for i = 1:length(temp)
if temp(i) ==0
temp2(l,m) = ' ';
fprintf(' ');
m = m+1;
else
temp2(l,m) = temp(i);
if temp(i) >= 10
fprintf('%d ',temp(i)); else
fprintf('%d ',temp(i)); end
m = m+1;
end
if mod(i,7)==0
fprintf('\n');
m = 1;
l = l+1;
end
end
fprintf('\n');
% 闰年和平年每月的天数
function out = monthday(year,i)
if mod(year,4)==0 & mod(year,100)~=0 | mod(year,400)==0
data = [31 29 31 30 31 30 31 31 30 31 30 31];
else
data = [31 28 31 30 31 30 31 31 30 31 30 31];
end
out = data(i);
举例:
输入:
>> test_calendar(2008,12)
返回:
日一二三四五六
1 2 3 4 5 6
7 8 9 10 11 12 13
14 15 16 17 18 19 20
21 22 23 24 25 26 27
28 29 30 31
闲来无事,学了一些Matlab GUI的基础知识,想找个东西练一下手。
看中了windows的日期与时间显示面板,于是依葫芦画瓢,用Matlab 做了一个,嘿嘿,觉得还挺像模像样的。
下面是效果图。
今日进一步完成了农历的计算和显示。