雅思小作文柱状图
英语考试作文-雅思写作小作文模版:柱状图
英语考试作文雅思写作小作文模版:柱状图雅思小作文模板――柱状图柱状图(1as can be seen from the diagram, great changes have taken place in……从图中可以看出,……发生了巨大变化。
2.from the table/chart/diagram/figure, we can see clearly that……or it is clear/apparent from the chart that……从图表我们可以很清楚(明显)看到……)和线型图写法一致,并且结合饼状图来写!表格题1. 找出最大值,最小值,以及一般值2. 进行分析比较,找出近似值和相差很大的数值常用句式 1.a is nearly /more than…times as much/many/large as b.(a是b的…倍。
) / the table shows the changes in the number of……over the period from……to……该表格描述了在……年之……年间……数量的变化。
2. be the same as…(与…相同)3.表原因的句子:(1). cause-effect (较常用) :XXX lead to / bring about / result in/ account for … (一个句子/shared the same tendency), therefore / thus / hence / as a result / consequently / (and) so …(2). effect-cause (较常用)XXX be caused by / result from / be the result of / be the effect of / be the consequence of …(一个句子/shared the same tendency), because …it is adj. that …it is unimaginable that …it is undeniable that …it is interesting to discover that …4.与饼状题类似。
雅思写作小作文范文 雅思写作柱状图bar chart 无报酬工作时间.doc

雅思写作小作文范文雅思写作柱状图bar chart 无报酬工作时间今天我们雅思写作小作文分范文的文章来研究下柱状图bar chart。
该图表按照所拥有的孩子的数量将婚后夫妇分成三类:没有孩子,有1到2个孩子,有3个以上孩子。
并在每个类别中都给出了男性和女性每周所做的无报酬工作的时间。
对比起来还是比较容易的。
小编搜集了一篇相关的高分范文,以供大家参考。
雅思写作小作文题目The diagram below shows the average hours of unpaid work per week done by people in different categories. (Unpaid work refers to such activities as childcare in the home, housework, and gardening.)Summarise the information by selecting and reporting the main features, and make comparisons where relevant.雅思写作小作文范文The given column graph shows information on the duration of unpaid works done by men and women of different categories.上面的柱状图给出的信息为不同类别的男性和女性所做的无报酬工作的持续时间。
As is presented in the illustration, married women who don’t have children do the unpaid-works (gardening, child care, and household works) 30 hours per week whereas married men do the similar unpaid jobs for about 18 hours per week. Women, this translation is from Laokaoya website, who have one or two children do such work for 50 hours/week but the men from the same category do only 17hours (approximately) each week. The women who have more than 3 kids seem to work the highest amount of unpaid works per week and that is nearly 60 hours. Surprisingly male from the same category work even less; amounting only 16 hours (approximately) of unpaid works.按照说明中所呈现的内容,结婚而没有孩子的女性每周所做没有报酬的工作(园艺,照顾孩子和整理家务)的时间为30小时。
雅思写作-小作文范文-柱状图

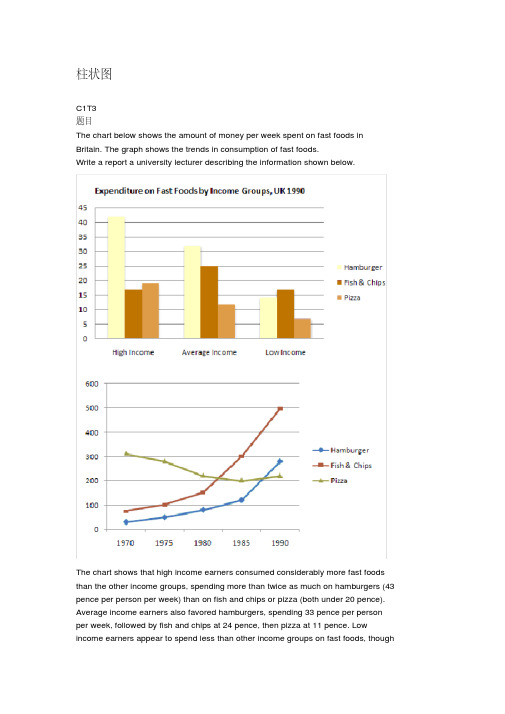
柱状图C1T3题目The chart below shows the amount of money per week spent on fast foods in Britain. The graph shows the trends in consumption of fast foods.Write a report a university lecturer describing the information shown below.The chart shows that high income earners consumed considerably more fast foods than the other income groups, spending more than twice as much on hamburgers (43 pence per person per week) than on fish and chips or pizza (both under 20 pence). Average income earners also favored hamburgers, spending 33 pence per person per week, followed by fish and chips at 24 pence, then pizza at 11 pence. Low income earners appear to spend less than other income groups on fast foods, though fish andchip remains their most popular fast food, followed by hamburgers and then pizza. From the graph we can see that in 1970, fish and chips were twice as popular as burgers, pizza being at that time the least popular fast food. The consumption of hamburgers and pizza has risen steadily over the 20 year period to 1990 while the consumption of fish and chips has been in decline over that same period with a slight increase in popularity since 1985.分析:题目The chart below shows the amount of money per week spent on fast foods in Britain. The graph shows the trends in consumption of fast foods.两句话,两个图第一段The chart shows that high income earners consumed considerably more fast foods than the other income groups, spending more than twice as much on hamburgers (43 pence per person per week) than on fish and chips or pizza (both under 20 pence).•说明了高收入人群的两个特点,第一是消耗快餐最多,第二是人群中hamburger, fish and chips, pizza的特点•spending more than twice as much on hamburgers than on fish and chip and chips or pizza 这是一句令人费解的句子,含义应为“消耗的汉堡是薯片或匹萨的两倍多”,应用的句型应当为典型的表示倍数关系的句型“n times as…as”,比如✓This airplane flies two times as fast as that one. 这家飞机的飞行速度是那架的两倍。
雅思写作小作文范文 雅思写作柱状图bar chart 六种商品的花费.doc
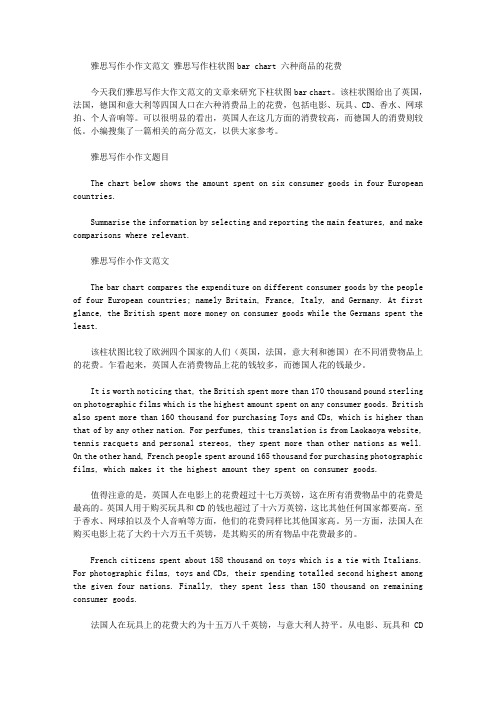
雅思写作小作文范文雅思写作柱状图bar chart 六种商品的花费今天我们雅思写作大作文范文的文章来研究下柱状图bar chart。
该柱状图给出了英国,法国,德国和意大利等四国人口在六种消费品上的花费,包括电影、玩具、CD、香水、网球拍、个人音响等。
可以很明显的看出,英国人在这几方面的消费较高,而德国人的消费则较低。
小编搜集了一篇相关的高分范文,以供大家参考。
雅思写作小作文题目The chart below shows the amount spent on six consumer goods in four European countries.Summarise the information by selecting and reporting the main features, and make comparisons where relevant.雅思写作小作文范文The bar chart compares the expenditure on different consumer goods by the people of four European countries; namely Britain, France, Italy, and Germany. At first glance, the British spent more money on consumer goods while the Germans spent the least.该柱状图比较了欧洲四个国家的人们(英国,法国,意大利和德国)在不同消费物品上的花费。
乍看起来,英国人在消费物品上花的钱较多,而德国人花的钱最少。
It is worth noticing that, the British spent more than 170 thousand pound sterling on photographic films which is the highest amount spent on any consumer goods. British also spent more than 160 thousand for purchasing Toys and CDs, which is higher than that of by any other nation. For perfumes, this translation is from Laokaoya website, tennis racquets and personal stereos, they spent more than other nations as well. On the other hand, French people spent around 165 thousand for purchasing photographic films, which makes it the highest amount they spent on consumer goods.值得注意的是,英国人在电影上的花费超过十七万英镑,这在所有消费物品中的花费是最高的。
雅思小作文-柱状图
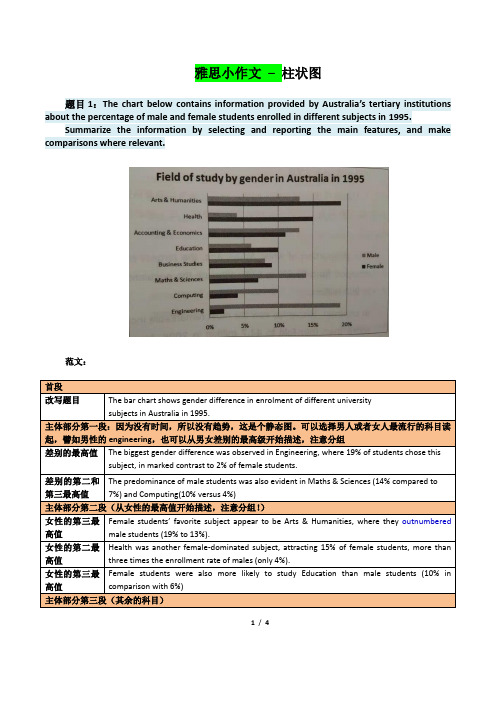
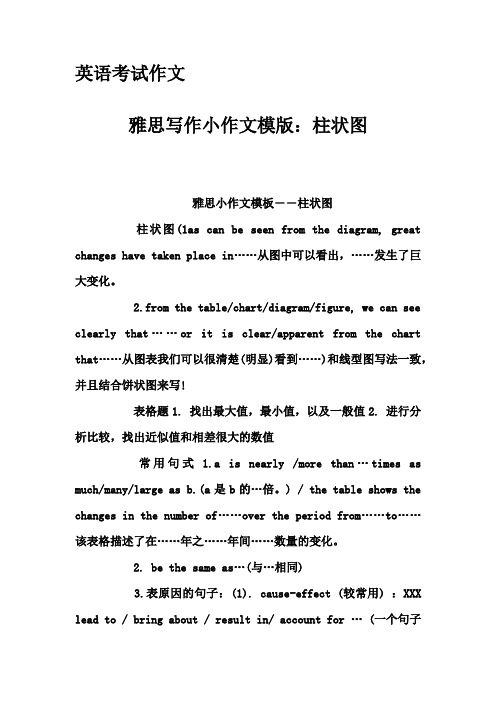
雅思小作文–柱状图题目1:The chart below contains information provided by Australia’s tertiary institutions about the percentage of male and female students enrolled in different subjects in 1995.Summarize the information by selecting and reporting the main features, and make comparisons where relevant.范文:1/ 4题目2:The chart below contains information about USA marriage and divorce rates between 1970 and 2000, and the marital status of adult Americans in two of the years.Summarize the information by selecting and reporting the main features, and make comparisons where relevant.2/ 4读图:动态图【因为有时间】,需要描述变化趋势These two graphs illustrate the change of marital status of American between 1970 and 2000.【改写题目】According to the first graph,there were 2.5m marriages in both 1970 and 1980, and then this figure decreased gradually during the next two decades, reaching to 2m in 2000. By comparison, the number of divorces first increased from 1m in 1970 to around 1.4 in 1980 and then slowly declined back to 1m in 2000.【分类描述第一幅柱状图,时态:一般过去时】As can be seen from the second bar chart,the percentage of married American adults dropped by more than 10% , from 70% in 1970 to less than 60% in 2000. Meanwhile, the percentage of adult Americans who were never married increased from about 15% in 1970 to20% in 2000, and despite still less than 10% , the proportion of divorced adults significantly went up from 1970 to 2000. Moreover, the percentages of the widowed in 1970 and 2000 accounted for less than 10% respectively, and showed a slight drop.【分类描述第二幅柱状图,时态:一般过去时】In conclusion, marital status of Americans in 2000 was not as optimistic as that of three decades ago. (1781.如果有两幅图表,则分成2段分别一一描述2.表示数值上升下降的常用句式有:•The number of …dropped from … to …•The percentage of …increased from about … to less than…•The proportion of … significantly went up from … to …3.切忌没有结论。
2021年3月4日雅思写作范文

2021年3月4日雅思写作范文Task 1(小作文:柱状图为例)The bar chart shows the number of visitors to four different museums in a city during the year 2019.Looking at the chart, it's clear that there are significant differences among the four museums in terms of the number of visitors.The Museum of Art seems to be the most popular one. In January, it welcomed around 800 visitors. And this number fluctuated throughout the year but remained relatively high. It had a peak of about 1200 visitors in July, probably because it might have some special art exhibitions during the summer months. Even in the least visited month, which was December with around 600 visitors, it still outnumbered the other museums in that particular month.The Science Museum also had a decent number of visitors. Starting from around 400 in January, it gradually increased until it reached about 900 in October. However, compared to the Museum of Art, its overall numbers were lower.The History Museum was not as popular as the first two. It had a relatively stable number of visitors, hovering around 300 400 throughout the year. There were no significant spikes or drops, which might suggest that it lacked some special events or attractions to draw more crowds.The least popular was the Local Folklore Museum. It had the lowest number of visitors all year round. In January, it only had about 100 visitors, and it never really got much higher. In fact, it struggled to reach 300 visitors even in its best performing month.Overall, the Museum of Art was the star in terms of attracting visitors in 2019, while the Local Folklore Museum really needs to find ways to boost its popularity, like maybe creating more interactive exhibits or doing more advertising.Task 2(大作文:以“Some people think that the best way to improve road safety is to increase the minimum legal age for driving a car or motorbike. To what extent do you agree or disagree?”为例)Well, when it comes to improving road safety, the idea of increasing the minimum legal driving age is quite a controversial one.On one hand, I can see why some people think it could be a good idea. Younger people are generally less experienced in life, and that inexperience can translate to being less cautious on the road. For example, a 16 year old might be more likely to take risks while driving, like speeding or not paying full attention to traffic rules, just because they haven't fully grasped the seriousness of driving. If we increase the minimum age, say to 18 or even 20, those new drivers would have had more time to mature and understand the importance of safety. Also, they might have had more general life experience that could make them better decision makers behind the wheel.On the other hand, increasing the minimum legal age is not a panaceafor all road safety problems. There are plenty of older drivers who also cause accidents. Some might have bad driving habits that they've developed over the years, or they could be driving while distracted by things like mobile phones. So, just focusing on the age of new drivers doesn't really address the root causes of all road accidents.Moreover, there are other ways to improve road safety that are just as important, if not more so. For instance, better driver education programscould be implemented. These could include more in depth training on handling different road conditions, understanding vehicle mechanics, and dealing with emergency situations. Also, stricter enforcement of traffic laws for all drivers, regardless of age, would be a great step forward. If people knew that they would be severely punished for breaking the rules, they might be more careful.In conclusion, while increasing the minimum legal driving age might have some benefits in terms of improving road safety, it's not the best way on its own. A combination of better driver education, stricter law enforcement, and other safety measures is what we really need to make our roads safer for everyone.。
雅思写作小作文范文 雅思写作柱状图bar chart 影响工作表现的因素.doc
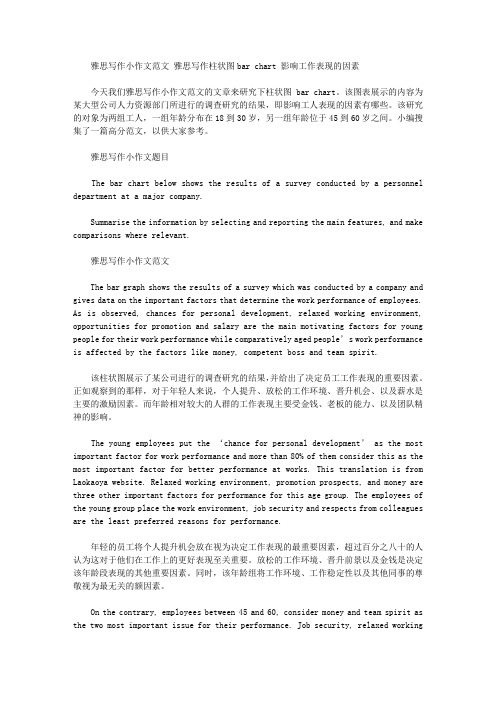
雅思写作小作文范文雅思写作柱状图bar chart 影响工作表现的因素今天我们雅思写作小作文范文的文章来研究下柱状图bar chart。
该图表展示的内容为某大型公司人力资源部门所进行的调查研究的结果,即影响工人表现的因素有哪些。
该研究的对象为两组工人,一组年龄分布在18到30岁,另一组年龄位于45到60岁之间。
小编搜集了一篇高分范文,以供大家参考。
雅思写作小作文题目The bar chart below shows the results of a survey conducted by a personnel department at a major company.Summarise the information by selecting and reporting the main features, and make comparisons where relevant.雅思写作小作文范文The bar graph shows the results of a survey which was conducted by a company and gives data on the important factors that determine the work performance of employees. As is observed, chances for personal development, relaxed working environment, opportunities for promotion and salary are the main motivating factors for young people for their work performance while comparatively aged people’s work performance is affected by the factors like money, competent boss and team spirit.该柱状图展示了某公司进行的调查研究的结果,并给出了决定员工工作表现的重要因素。
(完整版)雅思写作-小作文范文-柱状图
柱状图C1T3题目The chart below shows the amount of money per week spent on fast foods in Britain. The graph shows the trends in consumption of fast foods.Write a report a university lecturer describing the information shown below.The chart shows that high income earners consumed considerably more fast foods than the other income groups, spending more than twice as much on hamburgers (43 pence per person per week) than on fish and chips or pizza (both under 20 pence). Average income earners also favored hamburgers, spending 33 pence per person per week, followed by fish and chips at 24 pence, then pizza at 11 pence. Low income earners appear to spend less than other income groups on fast foods, thoughfish and chip remains their most popular fast food, followed by hamburgers and then pizza.From the graph we can see that in 1970, fish and chips were twice as popular asburgers, pizza being at that time the least popular fast food. The consumption of hamburgers and pizza has risen steadily over the 20 year period to 1990 while the consumption of fish and chips has been in decline over that same period with a slight increase in popularity since 1985.分析:题目The chart below shows the amount of money per week spent on fast foods inBritain. The graph shows the trends in consumption of fast foods.两句话,两个图第一段The chart shows that high income earners consumed considerably more fastfoods than the other income groups, spending more than twice as much onhamburgers (43 pence per person per week) than on fish and chips or pizza(both under 20 pence).说明了高收入人群的两个特点,第一是消耗快餐最多,第二是人群中hamburger, fish and chips, pizza的特点spending more than twice as much on hamburgers than on fish and chip and chips or pizza 这是一句令人费解的句子,含义应为“消耗的汉堡是薯片或匹萨的比如两倍多”,应用的句型应当为典型的表示倍数关系的句型“n times as…as”,? This airplane flies two times as fast as that one. 这家飞机的飞行速度是那架的两倍。
- 1、下载文档前请自行甄别文档内容的完整性,平台不提供额外的编辑、内容补充、找答案等附加服务。
- 2、"仅部分预览"的文档,不可在线预览部分如存在完整性等问题,可反馈申请退款(可完整预览的文档不适用该条件!)。
- 3、如文档侵犯您的权益,请联系客服反馈,我们会尽快为您处理(人工客服工作时间:9:00-18:30)。
The graph below shows the different modes of transport used to travel to and from work in one European city in 1960, 1980 and 2000.
• The graph shows the changing patterns in commuting by train, car, tube or bus for commuters in London in the years 1960, 1980 and 2000.
• The number of people using trains at first rose from just under 20% in 1960 to about 26% in 1980, but then fell back to about 23% in 2000.
Task one Bar chart
柱状图主Байду номын сангаас段写法
• 将图表中相似的趋势分别捏合成一段 描述。
• 第一句:比较图表中相对比的两个部 分的所有比例得出一个总体结论。
• 第二句以后:详细解释这一总体趋势。
language for comparisons
Percentage of girl and boy students in Class A
• Use of the tube has been relatively stable, falling from around 27% of commuters in 1960 to 22% in 1980, but climbing back to reach 25% by 2000.
Summarise the information by selecting and reporting the main features, and make comparisons where relevant. You should write at least 150 words. You should spend about 20 minutes on this task.
• The percentage of boys is larger/ greater/ higher than that of girls in Class A (67% and 33% respectively).
outnumber/ exceed/ surpass/ excel
• Boys outnumber girls in Class A. • The number of boys exceeds that of girls
• The graph shows how age and gender influence the frequency of heart attacks in the US.
• Less than 6% of all heart attacks occur in the 2944 age group. The number of women who suffer heart attacks in this group is negligible - only 3000 per year, compared to 123,000 men.
• However the proportion of men and women with heart attacks rises dramatically between 45 and 64, with over half a million per year. Over 420,000 men a year in this age group have heart attacks. The incidence amongst women increases - women have one heart attack for every three men in this age group.
•more than/ fewer than 1. There are more boys (67%) than girls (33%) in Class A. 2. Class A has fewer gilrs than boys. 3. Boys take up more percentage than girls in Class A. make up; account for; occupy...
in Class A. • There are almost/ nealy/ roughly twice as
many boys as girls in Class A.
• The chart below shows information about Heart
Attacks by Age and Gender in USA.
number/ percentage
• The number of boys is larger/ greater/ higher than that of girls in Class A.
• The percentage of boys(67%) is larger/ greater/ higher than that of girls(33%) in Class A.
• Over the age of 65, the number of men suffering heart attacks only increases slightly. However there is a huge increase in the number of women with heart attacks - they comprise over 40% of all victims.