Research on Optimal Peak Load Shifting Strategy of Battery Energy Storage System
新托福阅读评分标准解析2

2021新托福阅读评分标准解析新托福考试阅读一共有42道题,但是阅读总分却只有30分,那么新托福阅读是怎么算分的呢?评分标准是怎么样的呢?下面就和大家提供新托福阅读评分标准解析!来欣赏一下吧。
一. 阅读评分标准解析其实阅读题分数是有一个转化过程的,阅读题的原始分值和转化后的对应分值。
新托福阅读每篇题量为12-14题,每篇阅读除了最后一道题为2分外,其余题目分值都是1分,所以托福阅读总的原始分值为45分。
所以。
同学们如果在考试中因为时间问题迫不得已要舍弃一道题目时,尽量不要舍弃小结题。
一般情况下,这类题目是多项选择题,6个中选择3个,选错一个扣一分,错2个或3个不得分。
那么具体对应的分值转换又是怎么样的呢?我们一起来看看下面的表格就明白了:二. 影响阅读成绩的其他因素如果阅读遇到加试,也有可能会影响阅读成绩。
那么阅读加试是如何影响阅读成绩的呢?考试中只有一局部考生会遇到阅读加试,没有遇到加试的考试成绩不会有变动,按照上述评分标准来评分。
但是参加加试的考生成绩可能会因为加试题目的情况,成绩产生一些变动,具体细那么如下:(1)如果考试正确率比加试正确率高,说明考题偏容易,也就是高分档的学生比拟多,那么ETS将给分数的分布作相应的调整,也就是给一些高分的学生减分。
给哪些学生减分呢?当然是加试做得学生。
(2)如果考试正确率比加试正确率低,说明考题偏难,也就是低分档的学生比拟多,那么ETS将给分数的分布作相应的调整,也就是给一些低分的学生加分。
给哪些学生加分呢?当然是加试做得好的学生。
(3)如果考试正确率和加试正确率持平,实现了正态分布,考生的分数那么不需要调整了。
之所以分数有波动是因为ETS为了在考生水平有波动的情况下,仍然能够给予考生一个相对较为公平的分数。
1. a couple of 两三个,几个Although he thought of the key idea in 1951, the first maser was not pleted until a couple of years later.2. aount for 解释Variations of clay position and the temperatures at which they are fired aount for the differences in texture and appearance.3. adapt to 使适应于They have been able to adapt to ecological changes.4, adorn with sth 用…装饰Some pots were adorned with incised or stamped decorations.5.appeal to 吸引Publishing literature consisting of exciting stories that would appeal to both children and adults6.apply to 适用于Ethological theory began to be applied to research on children in the 1960’s.7.at best 充其量,最多Hunting is at best a precarious way of procuring food, even when the diet is supplemented with seeds and fruits.8.at intervals 相隔一定距离However, at intervals of 10 to 100 years, these glaciers move forward up to 100 times faster than usual.9.at the expense of sth 在损害…的情况下A multitude of microorganisms make their livings directly at the expense of other creatures.10.at the height of sth 在…最鼎盛时期The violin had reached the height of its popularity by the middle of the eighteenth century.11.back and forth 来回地They then spiral back and forth between the Earth's magic poles very rapidly.12.be absent from 缺席,不在Lacking the right to vote and absent from the seats of power, women line were not considered an important force in history.13.be capable of 能…的Many animals are capable of using objects in the natural environment as rudimentary tools.14. be characterized by 以…为特征The nervous system of vertebrates is characterized by a hollow, dorsal nerve cord that ends in the head region as an enlargement, the brain.15.be posed of 由…组成Ocean life is primarily posed of plants.16.be concerned with 与某事物有关Ethnology is concerned with the study of adaptive, or survival, value of behavior and its Evolutionary history.17.be distinct from 与…不同Jupiter and the other giant plas are of a low-density type quite distinct from the terrestrial plas18.be essential to 对…不可缺少Public performance is essential to verbal art.19.be exposed to 使接触,使遭受Body contact reduces the surface area exposed to the cold air.20.be far from 离…很远,根本不是But far from being random, molt is controlled by strong evolutionary forces that have established an optimal time and duration.21. be hostile to 极不友好的,极厌恶的Ocean bottom is a hostile environment to humans22.be regarded as 被认为是Humanity's primal efforts to systematize the concepts of size, shapes, and number are usually regarded as the earliest mathematics.23.be related to 与…有关的,相联系的Why is dancing closely related to popular music in the United States?24. be responsible for 对…负责In fact, nuclear reactions that convert hydrogen to helium are responsible for most of the energy that stars produce.25. be sensitive to 对…敏感的Ants can be extremely sensitive to these signals.26.be subjected to 经历,遭受Oil is formed when organic material trapped in sediments is slowly buried and subjected to increased temperatures and pressures, transforming it into petroleum.27. be superior to 优越于Natural vitamins are superior to synthetic ones28 .be traced to 找出根源The ancestry of the piano can be traced to the early keyboard instruments of the fifteenth and sixteenth centuries.29. be/bee aware of 意识到,认识到People became aware of the new service by word of mouth or newspaper advertisements.30. be/bee/get austomed to 习惯于In the harsh environment of northern Europe, Scandinavian women had been austomed to practicing forms of shifting cultivation, and they immediately understood Native American horticulture.31. be/bee/get involved in 与…有关联的Two distinct processes are involved in molting.32.benefit from 从…中受益Students benefit from schools, which require long hours and homework.33.break down 分解All of these forces slowly break down the Earth's exposed rocky crust into smaller and smaller pieces that eventually bee clay.34.by far 到目前为止Marine sediment is by far the most important environmentfor the preservation of fossils.35.by means of 通过,凭借The topic of the passage is developed primarily by means of Adividing the discussion into two major areas.36.by virtue of 由于Many are uninhabitable, by virtue of their small size and particular characteristics37.confine to 限制在一定范围之内The delivery service was at first confined to cities.38.conform to 符合Parks should be designed to conform to the topography of the area39.contribute to 有奉献,有助于Transportation contributed to the development and maintenance of trade.40.cope with 对付Under certain circumstance the human body must cope with gases at greater-than-normal atmospheric pressure.41.date back to 始于In the United States, rent controls date back to at least World War II.42. depend on 依靠The gulls depend on the falcons for protection.43. deprive sb/sth of sth 剥夺..某事物Plant stems die when deprived of water.44.derive from 获得,起源于Babies obviously derive pleasure from sound input.45.due to 由于,因为Due to their dense structure, iron meteorites have the best chance of surviving an impact, and most are found by farmers plowing their fields.46. evolve from/out of 从...进化来,从…开展来The one most widely aepted today is based on the assumption that drama evolved from ritual.47.extract from 提取It turns out that some fossils can be extracted from these sediments by putting the rocks in an acid bath.48.feed on 以…为食物Predators are animals that capture and feed on other animals.49.focus on 集中(注意力)于They focus on the meaning of their parents' words.50. get rid of 处理掉Atoms or molecules get rid of excess energy by themselves, without any outside intervention.51.give aess to 向…开放To connect the pueblos and to give aess to the surrounding tableland, the architects laid out a system of public roads with stone staircases for ascending cliff faces.52.give birth to 使诞生,引起Most insects lay eggs, but some give birth to live young.53.give off 发散,发出If Jupiter were larger, it would give off much less heat.54.give rise to 引起,导致The musical Renaissance was too short to give rise to a new musical style.55.go beyond 超过,越过An interviewer can go beyond written questions and probefor a subject's underlying feelings and reasons.56.go out of business 停业,关门The shop went out of business.57.have nothing to do with 与…无关A species’ survival may have nothing to do with itsability or inability to adapt.58.impart to 传授给They functioned as sanctuaries where the elders impart tribal lore to the younger generation.59.impose on 强加于New regulations were imposed on nontraditional education. 60.in mon 共同No two ets ever look identical, but they have basic features in mon.61.in favor of 赞同,支持The artist was in favor of a traditional style of painting.62.in quantity 大量,大批There were also a number of poor-quality figurines and painted pots produced in quantity by easy, inexpensive means.63.in season 当季Before the mid-nieenth century, people in the United States ate most foods only in season.64.in spite of 尽管,任凭In spite of problems with their condition, restoration, and preservation many panel paintings have survived.65.in the absence of 在缺乏…的情况下The concentrations at which the adverse effects appear will be greater than the concentrations that the pollutants would have in the absence of human activities.66.in view of 由于In view of the rate at which the radio sources emit energy, they should disappear in a few million years.67.instead of 代替Instead of working with light, however, he worked with microwaves.68.invest in 投资He started to invest in the town’s cultural development. 69.lead to 导致,引起In fact, there is wide agreement that it is the rate of change humans are inflicting, even more than the changes themselves that will lead to biological devastation.70.leave out 排除Explanations of animal behavior that leave out any sort of consciousness at all and ascribe actions entirely to instinct leave many questions unanswered.71.off the mark 不正确This analogy is not far off the mark.72.on behalf of 代表Satire serves to prod people into an awareness of truth though rarely to any action on behalf of truth.73. on the basis of 在…的根底上Antoine Lavisher, on the basis of careful experimentation, was led to propose a different theory of burning74.owing to 由于,因为Marine sediment is by far the most important environmentfor the preservation of fossils, owing to the incredible richness of marine life.75.perceive sth as sth 认为Although art deco in its many forms was largely perceived as thoroughly modern, it was strongly influenced by the decorative arts movements that immediately preceded it. 76.pick up 学会Adults make it as easy as they can for babies to pick up a language by exaggerating such cues.77.put off 推迟Some tasks could not be done in the winter, other had to be put off during harvest time.78.regardless of 不顾Ultimately, literature is aesthetically valued, regardless of language, culture, or mode of presentation.79.result from 因..而产生Most functions result from the needs of the local area and of the surrounding.80.result in 结果,导致The upward movement of fieldstones should result in pure soil.81.set about 开始,动手African American artists of this period set about creating a new portrayal of themselves and their lives in the United States.82. set aside 留下将来用Certain parts of town were restricted to residential use, while others were set aside for industrial or mercial development.83.so far 到目前为止The Paris Exhibition of 1889 included both the widest span and the greatest height achieved so far.84.sort out 把…分类Clay particles are sorted out by size and weight.85.spring up 涌现In the early colonial day in North America, small cities sprang up along the Atlantic Coastline.86.stem from 起源于It can be argued that much of New York City’s importance stems from its early and continuing advantage of situation.87.stretch out 伸展,伸出The residues from these explosions left huge black marks on the face of Jupiter, some of which have stretched out to form dark ribbons.88.strive for 为…而奋斗As they began to strive for social and cultural independence,their attitudes toward themselves changed.89.take aount of sth./take sth into aount 考虑到Artists are recognizing the distinction between public and private spaces, and taking that into aount when executing their public missions.90.take advantage of 利用Many families could take advantage of previously unavailable fruits, vegetables, and dairy products to achieve more varied fare.91.thanks to 由于kiwis smell out earthworms thanks to nostrils located at the tip of their beaks.92.to some extent 某种程度上Their attitudes toward themselves changed, and, to some extent, other segments of American society began to change their attitudes toward them.93.turn out 结果是,证明是Some potash was exported from Maine and New Hampshire in the seventeenth century, but the market turned out to be mainly domestic.her in 宣告…的来临Autumn could be ushered in by severe frost.95. wear away 磨损Natural forces wear away the Earth's crust96.wipe out 消灭,肃清Entire crops can be wiped out by fungal attacks both before and after harvesting.97.with respect to 在…方面The year 1850 may be considered the beginning of a new epoch in America art, with respect to the development of watercolor painting.98. with the advent of 随着…的出现With the advent of high-resolution radio interferometers during the late 1970's, part of the answer became clear. 99.with the aid of 借助于It is now taught with the aid of puters.100.with the exception of 除..以外With the exception of printing patterns directly onto the cloth, whether by block, roller, or screen, all of these are based on dyeing; that is, the immersion of the fabric in a dye bath.。
Optimizedstairca...
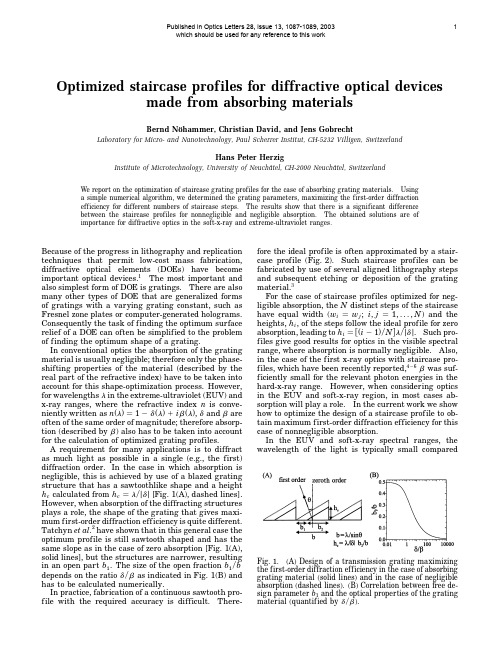
Optimized staircase profiles for diffractive optical devices made from absorbing materialsBernd Nöhammer,Christian David,and Jens GobrechtLaboratory for Micro-and Nanotechnology,Paul Scherrer Institut,CH-5232Villigen,SwitzerlandHans Peter HerzigInstitute of Microtechnology,University of Neuchâtel,CH-2000Neuchâtel,Switzerland We report on the optimization of staircase grating profiles for the case of absorbing grating inga simple numerical algorithm,we determined the grating parameters,maximizing the first-order diffractionefficiency for different numbers of staircase steps.The results show that there is a significant differencebetween the staircase profiles for nonnegligible and negligible absorption.The obtained solutions are ofimportance for diffractive optics in the soft-x-ray and extreme-ultraviolet ranges.Because of the progress in lithography and replicationtechniques that permit low-cost mass fabrication, diffractive optical elements(DOEs)have becomeimportant optical devices.1The most important andalso simplest form of DOE is gratings.There are also many other types of DOE that are generalized formsof gratings with a varying grating constant,such asFresnel zone plates or computer-generated holograms. Consequently the task of finding the optimum surfacerelief of a DOE can often be simplified to the problemof finding the optimum shape of a grating.In conventional optics the absorption of the gratingmaterial is usually negligible;therefore only the phase-shifting properties of the material(described by the real part of the refractive index)have to be taken intoaccount for this shape-optimization process.However,for wavelengths l in the extreme-ultraviolet(EUV)and x-ray ranges,where the refractive index n is conve-niently written as n͑l͒12d͑l͒1i b͑l͒,d and b areoften of the same order of magnitude;therefore absorp-tion(described by b)also has to be taken into accountfor the calculation of optimized grating profiles.A requirement for many applications is to diffract as much light as possible in a single(e.g.,the first)diffraction order.In the case in which absorption isnegligible,this is achieved by use of a blazed grating structure that has a sawtoothlike shape and a heighth c calculated from h cl͞j d j[Fig.1(A),dashed lines]. However,when absorption of the diffracting structures plays a role,the shape of the grating that gives maxi-mum first-order diffraction efficiency is quite different.Tatchyn et al.2have shown that in this general case the optimum profile is still sawtooth shaped and has the same slope as in the case of zero absorption[Fig.1(A), solid lines],but the structures are narrower,resulting in an open part b1.The size of the open fraction b1͞b depends on the ratio d͞b as indicated in Fig.1(B)and has to be calculated numerically.In practice,fabrication of a continuous sawtooth pro-file with the required accuracy is difficult.There-fore the ideal profile is often approximated by a stair-case profile(Fig.2).Such staircase profiles can be fabricated by use of several aligned lithography stepsand subsequent etching or deposition of the gratingmaterial.3For the case of staircase profiles optimized for neg-ligible absorption,the N distinct steps of the staircasehave equal width(w iw j;i,j1,...,N)and the heights,h i,of the steps follow the ideal profile for zeroabsorption,leading to h i͓͑i21͒͞N͔l͞j d j.Such pro-files give good results for optics in the visible spectral range,where absorption is normally negligible.Also, in the case of the first x-ray optics with staircase pro-files,which have been recently reported,4–6b was suf-ficiently small for the relevant photon energies in the hard-x-ray range.However,when considering optics in the EUV and soft-x-ray region,in most cases ab-sorption will play a role.In the current work we show how to optimize the design of a staircase profile to ob-tain maximum first-order diffraction efficiency for this case of nonnegligible absorption.In the EUV and soft-x-ray spectral ranges,thewavelength of the light is typically smallcomparedFig.1.(A)Design of a transmission grating maximizing the first-order diffraction efficiency in the case of absorbing grating material(solid lines)and in the case of negligible absorption(dashed lines).(B)Correlation between free de-sign parameter b1and the optical properties of the grating material(quantif ied by d͞b).Published in Optics Letters 28, issue 13, 1087-1089, 2003which should be used for any reference to this work1Fig.2.General form of a staircase profile enabling the optimization of the first-order diffraction efficiency.with the period b and the height of the gratings used;therefore in most cases a grating can be treated as a thin structure,and the thin-element approximation can be used (for a discussion of the validity of the thin-element approximation see,for example,Ref.1).In addition,d and b are typically very small;conse-quently ref lections at surfaces between different materials are negligible.With these approximations the diffraction efficiency h can be calculated with the aid of a Fourier analysis of the transmission function.For a discrete profile we get 1h ÉNX i 1f i É2,(1)wheref i exp ͑22p h i b ͞d ͒exp ͓2p i ͑h i 2x i ͔͒sin ͑p w i ͒͞p ,(2)and the normalized heights (h i ),widths (w i )andmiddle positions (x i )of the steps are denotedh i h i j d j ͞l ,w i w i ͞b ,x i x i ͞b .(3)Equation (1)is a sum of contributions from each step of the staircase profile shown in Fig.2.The first term in Eq.(2)describes the absorption within one step.The second term gives the phase of each contribution,originating from the material phase shift (h i )and the position of the step within the grating (x i ).The third term is obtained from the Fourier transform of a rect-angular function with width w i .The analytical treat-ment of the problem would be rather complex since the efficiency is a complicated sum over functions of all staircase parameters.Therefore we used a numerical approach,applying a local search algorithm 7to find the optimum values for the parameters in Eq.(3)with respect to diffraction efficiency.The principle of the algorithm is to make small,ran-dom,trial changes in the actual profile,where the change is allowed to take place only if the new profile (the new set of parameters h i ,w i ,and x i )has a higher diffraction efficiency than the previous one.By re-peating this step until a large number (n trial .100)of subsequent trial changes fails to improve the diffrac-tion efficiency,an optimum set of values of h i ,w i ,and x i will ultimately be reached.This kind of algorithm could fail because of the presence of local maxima and as a consequence would never yield reasonable results for the design parame-ters of the grating.However,the numerical resultsshow that the total number of maxima is rather small;therefore it is sufficient to repeat the whole algorithm a few (typically 20)times with different,randomly chosen starting parameters for the grating in order to obtain a parameter set that represents the global optimum with respect to diffraction efficiency.Figure 3shows the numerical results of using this algorithm in the case of a staircase profile with four levels.For low values of absorption (high values of d ͞b )we obtain the expected staircase profile,which has steps with equal width and normalized heights of 0,1͞4,1͞2,and 3͞4.When we go to higher values of absorption,the widths (as well as the heights)of the second and the third steps decrease and finally approach zero.The widths of the first and the fourth steps both increase,and for values of d ͞b near zero they both approach a value equal to half of the grating period b .Therefore in the limit of infinite absorption a conventional binary amplitude grating is obtained.These results for high values of absorption can be qualitatively understood because the staircase profile always has to provide an optimum approximation of the ideal profile in terms of diffraction efficiency.For the ideal grating in the case of strong absorption the main contributions to the diffraction efficiency come from regions of the grating with smallheight.Fig.3.Optimum normalized widths w i (A)and heights h i (B)of a four-step staircase profile as a function of d ͞b of the grating material.Fig.4.First-order diffraction efficiency of a four-step pro-file (solid curve)featuring optimal values for the heights and widths of the steps.In addition,the diffraction ef-ficiency of the ideal continuous profile (see Fig.1)and a four-step profile optimized for negligible absorption aredepicted.Fig.5.First-order diffraction efficiency for different opti-mized grating designs.Therefore it is important to get a good approximation of the region with zero height (provided by the first step with w 1ഠb 1)and a short region with small height at the beginning of the sawtooth (provided by the second and third steps,which therefore tend to have rather small widths and heights in the case of high absorption).In Fig.4the diffraction efficiency of a four-step pro-file with optimal values for h i ,w i ,and x i is depicted.In addition,the diffraction efficiency of the ideal con-tinuous profile and a four-step profile with the con-ventional design rule optimized for zero absorption are plotted for comparison.For high values of d ͞b thetwo different staircase profiles nearly have the same diffraction efficiency,whereas for values of d ͞b below 10a significant difference can be observed.There-fore the optimal design of the staircase profile has to be used in this case to guarantee maximum diffrac-tion efficiency (e.g.,for d 2the optimum four-step profile gives 22%diffraction efficiency in comparison with only 16%for a four-step profile optimized for zero absorption).When different step numbers N of the staircase profile are used,similar results are found.For high values of d ͞b (typically d ͞b .10)the anticipated profile optimized for zero absorption [w i w j and h i ͑i 21͒͞N ]is obtained.For the case of high absorption the staircase profile gives a good approxi-mation of the ideal continuous profile in regions with small or zero structure height and an inferior approximation in regions of large structure heights,as expected.Figure 5shows the first-order diffraction efficiencies of optimized profiles with different step numbers N .For small values of absorption a larger number N of steps leads to a strongly improved diffraction efficiency,whereas for strong absorption very little difference is found among all profiles.This is because,for all profiles,the normalized width of the region with zero height approaches 1͞2,going to small values of d ͞b .Consequently in the limit of infinite absorption all the staircase profiles will have the same optical properties as a binary amplitude grating.In summary,we have shown that material absorp-tion has to be taken into account for the optimization of gratings in the EUV and x-ray ranges.By use of a numerical local search algorithm we were able to calculate the optimum parameters for maximum first-order diffraction efficiency of gratings with staircase profiles.This work was funded by the Swiss National Sci-ence Foundation. B.N öhammer ’s e-mail address is **********************.References1.H.P.Herzig,ed.,Micro-optics (Taylor &Francis,Lon-don,1998).2.R.Tatchyn,P.L.Csonka,and I.Lindau,J.Opt.Soc.Am.72,1630–1639(1982).3.M.B.Stern,in Micro-optics ,H.P.Herzig,ed.(Taylor &Francis,London,1998),pp.53–86.4.E.Di Fabrizio,F.Romanato,M.Gentili,S.Cabrini,B.Kaulich,J.Susini,and R.Barrett,Nature 401,895–898(1999).5.W.Yun,i,A.A.Krasnoperova,E.Di Fabrizio,Z.Cai,F.Cerrina,Z.Chen,M.Gentili,and E.Gluskin,Rev.Sci.Instrum.70,3537–3541(1999).6.B.N öhammer,J.Hoszowska,H.P.Herzig,and C.David,presented at the X-Ray Microscopy Conference 2002,Grenoble,France,July 29–August 2,2002.7.E.Aarts and J.K.Lenstra,Local Search in Combinato-rial Optimization (Wiley,Chichester,U.K.,1997).。
Research on topographical factors in the formation of gully type debris flows
Research on topographical factors in the formation of gully type debris flows
YU Bin, LI Li, MA Yu, ZHANG Jianna, WU Yufu, ZHANG Huihui, CHU Shengming, QI Xing
State Key Laboratory of Geohazard Prevention and Geoenvironment Protection Chengdu University of Technology, Chengdu 610059, China
There are three groups of factors related to topography, geology and hydrology which have influence on the formation of gully type debris flows. All these factors make the understanding of the formation of debris flows rather complicated. In this paper a single representative factor ( T-factor) for the topography is proposed, which can be used to give threshold values for debris flow formation. The study was carried out in the Longxi River catchment, which is located in the Wenchuan Earthquake area. The fault which triggered the Wenchuan Earthquake crosses the catchment of the Longxi River. During a heavy rainfall event on August 13, 2010, 34 gully type debris flows and 11 slope debris flows were triggered. In some catchments no debris flows were triggered even though these catchments were in the vicinity of gullies with triggered debris flows. We were able to isolate and analyze the influence of the topography on the formation of debris flows because during the rainfall event of August 2010 the hydrological conditions were almost the same in the investigated gullies. We could also neutralize the influence of the geological factors by selecting groups of neighboring catchments located in areas with the same geological characteristics. A new T-factor is proposed in this study as a topographical indicator which is calculated as the product of a form factor and the average slope. Higher T-factor values are generally related to higher probabilities of debris flow formation. The paper analyses also the influence of the position and distance to the triggering fault and the size of the catchments on the threshold values of the T-factor for debris flow formation.
英文作文弹力小车

英文作文弹力小车回答例子1:Title: The Elasticity of English Composition: Exploring the Small CarIntroduction:In the realm of English composition, creativity often takes the wheel, steering us through diverse landscapes of expression. Imagine embarking on a journey with a small car, representing our essays, agile and adaptable to the twists and turns of our ideas. In this exploration, we delve into the elasticity of English composition through the metaphor of a small car, navigating through its various components, from structure to style, and witnessing its capacity to stretch and adapt.Body:1. Structure: Just as a small car requires a sturdy frame to support its journey, an English composition relies on a solid structure. The introduction serves as the vehicle's ignition,igniting interest and setting the direction. The body paragraphs are akin to the wheels, propelling the car forward with arguments and evidence. Meanwhile, the conclusion acts as the brakes, gradually bringing the journey to a halt while leaving a lasting impression.2. Flexibility: Like a small car maneuvering through narrow streets, English composition requires flexibility. Writers must adapt their language and tone to suit different audiences and purposes. Whether crafting a persuasive essay or a reflective piece, the ability to switch gears seamlessly is essential. Just as a small car adjusts to various terrains, from smooth highways to rugged paths, writers must navigate through different genres and styles with ease.3. Creativity: In the realm of English composition, creativity fuels the engine of expression. Like customizing a small car with unique features, writers inject their essays with original ideas and imaginative flair. Whether through vivid imagery, thought-provoking metaphors, or unconventional structures, creativity adds depth and richness to the writing, making it stand out amidst a sea of words.4. Precision: Just as a small car relies on precise engineering for optimal performance, English composition demands clarity and precision. Every word is carefully chosen, every sentence meticulously crafted to convey the intended message. Like a skilled driver navigating through traffic, writers must steer clear of ambiguity and vagueness, ensuring that their ideas are communicated effectively to the reader.5. Revision: Like fine-tuning a small car for peak performance, revision is essential in the writing process. Writers must review and refine their essays, polishing each paragraph until it shines. Just as a mechanic inspects every part of a car for flaws, writers scrutinize their sentences for errors in grammar, punctuation, and logic. Through the process of revision, essays are honed to perfection, ready to embark on their journey into the world.Conclusion:In the world of English composition, the small car serves as a fitting metaphor for the elasticity and adaptability of the craft. From its sturdy structure to its flexible nature, from thefuel of creativity to the precision of language, the small car embodies the essence of effective writing. As we continue to explore the vast terrain of expression, may we harness the power of the small car to drive our ideas forward with clarity, creativity, and purpose.回答例子2:Title: Exploring the Dynamic World of English Essay - The Elasticity CarIntroduction:In the realm of English composition, one intriguing topic that captivates both students and educators alike is the concept of the "Elasticity Car." This metaphorical vehicle embodies the flexibility and adaptability required in crafting compelling essays. As we embark on this journey through the dynamic landscape of English writing, let us delve into the intricate mechanisms that propel the Elasticity Car forward.Understanding Elasticity:Elasticity, in its essence, refers to the ability of a material to stretch and recover its original shape after deformation. Similarly, in the context of English essays, elasticity embodiesthe writer's capacity to stretch their ideas, explore diverse perspectives, and seamlessly transition between various elements while maintaining coherence and clarity.The Chassis: Structure and Organization:Every well-built car requires a sturdy chassis to provide structural integrity. Similarly, a well-crafted essay relies on a solid organizational framework. The introduction serves as the vehicle's ignition, sparking interest and setting the course for the reader. The body paragraphs act as the engine, propelling the essay forward with supporting evidence and arguments. Finally, the conclusion serves as the destination, wrapping up the journey while leaving a lasting impression.The Engine: Ideas and Arguments:Just as a powerful engine drives a car, compelling ideas and arguments propel an essay forward. The Elasticity Car thrives on a diverse array of perspectives, allowing writers to navigate through complex terrain with ease. Whether exploring contrasting viewpoints or presenting innovative solutions, the engine of the Elasticity Car never falters, powering through obstacles with intellectual prowess.The Suspension: Transition and Cohesion:Smooth transitions are the suspension system of the Elasticity Car, ensuring a seamless ride for the reader. Like a well-tuned suspension, transitional phrases and cohesive devices absorb the bumps and jolts of shifting ideas, maintaining the essay's momentum. Whether employing conjunctions, transitional words, or parallel structures, a skilled writer ensures that every connection is fluid and effortless.The Tires: Language and Style:Just as the tires of a car provide traction and grip, language and style are the driving forces behind effective communication in an essay. The Elasticity Car adapts its tires to suit the terrain, employing a diverse range of linguistic tools –from vivid imagery and figurative language to concise syntax and varied vocabulary. By carefully selecting the right tire for the road ahead, writers ensure a smooth and enjoyable journey for their readers.The Steering Wheel: Revision and Editing:No journey is complete without proper navigation, and thesteering wheel of the Elasticity Car guides writers through the process of revision and editing. Like a skilled driver adjusting course to avoid obstacles, writers fine-tune their essays to perfection, addressing inconsistencies, refining arguments, and polishing language. Through meticulous editing, the Elasticity Car ensures that every word serves a purpose, steering the essay towards its intended destination.Conclusion:In the ever-evolving landscape of English composition, the Elasticity Car serves as a metaphorical vehicle for navigating the complexities of writing. With its flexible chassis, powerful engine, smooth suspension, reliable tires, and precise steering, this metaphor embodies the essential elements of effective essay writing. By embracing the principles of elasticity, writers can embark on a journey of exploration and discovery, harnessing the full potential of their creativity and intellect.。
工厂供配电英语作文

工厂供配电英语作文Title: Factory Power Supply and Distribution。
In the modern industrial landscape, the efficient supply and distribution of power within factories are paramount to ensuring smooth operations and maximizing productivity. This essay delves into the key aspects of factory power supply and distribution, addressing various components, challenges, and solutions involved.Introduction:Factory power supply and distribution encompass the infrastructure and systems responsible for delivering electricity to different areas and equipment within a manufacturing facility. It involves intricate planning, design, and implementation to meet the diverse energy demands of various processes and machinery.Components of Factory Power Supply and Distribution:1. Power Generation: 。
Factories often rely on multiple sources for power generation, including grid-supplied electricity, on-site generators, renewable energy sources like solar or wind, or a combination thereof. Each source comes with its own setof considerations regarding reliability, cost-effectiveness, and environmental impact.2. Transformers and Switchgear:Transformers play a crucial role in stepping up or stepping down voltage levels to match the requirements of different equipment. Switchgear facilitates the safecontrol and distribution of electrical power, ensuring protection against overloads and short circuits.3. Distribution Panels:Distribution panels serve as distribution points within the factory, branching out power to differentsections or departments. They regulate the flow of electricity and enable monitoring and control of individual circuits.4. Cabling and Wiring:Proper cabling and wiring are essential for transmitting electricity efficiently while minimizing losses and hazards. Factors such as wire gauge, insulation, and routing are carefully considered to ensure optimal performance and safety.5. Backup Power Systems:To mitigate the impact of power outages or disruptions, many factories incorporate backup power systems such as uninterruptible power supplies (UPS) or diesel generators. These systems provide temporary power support during emergencies, preventing costly downtime.Challenges in Factory Power Supply and Distribution:1. Load Variability:Manufacturing processes often exhibit fluctuating energy demands due to factors like production cycles, equipment usage patterns, and seasonal variations. Managing such load variability efficiently poses a significant challenge for factory power distribution systems.2. Power Quality Issues:Maintaining consistent power quality is crucial to prevent disruptions, equipment damage, and productivity losses. Issues such as voltage fluctuations, harmonic distortions, and power factor imbalance can arise and needto be addressed through proper monitoring and corrective measures.3. Safety and Compliance:Ensuring compliance with electrical safetyregulations and standards is paramount to protect personnel, equipment, and assets within the factory. Implementingrobust safety protocols, regular inspections, and employee training programs are essential to mitigate risks and maintain a safe working environment.4. Integration of Renewable Energy:While integrating renewable energy sources offers environmental benefits and long-term cost savings, it introduces complexities in terms of system compatibility, intermittency management, and grid synchronization. Overcoming these challenges requires careful planning and investment in smart grid technologies.Solutions and Best Practices:1. Energy Monitoring and Management Systems:Implementing advanced energy monitoring and management systems allows real-time tracking of energy consumption, identifying inefficiencies, and optimizing usage patterns. This data-driven approach enables proactive decision-making and energy conservation initiatives.2. Demand Response Strategies:Adopting demand response strategies involves adjusting energy consumption in response to supply constraints or price fluctuations. By incentivizing load shifting or curtailment during peak demand periods, factories can reduce operational costs and alleviate stress on the grid.3. Power Factor Correction:Installing power factor correction equipment helps improve the efficiency of electrical systems by reducing reactive power losses. This not only enhances power quality but also lowers electricity bills and extends the lifespan of equipment.4. Diversification of Power Sources:Diversifying power sources through hybrid systems or microgrids enhances resilience and reduces dependency on asingle energy supply. Integrating renewable energy sources alongside conventional sources offers both environmental and economic benefits.Conclusion:In conclusion, effective factory power supply and distribution are essential for maintaining productivity, ensuring safety, and promoting sustainability in industrial settings. By leveraging advanced technologies, implementing best practices, and adapting to evolving energy landscapes, factories can optimize their energy usage and contribute to a more efficient and resilient manufacturing sector.。
Applied Energy

张或,等:重塑工业废弃地集体记忆景观设计研究同时,配合种植先锋植物来改良土壤,由低级到 高级,自然的发生演替。
场地主要原生植物有芦苇、 狗尾草等耐盐碱植物,通过样方观测的方法确定新增 种苗比例,减少人工恢复植被种群的种间竞争。
在覆 盖土上层种植天津市长势良好的园林绿化植物,如白 腊,臭椿,榆树等乔木,金银木,女贞,紫叶小檗等花灌 木。
种植过程中出现长势不好或腐烂的植物可回填 土壤中改善生态。
在植被恢复的基础上,还应该促进生态系统中动物和微生物的正常生物循环,保证生物 群落的稳定发展。
随着植物的生长,逐渐产生了适合 鸟类、昆虫、爬行动物的生活空间,以及微生物的衍生 场所,食物网随着植物物种的丰富而逐步完善。
生态 系统中运输者,转化者,传播者的营养循环,使当地生 态系统良性循环^农村对于农田中蟋蟀、刺猬、田鼠 被封存的乡土记忆再次被唤醒,如图8所示。
图8 a . b .c .d 景观恢复过程(图片来源:作者自绘)4 结论自然体制的运行过程本身就是生态景观。
自然 体制的运行当然也包括人的参与,这样才能形成一个 更加完整的生态机制。
只有充分构建集体记忆、合理 考虑人与自然之间的资源配置关系,才能达到真正意 义上的人居环境饱和状态;只有人与自然和谐相处, 才能真正地找到此片土地正在消失的乡土记忆。
当 地居民构筑农家生态孕、廊,不仅是对传统休闲文化 的新诠释,同时也是对传统空间可持续发展的表现, 从而更好地复兴这片工业废弃地本身的历史人文场 所精神。
[2] 杰罗姆•特鲁克,曲公英.对场所的记忆和记忆的场所:集体记忆的 哈布瓦赫式社会——K 族,志研究[J ]. M 际社会科,余忐,2012,4(12) :33 -46.[3] 阿尔多•罗挪国外城市规划与设计理论译丛^城I 丨础筑学[M ].北 京:中国建筑工业出版社,2006:34 - 68.[4] 常必.历史环境的再生之道——历史意识与设计探索[M ].北京:中国迚筑丨:业出版社,2008 ,67.[5] 陈小杳,乍洪远.1业废弃物堆积场地小态恢复与景观营造[J ].现 代國林,2013,10(11) :19 -26.作者简介:张或(1992 ),山西太原人,硕丨:研究生,研究方向;景观规 划设计、城丨1】•附洪管理(494799280@ qq. com) _参考文献:[1]菇纬.灌于文化景观视财下的£业遗产整介[J ].艺术4设讣,2011:124 -125.指导教师:嘗磊(1962 ),大汴人,吨七,教授,研究方向:景观规划设 计、以观生态技术。
ASTM C1609 C1609M-12纤维混凝土弯曲性能的标准试验方法(使用具有第三点荷载的梁)
Designation:C1609/C1609M–10Standard Test Method forFlexural Performance of Fiber-Reinforced Concrete(Using Beam With Third-Point Loading)1This standard is issued under thefixed designation C1609/C1609M;the number immediately following the designation indicates the year of original adoption or,in the case of revision,the year of last revision.A number in parentheses indicates the year of last reapproval.A superscript epsilon(´)indicates an editorial change since the last revision or reapproval.1.Scope*1.1This test method evaluates theflexural performance of fiber-reinforced concrete using parameters derived from the load-deflection curve obtained by testing a simply supported beam under third-point loading using a closed-loop,servo-controlled testing system.1.2This test method provides for the determination of first-peak and peak loads and the corresponding stresses calculated by inserting them in the formula for modulus of rupture given in Eq1.It also requires determination of residual loads at specified deflections,the corresponding residual strengths calculated by inserting them in the formula for modulus of rupture given in Eq1(see Note1).It provides for determination of specimen toughness based on the area under the load-deflection curve up to a prescribed deflection(see Note2)and the corresponding equivalentflexural strength ratio.N OTE1—Residual strength is not a true stress but an engineering stress computed using simple engineering bending theory for linear elastic materials and gross(uncracked)section properties.N OTE2—Specimen toughness expressed in terms of the area under the load-deflection curve is an indication of the energy absorption capability of the particular test specimen,and its magnitude depends directly on the geometry of the test specimen and the loading configuration.1.3This test method utilizes two preferred specimen sizes of100by100by350mm[4by4by14in.]tested on a300mm [12in.]span,or150by150by500mm[6by6by20in.] tested on a450mm[18in.]span.A specimen size different from the two preferred specimen sizes is permissible.1.4Units—The values stated in either SI units or inch-pound units are to be regarded separately as standard.The values stated in each system may not be exact equivalents; therefore,each system shall be used independently of the other. Combining values from the two systems may result in non-conformance with the standard.1.5This standard does not purport to address all of the safety concerns,if any,associated with its use.It is the responsibility of the user of this standard to establish appro-priate safety and health practices and determine the applica-bility of regulatory limitations prior to use.2.Referenced Documents2.1ASTM Standards:2C31/C31M Practice for Making and Curing Concrete Test Specimens in the FieldC42/C42M Test Method for Obtaining and Testing Drilled Cores and Sawed Beams of ConcreteC78Test Method for Flexural Strength of Concrete(Using Simple Beam with Third-Point Loading)C125Terminology Relating to Concrete and Concrete Ag-gregatesC172Practice for Sampling Freshly Mixed ConcreteC192/C192M Practice for Making and Curing Concrete Test Specimens in the LaboratoryC823Practice for Examination and Sampling of Hardened Concrete in ConstructionsC1140Practice for Preparing and Testing Specimens from Shotcrete Test Panels3.Terminology3.1Definitions—The terms used in this test method are defined in Terminology C125.3.2Definitions of Terms Specific to This Standard:3.2.1end-point deflection,n—the deflection value on the load-deflection curve equal to1⁄150of the span length,or a larger value as specified at the option of the specifier of tests.3.2.2first-peak load,P1,n—the load value at thefirst point on the load-deflection curve where the slope is zero.3.2.3first-peak deflection,d1,n—the net deflection value on the load-deflection curve atfirst-peak load.3.2.4first-peak strength f1,n—the stress value obtained when thefirst-peak load is inserted in the formula for modulus of rupture given in Eq1.3.2.5load-deflection curve,n—the plot of load versus net deflection of aflexural beam specimen loaded to the end-point deflection.1This test method is under the jurisdiction of ASTM Committee C09on Concrete and Concrete Aggregates and is the direct responsibility of SubcommitteeC09.42on Fiber-Reinforced Concrete.Current edition approved March1,2010.Published April2010.Originally approved st previous edition approved in2007as C1609/C1609M–07. DOI:10.1520/C1609_C1609M-10.2For referenced ASTM standards,visit the ASTM website,,or contact ASTM Customer Service at service@.For Annual Book of ASTM Standards volume information,refer to the standard’s Document Summary page on the ASTM website.*A Summary of Changes section appears at the end of this standard. Copyright©ASTM International,100Barr Harbor Drive PO Box C-700,West Conshohocken,Pennsylvania19428-2959,United States3.2.6net deflection ,n —the deflection measured at mid-span of a flexural beam specimen exclusive of any extraneous effects due to seating or twisting of the specimen on its supports or deformation of the support and loading system.3.2.7peak load,P P ,n —the maximum load on the load-deflection curve.3.2.8peak-load deflection,d P ,n —the net deflection value on the load-deflection curve at peak load.3.2.9peak strength,f P ,n —the stress value obtained when the peak load is inserted in the formula for modulus of rupture given by Eq 1.3.2.10D —nominal depth of the beam specimen in mm.N OTE 3—To simplify nomenclature,the nominal beam depth is shown in units of mm for both the SI and inch-pound version of this test method.3.2.11L —span length or distance between the supports.3.2.12residual load,P 600D ,n —the load value correspond-ing to a net deflection of L/600for a beam of nominal depth D.3.2.13residual load,P 150D ,n —the load value corresponding to a net deflection of L/150for a beam of nominal depth D.3.2.14residual strength,f 600D ,n —the stress value obtainedwhen the residual load P 600Dis inserted in the formula for modulus of rupture given in Eq 1.3.2.15residual strength,f 150D ,n —the stress value obtainedwhen the residual load P 150Dis inserted in the formula for modulus of rupture given in Eq 1.3.2.16specimen toughness,T 150D ,n —toughness of beam specimen of nominal depth D at a net deflection of L/150.3.2.17equivalent flexural strength ratio,R T ,150D,n —thevalue obtained when the specimen toughness T 150Dis inserted in Eq 3.N OTE 4—The equivalent flexural strength ratio is calculated as the ratio of the weighted equivalent load up to a net deflection of L/150over the first-peak load multiplied by 100.The R T ,150150value is equivalent to the R e,3value defined in the Technical Report No.34of the Concrete Society.34.Summary of Test Method4.1Molded or sawn beam specimens having a square cross-section of fiber-reinforced concrete are tested in flexure using a third-point loading arrangement similar to that speci-fied in Test Method C78but incorporating a closed-loop,servo-controlled testing system and roller supports that are free to rotate on their axes.Load and net deflection are monitored and recorded to an end-point deflection of at least 1⁄150of the span.Data are recorded and plotted by means of an X-Y plotter,or they are recorded digitally and subsequently used to plot a load-deflection curve.Points termed first-peak,peak,and residual loads at specified deflections are identified on the curve,and are used to calculate flexural performance param-eters.5.Significance and Use5.1The first-peak strength characterizes the flexural behav-ior of the fiber-reinforced concrete up to the onset of cracking,while residual strengths at specified deflections characterize theresidual capacity after cracking.Specimen toughness is a measure of the energy absorption capacity of the test specimen.The appropriateness of each parameter depends on the nature of the proposed application and the level of acceptable crack-ing and deflection serviceability.Fiber-reinforced concrete is influenced in different ways by the amount and type of fibers in the concrete.In some cases,fibers may increase the residual load and toughness capacity at specified deflections while producing a first-peak strength equal to or only slightly greater than the flexural strength of the concrete without fibers.In other cases,fibers may significantly increase the first-peak and peak strengths while affecting a relatively small increase in residual load capacity and specimen toughness at specified deflections.5.2The first-peak strength,peak strength,and residual strengths determined by this test method reflect the behavior of fiber-reinforced concrete under static flexural loading.The absolute values of energy absorption obtained in this test are of little direct relevance to the performance of fiber-reinforced concrete structures since they depend directly on the size and shape of the specimen and the loading arrangement.5.3The results of this test method may be used for com-paring the performance of various fiber-reinforced concrete mixtures or in research and development work.They may also be used to monitor concrete quality,to verify compliance with construction specifications,obtain flexural strength data on fiber-reinforced concrete members subject to pure bending,or to evaluate the quality of concrete in service.5.4The results of this standard test method are dependent on the size of the specimen.N OTE 5—The results obtained using one size molded specimen may not correspond to the performance of larger or smaller molded specimens,concrete in large structural units,or specimens sawn from such units.This difference may occur because the degree of preferential fiber alignment becomes more pronounced in molded specimens containing fibers that are relatively long compared with the cross-sectional dimensions of the mold.Moreover,structural members of significantly different thickness experi-ence different maximum crack widths for a given mid-span deflection with the result that fibers undergo different degrees of pull-out and extension.6.Apparatus6.1Testing Machine —The testing machine shall be capable of servo-controlled operation where the net deflection of the center of the beam is measured and used to control the rate of increase of deflection.Testing machines that use stroke dis-placement control or load control are not suitable for estab-lishing the portion of the load-deflection curve immediately after first-peak.The loading and specimen support system shall be capable of applying third-point loading to the specimen without eccentricity or torque.The fixtures specified in Test Method C78are suitable with the qualification that supporting rollers shall be able to rotate on their axes and shall not be placed in grooves or have other restraints that prevent their free rotation.6.2Deflection-Measuring Equipment —Devices such as electronic transducers or electronic deflection gages shall be located in a manner that ensures accurate determination of the net deflection at the mid-span exclusive of the effects of seating or twisting of the specimen on its supports.One acceptable3“Concrete Industrial Ground Floors—A Guide to Design and Construction,”Technical Report 34,3rd edition,Concrete Society,Slough,United Kingdom,2003.arrangement employs a rectangular jig,which surrounds the specimen and is clamped to it at mid-depth directly over the supports (Figs.1and 2).Two electronic displacement trans-ducers or similar digital or analog devices mounted on the jig at mid-span,one on each side,measure deflection through contact with appropriate brackets attached to the specimen.The average of the measurements represents the net deflection.6.3Data Recording System —An X-Y plotter coupled di-rectly to electronic outputs of load and deflection is an acceptable means of obtaining the relationship between load and net deflection—that is,the load-deflection curve.A data acquisition system capable of digitally recording and storing load and deflection data at a sampling frequency of at least 2.5Hz is an acceptable alternative.After a net deflection of L/900has been exceeded,it is permissible to decrease the data acquisition sampling and recording frequency to 1Hz.N OTE 6—For X-Y plotters,accurate determination of the area under the load-deflection curve and the loads corresponding to specified deflections is only possible when the scales chosen for load and deflection are reasonably large.A load scale chosen such that 25mm [1in.]corresponds to a flexural stress of the order of 1MPa [150psi],or no more than 20%of the estimated first-peak strength,is recommended.A recommended deflection scale is to use 25mm [1in.]to represent about 10%of the end-point deflection of 1⁄150of the span,which is 2mm [0.08in.]for a 350by 100by 100mm [14by 4by 4in.]specimen size,and 3mm [0.12in.]for a 500by 150by 150mm [20by 6by 6in.]specimen size.When data are digitally stored,the test parameters may be determined directly from the stored data or from a plot of the data.In the latter case,use a plot scale similar to that recommended for an X-Y plotter.7.Sampling,Test Specimens,and Test Units7.1General Requirements —The nominal maximum size of aggregate and cross-sectional dimensions of test specimens shall be in accordance with Practice C31/C31M or Practice C192/C192M when using molded specimens,or in accordance with Test Method C42/C42M when using sawn specimens,provided that the following requirements are satisfied:7.1.1The length of test specimens shall be at least 50mm [2in.]greater than three times the depth,and in any case not less than 350mm [14in.].The length of the test specimen shall not be more than two times the depth greater than the span.7.1.2The tolerances on the cross-section of the test speci-mens shall be within 62%.The test specimens shall have a square cross-section within these tolerances.7.1.3The width and depth of test specimens shall be at least three times the maximum fiber length.7.1.4When the specimen size is not large enough to meet all the requirements of 7.1-7.1.3,specimens of square cross-section large enough to meet the requirements shall be used.The three times maximum fiber length requirement for width and depth may be waived at the option of the specifier of tests to permit specimens with a width and depth of 150mm [6in.]when using fibers of length 50to 75mm [2to 3in.].N OTE 7—The results of tests on beams with relatively stiff fibers,such as steel fibers,longer than one-third the width and depth of the beam may not be comparable with test results of similar-sized beams with fibers shorter than one-third the width and depth because of preferential fiber alignment,and different size beams may not be comparable because of size effects.The degree of preferential fiber alignment may be less for fibers that are flexible enough to be bent by contact with aggregate particles or mold surfaces than for rigid fibers that remain straight during mixing and specimen preparation.7.2Freshly Mixed Concrete —Obtain samples of freshly mixed fiber-reinforced concrete for the preparation of test specimens in accordance with Practice C172.7.2.1Mold specimens in accordance with Practice C31/C31M or Practice C192/C192M ,except that consolidation shall be by external vibration.Consolidation may be consid-ered to be adequate when entrapped air voids are no longer observed rising to the surface of the specimen.Fill the mold in one layer by using a wide shovel or scoop parallel to the length of the mold to place the layer uniformly along the length of themold.FIG.1Arrangement to Obtain Net Deflection by Using Two Transducers Mounted on Rectangular Jig Clamped to Specimen DirectlyAboveSupportsN OTE 8—Make sure that the time of vibration is sufficient to ensure adequate consolidation,as fiber-reinforced concrete requires a longer vibration time than concrete without fibers,especially when the fiber concentration is relatively high.7.2.2When filling the mold,attempt to add an amount of concrete that will exactly fill the mold after consolidation.When screeding the top surface,continue external vibration to ensure that fibers do not protrude from the finished surface.7.2.3Curing shall be in accordance with Practice C31/C31M or Practice C192/C192M .7.3Hardened Concrete —Select samples of hardened fiber-reinforced concrete from structures in accordance with Practice C823.7.3.1Prepare and condition sawn specimens in accordance with Test Method C42/C42M .7.4Prepare specimens from shotcrete panels in accordance with Practice C1140.7.5Test Unit —Prepare and test at least three specimens from each sample of fresh or hardened concrete.8.Evaporation Control8.1When the time between removal of test specimens from a moist curing environment and the start of testing is likely to exceed 15min,minimize drying by covering with wet burlap,applying a curing compound,or by other appropriate tech-niques.9.Procedure9.1Molded or sawn specimens shall be turned on their side with respect to the position as cast before placing on the support system.Specimens representing shotcrete shall be loaded in the same direction as the specimen was shot.9.2Arrange the specimen and the loading system so that the specimen is loaded at the third points in accordance with TestMethod C78.The span length shall be three times the specimen depth or 300mm [12in.],whichever is greater.N OTE 9—If full contact cannot be reasonably assured between the specimen,the load-applying devices,and the supports before loading,grind the contact surfaces of the specimen so that full contact is achieved.Alternatively,use capping materials at the load or support points.9.3Operate the testing machine so that the net deflection of the specimen increases at a constant rate in accordance with Table 1.Up to a net deflection of L/900,the rate of increase of net deflection shall be in accordance with the second column of Table 1.For net deflection beyond L/900and up to the end point deflection,a higher rate of increase of net deflection is permitted in accordance with the third column of Table 1.When increasing the loading rate,the rate of increase of net deflection shall be increased in increments not exceeding 0.05mm/min [0.002in./min].Subsequent increases of the rate of increase of net deflection shall be at least 30s apart.Include the rate(s)of increase of net deflection in the test report.N OTE 10—First-peak deflection for third-point loading isestimatedFIG.2Arrangement to Obtain Net Deflection by Using Two Transducers Mounted on Jig Secured to Specimen Directly Above SupportsTABLE 1Rate of Increase in Net DeflectionBeam sizeAUp to net deflection of L/900Beyond net deflection of L/900100by 100by 350mm0.025to 0.075mm/min 0.05to 0.20mm/min [4by 4by 14in.][0.001to 0.003in./min][0.002to 0.008in./min]150by 150by 500mm0.035to 0.10mm/min 0.05to 0.30mm/min [6by 6by 20in.][0.0015to 0.004in./min][0.002to 0.012in.min]AThe initial loading rate up to deflection of L/900for other sizes and shapes of specimens shall be based on reaching the first-peak deflection 40to 100s after the start of the test.Beyond a net deflection of L/900,the rate of increase of net deflection shall not exceed 8times the initialrate.assuming linear-elastic behavior up tofirst peak from the equation:d1523P1L31296EI F11216d2~11µ!115L2Gwhere:d 1=thefirst peak deflection,mm[in.]P 1=thefirst-peak load,N[lbf]L=the span length,mm[in.]E=the estimated modulus of elasticity of the concrete,MPa[psi] I=the cross-sectional moment of inertia,mm4[in.4]d=the average depth of specimen at the fracture,as oriented for testing,mm[in.]andµ=Poisson’s ratioFor a Poisson’s ratio of0.20and a d to L ratio of1/3,the value of the portion of the equation in brackets is1.25.N OTE11—For a350by100by100mm[14by4by4in.]specimen size,the net deflection atfirst-peak load is approximately0.04mm [0.0016in.],and for a500by150by150mm[20by6by6in.]specimen size,it is approximately0.05mm[0.002].9.4If the rate of increase of net deflection cannot be controlled(see Note12)during the test,it is permitted to reduce the initial net deflection rate to50%of the limits in9.3 until a net deflection of L/900is reached.After a net deflection of L/900,the rate of increase of net deflection shall not exceed 8times the initial rate until the specified end-point deflection is reached.When increasing the loading rate,the rate of increase of net deflection shall be increased in increments not exceeding 0.05mm/min[0.002in./min].Subsequent increases of the rate of net deflection shall be at least30s apart.Include the rate(s) of increase of net deflection in the test report.N OTE12—The rate of increase of net deflection is out of control if a sudden acceleration of the net deflection of a beam occurs leading to a rate at least20times higher than the rate specified in9.3and9.4.The lower loading rate is permitted for brittle(higher strength)concretes to provide better control of the increase of net deflection immediately after the peak load.9.5When using deflection-measuring equipment for thefirst time,or after alterations or maintenance,confirm the reliability of the measured net deflection by comparing the measured deflection atfirst-peak load with the value estimated from the formula in Note10.9.6Unless otherwise required by the specifier of tests, terminate the test at a net deflection of1⁄150of the span.9.7Further testing to a greater end-point deflection shall be specified at the option of the specifier of tests,and shall be specified as the span divided by some whole number less than 150.9.8Make two measurements of the specimen depth and width adjacent to the fracture(one on each face of the specimen)to the nearest1mm[0.05in.]to determine the average depth and width.9.9Determine the position of the fracture by measuring the distance along the middle of the tension face from the fracture to the nearest point of support.9.10When the fracture occurs outside the middle third of the span,discard the results.10.Calculation10.1Values of load and deflection used in subsequent calculations shall be obtained from the load-deflection curve, or from stored digital data.10.2Determine thefirst-peak load as that value of load corresponding to thefirst point on the load-deflection curve where the slope is zero,that is,the load is a local maximum value.Determine the corresponding deflection value.See Figs. 3and4.N OTE13—Small ripples orfluctuations in the load-deflection curve due to electronic noise or mechanical vibration should not be confused with a definite change in the slope of the load-deflection curve in the vicinity of first peak load,particularly when the portion of the curve in question is magnified.10.3Calculate thefirst-peak strength using thefirst-peak load determined in10.2,the average specimen dimensions determined in9.8,and the following formula for modulus of rupture:f5PLbd2(1)where:f=the strength,MPa[psi],P=the load,N[lbf],L=the span length,mm[in.],b=the average width of the specimen at the fracture,as oriented for testing,mm[in.],andd=the average depth of the specimen at the fracture,as oriented for testing,mm[in.].10.3.1Record the number rounded to the nearest0.05MPa [5psi]as thefirst-peak strength,f1.10.4Determine the peak load as that value of load corre-sponding to the point on the load-deflection curve that corre-sponds to the greatest value of load obtained prior to reaching the end-point deflection.Determine the corresponding deflec-tion value.10.5Calculate the peak strength using the peak load deter-mined in10.4,the average specimen dimensions determined in 9.8,and Eq1.Record the number rounded to the nearest0.05 MPa[5psi]as the peak strength,f P.10.6Determine the residual load values,P600D and P150D as appropriate for the specimen depth,corresponding to net deflection values of1⁄600and1⁄150of the span length.10.7Calculate the residual strengths,f600D and f150D using the residual loads determined in10.6,the average specimen dimensions determined in9.8,and Eq1.Record the numbers rounded to the nearest0.05MPa[5psi]as the residual strengths,f600D and f150D as appropriate for the specimen depth.10.8When required by the specifier of tests,determine the residual load(s)and calculate the residual strength(s)at the values of net deflection required by the specifier of tests at value(s)greater than1⁄600of the span length using the proce-dures in this section.Record the calculated value(s)rounded to the nearest0.05MPa[5psi]using the appropriate superscript and subscript(s)to indicate the specimen depth and net deflection(s)selected.For a specified net deflection d the subscript XXX is calculatedas:XXX 5Ld(2)10.9Calculate the total area under the load-deflection curve up to a net deflection of 1⁄150of the span length.Record the number rounded to the nearest Joule [10in.-lb]as toughness,T 150D as appropriate for the specimen depth.N OTE 14—If the load and deflection are measured in consistent units,such as Newtons (N)and metres (m),or kilonewtons (kN)and millimetres (mm),the resulting measure of energy will be in units known as Joules (J).10.10Calculate the equivalent flexural strength ratio,R T ,150Daccording to Eq 3using the first-peak strength determined in 10.3and the toughness determined in 10.9.Record the number rounded to the nearest 0.5%as equivalent flexural strengthratio,R T ,150Das appropriate for the specimen depth.R T ,150D 5150·T 150D f 1·b ·d 2·100%(3)11.Report11.1Report the following information:11.1.1Type of specimen (molded or sawn)and specimen identification numbers or symbols,11.1.2Average width and depth of specimen at the point of fracture to the nearest 1mm [0.05in.],11.1.3Span length to the nearest 2mm [0.1in.],11.1.4First-peak load,P 1,rounded to the nearest N (lbf),first-peak strength,f 1,to the nearest 0.05MPa [5psi],and first-peak deflection,d 1,to the nearest 0.01mm [0.0005in.],11.1.5Peak load,P P ,rounded to the nearest N [lbf],peak strength,f P ,to the nearest 0.05MPa [5psi],and peak-load deflection,d P ,to the nearest 0.01mm [0.0005in.],11.1.6Residual loads,P 600D and P 150Drounded to the nearest N [lbf],11.1.7Residual strengths,f 600D and f 150Drounded to the nearest 0.05MPa [5psi],11.1.8Toughness,T 150D rounded to the nearest Joule [10in.-lb],11.1.9Equivalent flexural strength ratio,R T ,150Drounded to the nearest 0.5%,11.1.10When required by the specifier of tests,the residualload(s),P XXX D and corresponding residual strength(s),f XXX D,rounded to the nearest N [lbf]and 0.05MPa [5psi],11.1.11Age of the specimens at the time of testing,in days,11.1.12Curing history and moisture condition of specimen at test,11.1.13Whether the specimen contact surfaces were ground or capped,11.1.14The rate(s)of increase of net deflection in mm/min [in./min]and the net deflection(s)at which the change(s)in deflection rate occurred in mm[in.].FIG.3Example of Parameter Calculations for First-Peak Load Equal to Peak Load (Not toScale)11.1.15Defects in specimen prior to test and abnormalities in specimen behavior during test,and 11.1.16The load-deflection curve.12.Precision and Bias12.1Precision —Tables 2and 3provide the repeatability standard deviations for the various parameters measured in this test method (see Note 15).The reproducibility of this test method is being determined.N OTE 15—The repeatability standard deviations were developed from analysis of a database composed of 26sets of three or four replicate test specimens that were tested by one operator using a closed-loop,servo-controlled hydraulic universal-testing machine.A test result is the mean value for each set of replicate test specimens.The concrete mixtures tested contained various steel fibers (10sets)or synthetic fibers (16sets)at different fiber contents.All test specimens had nominal dimensions of 102mm by 102mm by 356mm [4in.by 4in.by 14in.]and were tested on a 305mm [12in.]span.The test specimens for each set were either molded beams (19sets)or beams cut from shotcrete panels (7sets).12.2Bias —This test method has no bias since the properties determined can only be defined in terms of this test method.13.Keywords13.1fiber-reinforced concrete;first-peak strength;flexural toughness;peak strength;residual load;residualstrengthFIG.4Example of Parameter Calculations when Peak Load is Greater than First-Peak Load (Not toScale)。
英语六级长篇阅读拟练习及答案详解
英语六级长篇阅读拟练习及答案详解导读:我根据大家的需要整理了一份关于《英语六级长篇阅读拟练习及答案详解》的内容,具体内容:在英语学习过程中,阅读理解能力是学习者发展语言能力的基础和手段。
国内的各类英语考试中几乎都有阅读理解题型,大学英语六级考试也不例外。
大学英语六级阅读理解试题是试卷中分值最重的题型,为了提...在英语学习过程中,阅读理解能力是学习者发展语言能力的基础和手段。
国内的各类英语考试中几乎都有阅读理解题型,大学英语六级考试也不例外。
大学英语六级阅读理解试题是试卷中分值最重的题型,为了提高大家的阅读水平,下面是我为大家带来,希望对大家的学习有所帮助!英语六级长篇阅读模拟练习:Daylight Saving Time (DST) How and When Did Daylight Saving Time Start?A. Benjamin Franklin--of "early to bed and early to rise"fame--was apparently the first person to suggest the concept of daylight savings. While serving as U.S. ambassador to France in Pads, Franklin wrote of being awakened at 6 a.m. and realizing, to his surprise, that the sun would rise far earlier than he usually did. Imagine the resources that might be saved if he and others rose before noon and burned less midnight oil, Franklin, tongue half in cheek, wrote to a newspaper.B. It wasnt until World War I that daylight savings were realized on a grand scale. Germany was the first state to adopt the time changes, to reduce artificial lighting and thereby save coal for the war effort. Friends and foes soon followed suit. In the U.S.a federal law standardized the yearly start and end of daylight saving time in 1918--for the states that chose to observe it.C. During World War II the U.S. made daylight saving time mandatory(强制的) for the whole country, as a way to save wartime resources. Between February 9, 1942, and September 30, 1945, the government took it a step further. During this period daylight saving time was observed year-round, essentially making it the new standard time, if only for a few years. Many years later, the Energy Policy Act of 2005 was enacted, mandating a controversial month-long extension of daylight saving time, starting in 2007.Daylight Saving Time: Energy Saver or Just Time Sucker?D. In recent years several studies have suggested that daylight saving time doesnt actually save energy--and might even result in a net loss. Environmental economist Hendrik Wolff, of the University of Washington, co- authored a paper that studied Australian power-use data when parts of the country extended daylight saving time for the 2000 Sydney Olympics and others did not. The researchers found that the practice reduced lighting and electricityconsumption in the evening but increased energy use in the now dark mornings-- wiping out the evening gains. Thats because the extra hour that daylight saving time adds in the evening is a hotter hour. "So if people get home an hour earlier in a wanner house, they turn on their air conditioning," the University of Washingtons Wolff said.E. But other studies do show energy gains. In an October 2008 daylight saving time report to Congress, mandated by the same 2005 energy act that extended daylight saving time, the U.S. Department of Energy asserted that springing forward does save energy. Extended daylight saving time saved 1.3 terawatt ( 太瓦 ) hours of electricity. That figure suggests that daylight saving time reduces annual U.S. electricity consumption by 0.03 percent and overall energy consumption by 0.02 percent. While those percentages seem small, they could represent significant savings because of the nations enormous total energy use.F. Whats more, savings in some regions are apparently greater than in others. California, for instance, appears to benefit most from daylight saving time--perhaps because its relatively mild weather encourages people to stay outdoors later. The Energy Department report found that daylight saving time resulted in an energy savings of one percent daily in the state.G. But Wolff, one of many scholars who contributed to the federal report, suggested that the numbers were subject to statistical variability ( 变化) and shouldnt be taken as hard facts. And daylight savings energy gains in the U.S. largely depend on your location in relation to the Mason-Dixon Line, Wolff said."The North might be a slight winner, because the North doesnt have as much air conditioning," he said. "But the South is a definite loser in terms of energy consumption. The South has more energy consumption under daylight saving."Daylight Saving Time: Healthy or Harmful?H. For decades advocates of daylight savings have argued that, energy savings or no, daylight saving time boosts health by encouraging active lifestyles--a claim Wolff and colleagues are currently putting to the test. "In a nationwide American time-use study, were clearly seeing that, at the time of daylight saving time extension in the spring, television watching is substantially reduced and outdoor behaviors like jogging, walking, or going to the park are substantially increased," Wolff said. "Thats remarkable, because of course the total amount of daylight in a given day is the same. "I. But others warn of ill effects. Till Roenneberg, a university professor in Munich (慕尼黑), Germany, said his studies show thatour circadian (生理节奏的 ) body clocks--set by light and darkness--never adjust to gaining an "extra" hour of sunlight to the end of the day during daylight saving time.J. One reason so many people in the developed world are chronically (长期地) overtired, he said, is that they suffer from"social jet lag. "In other words, their optimal circadian sleep periods dont accord with their actual sleep schedules. Shifting daylight from morning to evening only increases this lag, he said. "Light doesnt do the same things to the body in the morning and the evening. More light in the morning would advance the body clock, and that would be good. But more light in the evening would even further delay the body clock. "K. Other research hints at even more serious health risks. A 2008 study concluded that, at least in Sweden, heart attack risks go up in the days just after the spring time change. "The most likely explanation to our findings is disturbed sleep and disruption of biological rhythms," One expert told National Geographic News via email.Daylight Savings Lovers and HatersL. With verdicts (定论) on the benefits, or costs, of daylight savings so split, it may be no surprise that the yearly time changes inspire polarized reactions. In the U.K., for instance, the LighterLater movement--part of 10:10,a group advocating cutting carbon emissions--argues for a sort of extreme daylight savings. First, they say,move standard time forward an hour, then keep observing daylight saving time as usual--adding two hours ofevening daylight to what we currently consider standard time. The folks behind Standardtime, on the other hand, want to abolish daylight saving time altogether, calling energy-efficiency claims "unproven. "M. National telephone surveys by Rasmussen Reports from spring 2010 and fall 2009 deliver the same answer.Most people just "dont think the time change is worth the hassle (麻烦的事 ). " Forty-seven percent agreedwith that statement, while only 40 percent disagreed. But Seize the Daylight author David Prerau said his research on daylight saving time suggests most people are fond of it."I think if you ask most people if they enjoy having an extra hour of daylight in the evening eight months a year, the response would be pretty positive."46. Daylight savings energy gains might be various due to different climates.47. Disturbed sleep and disruption of biological rhythms may be the best explanation to higher heart attack risks in the days after the spring time change.48. A research indicated that DST might not save energy byincreasing energy use in the dark mornings, though it reduced lighting and electricity consumption in the evening.49. Germany took the lead in saving wardme resources by adopting the time changes and reducing artificiallighting.50. A university professor studied the effect of daylight saving time and sounded the alarm of its negative effects.51. Social jet lag can partly account for peoples chronic fatigue syndrome in developed countries.52. The figure of a study in the U.S. suggested that DST could save a lot of energy nationally.53. Supporters of daylight savings have long considered daylight saving time does good to peoples health.54. A group advocating cutting carbon emissions launches the Lighter Later movement to back a kind of extreme daylight savings.55. A scholar contributing to a federal report suggested that the amount of saved energy had something to do with geographic position.【参考译文】夏令时夏令时是如何开始的?何时开始的?A.享有"早睡早起"声誉的本杰明富兰克林显然是提出夏令时这一理念的第一人。
XPSPEAK 说明书
Using XPSPEAK Version 4.1 November 2000Contents Page Number XPS Peak Fitting Program for WIN95/98 XPSPEAK Version 4.1 (1)Program Installation (1)Introduction (1)First Version (1)Version 2.0 (1)Version 3.0 (1)Version 3.1 (2)Version 4.0 (2)Version 4.1 (2)Future Versions (2)General Information (from R. Kwok) (3)Using XPS Peak (3)Overview of Processing (3)Appearance (4)Opening Files (4)Opening a Kratos (*.des) text file (4)Opening Multiple Kratos (*.des) text files (5)Saving Files (6)Region Parameters (6)Loading Region Parameters (6)Saving Parameters (6)Available Backgrounds (6)Averaging (7)Shirley + Linear Background (7)Tougaard (8)Adding/Adjusting the Background (8)Adding/Adjusting Peaks (9)Peak Types: p, d and f (10)Peak Constraints (11)Peak Parameters (11)Peak Function (12)Region Shift (13)Optimisation (14)Print/Export (15)Export (15)Program Options (15)Compatibility (16)File I/O (16)Limitations (17)Cautions for Peak Fitting (17)Sample Files: (17)gaas.xps (17)Cu2p_bg.xps (18)Kratos.des (18)ASCII.prn (18)Other Files (18)XPS Peak Fitting Program for WIN95/98 XPSPEAKVersion 4.1Program InstallationXPS Peak is freeware. Please ask RCSMS lab staff for a copy of the zipped 3.3MB file, if you would like your own copyUnzip the XPSPEA4.ZIP file and run Setup.exe in Win 95 or Win 98.Note: I haven’t successfully installed XPSPEAK on Win 95 machines unless they have been running Windows 95c – CMH.IntroductionRaymond Kwok, the author of XPSPEAK had spent >1000 hours on XPS peak fitting when he was a graduate student. During that time, he dreamed of many features in the XPS peak fitting software that could help obtain more information from the XPS peaks and reduce processing time.Most of the information in this users guide has come directly from the readme.doc file, automatically installed with XPSPEAK4.1First VersionIn 1994, Dr Kwok wrote a program that converted the Kratos XPS spectral files to ASCII data. Once this program was finished, he found that the program could be easily converted to a peak fitting program. Then he added the dreamed features into the program, e.g.∙ A better way to locate a point at a noise baseline for the Shirley background calculations∙Combine the two peaks of 2p3/2 and 2p1/2∙Fit different XPS regions at the same timeVersion 2.0After the first version and Version 2.0, many people emailed Dr Kwok and gave additional suggestions. He also found other features that could be put into the program.Version 3.0The major change in Version 3.0 is the addition of Newton’s Method for optimisation∙Newton’s method can greatly reduce the optimisation time for multiple region peak fitting.Version 3.11. Removed all the run-time errors that were reported2. A Shirley + Linear background was added3. The Export to Clipboard function was added as requested by a user∙Some other minor graphical features were addedVersion 4.0Added:1. The asymmetrical peak function. See note below2. Three additional file formats for importing data∙ A few minor adjustmentsThe addition of the Asymmetrical Peak Function required the peak function to be changed from the Gaussian-Lorentzian product function to the Gaussian-Lorentzian sum function. Calculation of the asymmetrical function using the Gaussian-Lorentzian product function was too difficult to implement. The software of some instruments uses the sum function, while others use the product function, so both functions are available in XPSPEAK.See Peak Function, (Page 12) for details of how to set this up.Note:If the selection is the sum function, when the user opens a *.xps file that was optimised using the Gaussian-Lorentzian product function, you have to re-optimise the spectra using the Gaussian-Lorentzian sum function with a different %Gaussian-Lorentzian value.Version 4.1Version 4.1 has only two changes.1. In version 4.0, the printed characters were inverted, a problem that wasdue to Visual Basic. After about half year, a patch was received from Microsoft, and the problem was solved by simply recompiling the program2. The import of multiple region VAMAS file format was addedFuture VersionsThe author believes the program has some weakness in the background subtraction routines. Extensive literature examination will be required in order to revise them. Dr Kwok intends to do that for the next version.General Information (from R. Kwok)This version of the program was written in Visual Basic 6.0 and uses 32 bit processes. This is freeware. You may ask for the source program if you really want to. I hope this program will be useful for people without modern XPS software. I also hope that the new features in this program can be adopted by the XPS manufacturers in the later versions of their software.If you have any questions/suggestions, please send an email to me.Raymund W.M. KwokDepartment of ChemistryThe Chinese University of Hong KongShatin, Hong KongTel: (852)-2609-6261Fax:(852)-2603-5057email: rmkwok@.hkI would like to thank the comments and suggestions from many people. For the completion of Version 4.0, I would like to think Dr. Bernard J. Flinn for the routine of reading Leybold ascii format, Prof. Igor Bello and Kelvin Dickinson for providing me the VAMAS files VG systems, and my graduate students for testing the program. I hope I will add other features into the program in the near future.R Kwok.Using XPS PeakOverview of Processing1. Open Required Files∙See Opening Files (Page 4)2. Make sure background is there/suitable∙See Adding/Adjusting the Background, (Page 8)3. Add/adjust peaks as necessary∙See Adding/Adjusting Peaks, (Page 9), and Peak Parameters, (Page 11)4. Save file∙See Saving Files, (Page 6)5. Export if necessary∙See Print/Export, (Page 15)AppearanceXPSPEAK opens with two windows, one above the other, which look like this:∙The top window opens and displays the active scan, adds or adjusts a background, adds peaks, and loads and saves parameters.∙The lower window allows peak processing and re-opening and saving dataOpening FilesOpening a Kratos (*.des) text file1. Make sure your data files have been converted to text files. See the backof the Vision Software manual for details of how to do this. Remember, from the original experiment files, each region of each file will now be a separate file.2. From the Data menu of the upper window, choose Import (Kratos)∙Choose directory∙Double click on the file of interest∙The spectra open with all previous processing INCLUDEDOpening Multiple Kratos (*.des) text files∙You can open up a maximum of 10 files together.1. Open the first file as above∙Opens in the first region (1)2. In the XPS Peak Processing (lower) window, left click on 2(secondregion), which makes this region active3. Open the second file as in Step2, Opening a Kratos (*.des) text file,(Page 4)∙Opens in the second region (2)∙You can only have one description for all the files that are open. Edit with a click in the Description box4. Open further files by clicking on the next available region number thenfollowing the above step.∙You can only have one description for all the files that are open. Edit with a click in the Description boxDescriptionBox 2∙To open a file that has already been processed and saved using XPSPEAK, click on the Open XPS button in the lower window. Choose directory and file as normal∙The program can store all the peak information into a *.XPS file for later use. See below.Saving Files1. To save a file click on the Save XPS button in the lower window2. Choose Directory3. Type in a suitable file name4. Click OK∙Everything that is open will be saved in this file∙The program can also store/read the peak parameter files (*.RPA)so that you do not need to re-type all the parameters again for a similar spectrum.Region ParametersRegion Parameters are the boundaries or limits you have used to set up the background and peaks for your files. These values can be saved as a file of the type *.rpa.Note that these Region Parameters are completely different from the mathematical parameters described in Peak Parameters, (Page 11) Loading Region Parameters1. From the Parameters menu in the upper window, click on Load RegionParameters2. Choose directory and file name3. Click on Open buttonSaving Parameters1. From the Parameters menu in the XPS Peak Fit (Upper) window, clickon Save Region Parameters2. Choose directory and file name3. Click on the Save buttonAvailable BackgroundsThis program provides the background choices of∙Shirley∙Linear∙TougaardAveraging∙ Averaging at the end points of the background can reduce the time tofind a point at the middle of a noisy baseline∙ The program includes the choices of None (1 point), 3, 5, 7, and 9point average∙ This will average the intensities around the binding energy youselect.Shirley + Linear Background1. The Shirley + Linear background has been added for slopingbackgrounds∙ The "Shirley + Linear" background is the Shirley background plus astraight line with starting point at the low BE end-point and with a slope value∙ If the slope value is zero , the original Shirley calculation is used∙ If the slope value is positive , the straight line has higher values atthe high BE side, which can be used for spectra with higher background intensities at the high BE side∙ Similarly, a negative slope value can be used for a spectrum withlower background intensities at the high BE side2. The Optimization button may be used when the Shirley background is higher at some point than the signal intensities∙ The program will increase the slope value until the Shirleybackground is below the signal intensities∙ Please see the example below - Cu2p_bg.xps - which showsbackground subtraction using the Shirley method (This spectrum was sent to Dr Kwok by Dr. Roland Schlesinger).∙ A shows the problematic background when the Shirley backgroundis higher than the signal intensities. In the Shirley calculation routine, some negative values were generated and resulted in a non-monotonic increase background∙ B shows a "Shirley + Linear" background. The slope value was inputby trial-and-error until the background was lower than the signal intensities∙ C was obtained using the optimisation routineA slope = 0B slope = 11C slope = 15.17Note: The background subtraction calculation cannot completely remove the background signals. For quantitative studies, the best procedure is "consistency". See Future Versions, (Page 2).TougaardFor a Tougaard background, the program can optimise the B1 parameter by minimising the "square of the difference" of the intensities of ten data points in the high binding energy side of the range with the intensities of the calculated background.Adding/Adjusting the BackgroundNote: The Background MUST be correct before Peaks can be added. As with all backgrounds, the range needs to include as much of your peak as possible and as little of anything else as possible.1. Make sure the file of interest is open and the appropriate region is active2. Click on Background in the upper window∙The Region 0 box comes up, which contains the information about the background3. Adjust the following as necessary. See Note.∙High BE (This value needs to be within the range of your data) ∙Low BE (This value needs to be within the range of your data) NOTE: High and Low BE are not automatically within the range of your data. CHECK CAREFULLY THAT BOTH ENDS OF THE BACKGROUND ARE INSIDE THE EDGE OF YOUR DATA. Nothing will happen otherwise.∙No. of Ave. Pts at end-points. See Averaging, (Page 7)∙Background Type∙Note for Shirley + Linear:To perform the Shirley + Linear Optimisation routine:a) Have the file of interest openb) From the upper window, click on Backgroundc) In the resulting box, change or optimise the Shirley + LinearSlope as desired∙Using Optimize in the Shirley + Linear window can cause problems. Adjust manually if necessary3. Click on Accept when satisfiedAdding/Adjusting PeaksNote: The Background MUST be correct before peaks can be added. Nothing will happen otherwise. See previous section.∙To add a peak, from the Region Window, click on Add Peak ∙The peak window appears∙This may be adjusted as below using the Peak Window which will have opened automaticallyIn the XPS Peak Processing (lower) window, there will be a list of Regions, which are all the open files, and beside each of these will be numbers representing the synthetic peaks included in that region.Regions(files)SyntheticPeaks1. Click on a region number to activate that region∙The active region will be displayed in the upper window2. Click on a peak number to start adjusting the parameters for that peak.∙The Processing window for that peak will open3. Click off Fix to adjust the following using the maximum/minimum arrowkeys provided:∙Peak Type. (i.e. orbital – s, p, d, f)∙S.O.S (Δ eV between the two halves of the peak)∙Position∙FWHM∙Area∙%Lorenzian-Gaussian∙See the notes for explanations of how Asymmetry works.4. Click on Accept when satisfiedPeak Types: p, d and f.1. Each of these peaks combines the two splitting peaks2. The FWHM is the same for both the splitting peaks, e.g. a p-type peakwith FWHM=0.7eV is the combination of a p3/2 with FWHM at 0.7eV anda p1/2 with FWHM at 0.7eV, and with an area ratio of 2 to 13. If the theoretical area ratio is not true for the split peaks, the old way ofsetting two s-type peaks and adding the constraints should be used.∙The S.O.S. stands for spin orbital splitting.Note: The FWHM of the p, d or f peaks are the FWHM of the p3/2,d5/2 or f7/2, respectively. The FWHM of the combined peaks (e.g. combination of p3/2and p1/2) is shown in the actual FWHM in the Peak Parameter Window.Peak Constraints1. Each parameter can be referenced to the same type of parameter inother peaks. For example, for four peaks (Peak #0, 1, 2 and 3) with known relative peak positions (0.5eV between adjacent peaks), the following can be used∙Position: Peak 1 = Peak 0 + 0.5eV∙Position: Peak 2 = Peak 1 + 0.5eV∙Position: Peak 3 = Peak 2 + 0.5eV2. You may reference to any peak except with looped references.3. The optimisation of the %GL value is allowed in this program.∙ A suggestion to use this feature is to find a nice peak for a certain setting of your instrument and optimise the %GL for this peak.∙Fix the %GL in the later peak fitting process when the same instrument settings were used.4. This version also includes the setting of the upper and lower bounds foreach parameter.Peak ParametersThis program uses the following asymmetric Gaussian-Lorentzian sumThe program also uses the following symmetrical Gaussian-Lorentzian product functionPeak FunctionNote:If the selection is the sum function, when the user opens a *.xps file that was optimised using the Gaussian-Lorentzian product function, you have to re-optimise the spectra using the Gaussian-Lorentzian sum function with a different %Gaussian-Lorentzian value.∙You can choose the function type you want1. From the lower window, click on the Options button∙The peak parameters box comes up∙Select GL sum for the Gaussian-Lorentzian sum function∙Select GL product for the Gaussian-Lorentzian product function. 2. For the Gaussian-Lorentzian sum function, each peak can have sixparameters∙Peak Position∙Area∙FWHM∙%Gaussian-Lorentzian∙TS∙TLIf anyone knows what TS or TL might be, please let me know. Thanks, CMH3. Each peak in the Gaussian-Lorentzian product function can have fourparameters∙Peak Position∙Area∙FWHM∙%Gaussian-LorentzianSince peak area relates to the atomic concentration directly, we use it as a peak parameter and the peak height will not be shown to the user.Note:For asymmetric peaks, the FWHM only refers to the half of the peak that is symmetrical. The actual FWHM of the peak is calculated numerically and is shown after the actual FWHM in the Peak Parameter Window. If the asymmetric peak is a doublet (p, d or f type peak), the actual FWHM is the FWHM of the doublet.Region ShiftA Region Shift parameter was added under the Parameters menu∙Use this parameter to compensate for the charging effect, the fermi level shift or any change in the system work function∙This value will be added to all the peak positions in the region for fitting purposes.An example:∙ A polymer surface is positively charged and all the peaks are shifted to the high binding energy by +0.5eV, e.g. aliphatic carbon at 285.0eV shifts to 285.5eV∙When the Region Shift parameter is set to +0.5eV, 0.5eV will be added to all the peak positions in the region during peak fitting, but the listed peak positions are not changed, e.g. 285.0eV for aliphatic carbon. Note: I have tried this without any actual shift taking place. If someone finds out how to perform this operation, please let me know. Thanks, CMH.In the meantime, I suggest you do the shift before converting your files from the Vision Software format.OptimisationYou can optimise:1. A single peak parameter∙Use the Optimize button beside the parameter in the Peak Fitting window2. The peak (the peak position, area, FWHM, and the %GL if the "fix" box isnot ticked)∙Use the Optimize Peak button at the base of the Peak Fitting window3. A single region (all the parameters of all the peaks in that region if the"fix" box is not ticked)∙Use the Optimize Region menu (button) in the upper window4. All the regions∙Use the Optimize All button in the lower window∙During any type of optimisation, you can press the "Stop Fitting" button and the program will stop the process in the next cycle.Print/ExportIn the XPS Peak Fit or Region window, From the Data menu, choose Export or Print options as desiredExport∙The program can export the ASCII file of spectrum (*.DAT) for making high quality figures using other software (e.g. SigmaPlot)∙It can export the parameters (*.PAR) for further calculations (e.g. use Excel for atomic ratio calculations)∙It can also copy the spectral image to the system clipboard so that the spectral image can be pasted into a document (e.g. MS WORD). Program Options1. The %tolerance allows the optimisation routine to stop if the change inthe difference after one loop is less that the %tolerance2. The default setting of the optimisation is Newton's method∙This method requires a delta value for the optimisation calculations ∙You may need to change the value in some cases, but the existing setting is enough for most data.3. For the binary search method, it searches the best fit for each parameterin up to four levels of value ranges∙For example, for a peak position, in first level, it calculates the chi^2 when the peak position is changed by +2eV, +1.5eV, +1eV, +0.5eV,-0.5eV, -1eV, -1.5eV, and -2eV (range 2eV, step 0.5eV) ∙Then, it selects the position value that gives the lowest chi^2∙In the second level, it searches the best values in the range +0.4eV, +0.3eV, +0.2eV, +0.1eV, -0.1eV, -0.2eV, -0.3eV, and -0.4eV (range0.4eV, step 0.1eV)∙In the third level, it selects the best value in +0.09eV, +0.08eV, ...+0.01eV, -0.01eV, ...-0.09eV∙This will give the best value with two digits after decimal∙Level 4 is not used in the default setting∙The range setting and the number of levels in the option window can be changed if needed.4. The Newton's Method or Binary Search Method can be selected byclicking the "use" selection box of that method.5. The selection of the peak function is also in the Options window.6. The user can save/read the option parameters with the file extension*.opa∙The program reads the default.opa file at start up. Therefore, the user can customize the program options by saving the selectionsinto the default.opa file.CompatibilityThe program can read:∙Kratos text (*.des) files together with the peak fitting parameters in the file∙The ASCII files exported from Phi's Multiplex software∙The ASCII files of Leybold's software∙The VAMAS file format∙For the Phi, Leybold and VAMAS formats, multiple regions can be read∙For the Phi format, if the description contains a comma ",", the program will give an error. (If you get the error, you may use any texteditor to remove the comma)The program can also import ASCII files in the following format:Binding Energy Value 1 Intensity Value 1Binding Energy Value 2 Intensity Value 2etc etc∙The B.E. list must be in ascending or descending order, and the separation of adjacent B.E.s must be the same∙The file cannot have other lines before and after the data∙Sometimes, TAB may cause a reading error.File I/OThe file format of XPSPEAK 4.1 is different from XPSPEAK 3.1, 3.0 and 2.0 ∙XPSPEAK 4.1 can read the file format of XPSPEAK 3.1, 3.0 and 2.0, but not the reverse∙File format of 4.1 is the same as that of 4.0.LimitationsThis program limits the:∙Maximum number of points for each spectrum to 5000∙Maximum of peaks for all the regions to 51∙For each region, the maximum number of peaks is 10. Cautions for Peak FittingSome graduate students believe that the fitting parameters for the best fitted spectrum is the "final answer". This is definitely not true. Adding enough peaks can always fit a spectrum∙Peak fitting only assists the verification of a model∙The user must have a model in mind before adding peaks to the spectrum!Sample Files:gaas.xpsThis file contains 10 spectra1. Use Open XPS to retrieve the file. It includes ten regions∙1-4 for Ga 3d∙5-8 for Ga 3d∙9-10 for S 2p2. For the Ga 3d and As 3d, the peaks are d-type with s.o.s. = 0.3 and 0.9respectively3. Regions 4 and 8 are the sample just after S-treatment4. Other regions are after annealing5. Peak width of Ga 3d and As 3d are constrained to those in regions 1 and56. The fermi level shift of each region was determined using the As 3d5/2peak and the value was put into the "Region Shift" of each region7. Since the region shift takes into account the Fermi level shift, the peakpositions can be easily referenced for the same chemical components in different regions, i.e.∙Peak#1, 3, 5 of Ga 3d are set equal to Peak#0∙Peak#8, 9, 10 of As 3d are set equal to Peak#78. Note that the %GL value of the peaks is 27% using the GL sum functionin Version 4.0, while it is 80% using the GL product function in previous versions.18 Cu2p_bg.xpsThis spectrum was sent to me by Dr. Roland Schlesinger. It shows a background subtraction using the Shirley + Linear method∙See Shirley + Linear Background, (Page 7)Kratos.des∙This file shows a Kratos *.des file∙This is the format your files should be in if they have come from the Kratos instrument∙Use import Kratos to retrieve the file. See Opening Files, (Page 4)∙Note that the four peaks are all s-type∙You may delete peak 2, 4 and change the peak 1,3 to d-type with s.o.s. = 0.7. You may also read in the parameter file: as3d.rpa. ASCII.prn∙This shows an ASCII file∙Use import ASCII to retrieve the file∙It is a As 3d spectrum of GaAs∙In order to fit the spectrum, you need to first add the background and then add two d-type peaks with s.o.s.=0.7∙You may also read in the parameter file: as3d.rpa.Other Files(We don’t have an instrument that produces these files at Auckland University., but you may wish to look at them anyway. See the readme.doc file for more info.)1. Phi.asc2. Leybold.asc3. VAMAS.txt4. VAMASmult.txtHave Fun! July 1, 1999.。
电力定价优化模型:基于峰谷TOU价格的住宅定价说明书
Optimization Model for Residential Tiered Electricity Pricing Based on Peak-Valley TOU PriceL. Yang, K.T. Chen, Z.F. Tan School of Economics and Management North China Electric Power University Changping District, Beijing, ChinaB.B. ZhouLiaoning Province Power Company Ningbo Road, Shenyang, Liaoning, ChinaAbstract—In recent years, with the shortage of energy supply and tremendous of environmental pressure in China, the price of primary energy such as coal continues to rise, as well as the electricity price. However, the adjustable amplitude and frequency for residential electricity are lower than other industries. In order to construct resource conserving and environment friendly society, to gradually reduce the price of cross-subsidization and guide residents to save electricity, it is necessary to implement the residential tiered electricity pricing. This paper optimizes the model of residential tiered electricity pricing through the introduction of peak-valley TOU price, which lays the foundation for promotion of power system reform.Keywords-Residential electricity price; tiered electricity pricing; peak-valley TOU price; modelI.I NTRODUCTIONElectric power industry is an important basic industry of the national economy, and is also an important part of social public utilities. After years of efforts, China’s power system reform has achieved initial results. The price reform is one of the core content of electricity market reform. Throughout the reform system, the tariff is an important economic lever. It not only can optimize the resources allocation, but also can adjust the relations among various interests [1, 2].Residential electricity consumption is an extremely important part for electricity sales market. The establishment of residential electricity price involves thousands of families, and is related to vital interests and living standards of the masses, as well as social efficiency, effectiveness and fairness [3]. Therefore, it is significant to establish a scientific and reasonable price system for the residents. This paper introduces peak-valley TOU price to design and optimize the model of residential tiered electricity pricing, and then obtains the optimization model for operation cost of the system.II.R ESEARCH S TATUS FOR R ESIDENTIAL T IEREDE LECTRICITY P RICINGIn China, the tiered pricing should be described to be the increasing price by ladder. It is refers to replace the current residential price of a single form with the approach of segmented pricing according to residential consumption, in this pricing method, the price of electricity increases gradually in a stepwise form along with the growth of electricity consumption [4,5]. The tiered electricity price divide power level of residential consumption in accordance with three stages of “meet the basic demand”, ”meet the normal and reasonable demand” and ”meet the high quality electricity demand”. Then, the corresponding price is set up. The tariff implements principle of stepping increment [6].Although the existing tiered electricity pricing system has been promoted and has achieved the electricity saving benefit, this system has not considered the distribution of load and lacked reaction for electricity value in peak or valley period. Actually, electric power often needs more standby unit for power generation to meet the residents' consumption in the peak period, so the generation cost is high. Additionally, the load demand is low in valley period, so many units have not been called and utilization efficiency of units is not high. If we can guide residents to use electricity in the valley time, the reducing peak and filling valley will be achieved, and the utilization efficiency of units will be improved [7, 8]. Therefore, this paper introduces the peak-valley TOU price in residential tiered electricity price, and then optimizes the sub-file number, sub-file power and block-tariff.III.D ESIGN M ODEL FOR R ESIDENTIAL T IEREDE LECTRICITY P RICINGTo guide residents using electricity rationally, tiered electricity pricing has been introduced. The upper tiered electricity pricing optimization model is constructed to differ from the traditional concept, targeting as the minimal electricity cost for residents. Optimization cycle is 24h in this paper in order to combine the tiered electricity pricing with the peak-valley price. Specific goal function is as follows.()()1,1,2,2,21,2,21,2,11minT It t i t i t i t i t i t i tt iC P Q P Q Q P Q Q−++===×+×−+×−∑∑(1)In this formula,1,tP refers to electricity price for thefirst-file resident at t time.1,tQ is electricity consumption for the first-file resident at t time.,i tP refers to electricity price for i-file resident at t time.,i tQ is electricity consumption for i-file resident at t time.Introducing tiered electricity price should consider the psychological strategy for residents. For the goal of reducing electricity costs and consumption, electricity costs of some users would rise after implementing tiered electricity price. In order to facilitate the expression, the comparison function()12,F x xis defined.()121211,,0,x xF x xx x>=≤(2)(1) Electricity cost constraintInternational Conference on Computer Information Systems and Industrial Applications (CISIA 2015)Electricity costs of some users should remain unchanged after implementing tiered electricity price. If total resident electricity is m, then:()11,Ii ii F C C Iλ=≥∑ (3)In this formula, i C and iC are electricity costs before and after introducing tiered electricity price for the resident i. 1λ is proportional coefficient which refers to the proportion of residents whose electricity cost is not higher than the cost before tiered electricity price.i i i C P Q =× (4)1Jiij ijj C P Q ==×∑ (5) In formulas above, i P and iQ refer to electricity cost and consumption before introducing tiered electricity price for the resident i. ij P and ij Q refer to electricity cost and consumption after introducing tiered electricity price for the resident i in j-file. At the same time, to ensure the implementation of tiered electricity price, electricity consumption for a certain percentage of residents should cross at least two intervals after implementing tiered electricity price, then: ()112,Ij i F Q Q I λ=≥∑ (6) In this formula, 2λis the proportion of residents whoseelectricity consumptions have crossed at least two intervals. To reduce residential reaction degree after introducingtiered electricity price, the basic electricity demand of residents should be limited, it is as follows.1i Q Q≥ (7)Q is the basic electricity demands of residents.After determining the number of sub-grade, the block-tariff *ij P and block-electricity *ij Q can be obtained by solving the model above.IV.D ESIGN M ODEL FOR P EAK -V ALLEY TOU P RICEFurther, TOU price is introduced to reflect the time valueof electricity. The main psychological factor of residents to respond TOU price is to minimize electricity costs. Therefore, residential peak-valley TOU price model is constructed as the goal of minimal electricity costs. The target function is as follows:11min T Iit itt i C P Q ===∑∑ (8)In this formula, it P and it Q are tariff and electricity consumption for resident i at t moment after introducing TOU price.In order to ensure the load shifting effect of peak-valleyTOU price, a certain proportion of residential electricity peak-valley difference should be decreased, the specific constraint is that:()()max min max min 13,mi i i i i F Q Q Q Q Iλ= −−≥∑ (9)In this formula, max iQand max iQare maximum load forresidents in peak period before and after TOU price. min iQ and min i Q are minimum load for residents in valley period beforeand after TOU price. 3λ is residential proportion whoproduce the load shifting effect./1p p i i P P < (10)/1v v i i PP ≥ (11) In the formulas, p i P and p iP are tariff for resident i in peak period before and after using TOU price. v i P and v iP are tariff for resident i in valley period before and after using TOU price.Considering different price characteristics of timesharingand multi-level in peak-valley step price, a concept of elastic coefficient with peak-valley and multi-level has put forward. For each resident, the tiered-TOU price in each levelcorresponds to an elasticity coefficient, so electricity consumption of the resident in each level is determined by peak-valley elasticity of multi-level, which can be described as follows.()()()()////p p p p i i ip i i v v v v i i iv i i Q Q e Q Q Q Q e Q Q ∆=∆∆=∆(12)In this formula, ijp Q and ijv Q are electricity for resident i at j level in peak and valley periods when implementing a single price (ijp Q =ijvQ ). After introducing peak-valley step price, change amounts of electricity for resident i at j level in peakand valley periods are that: ijp ijp ijp Q Q Q ∆=−,ijv ijv ijv Q Q Q ∆=− . e ij is the demand elasticity for resident i at j level.Solving the model above, we can get optimal tariffs and electricity consumptions in peak and valley periods. Combined with the tiered price in section 2, the residential peak-valley step price can be formed.V. O PTIMIZATION M ODEL FOR P EAK -V ALLEY S TEP P RICE The implementation of residential peak-valley step price will change electrical behavior and transfer using times of residents, which will directly affect the operation cost of the system. In order to ensure the stable operation of the system, the basic benefits of power system should be guaranteed. Therefore, an optimization model for peak-valley step price is constructed as the goal of maximizing system operation efficiency. The goal function is as follows.()111111max TTm m m m t t it st it it st it t t i i i i R R C c Q C c Q π====== =−=−−−∑∑∑∑∑∑ (13) In this formula, t R and tR are system profits before and after implementing peak-valley step price. st c refers to power purchase price for power company.In order to optimize the system operation, system power efficiency should be promoted when reducing residential electricity cost. Specific constraints are as follows.Firstly, changes of electricity sales profits for power companies are in a certain range. That is:(14)Secondly, electricity sales profits should be higher than system operating costs C op after implementing peak-valley step price:(15)Lastly, change magnitude of the total average price should be in a certain range:1121Ii i Iii C P P Q ξξ==−≤≤−∑∑ (16)In this formula, ξ1and ξ2 are constants.Although the objective function is to reduce power consumption, electricity should satisfy the following formula after the introduction of peak-valley step price in order to improve utilization rates of existing power generating equipment.1Igen i geni kQ Q Q =<<∑ (17)In this formula, Q gen refers to generation capacity. k (0<k <1)is a scaling factor to indicate a minimum utilization of power generation equipment.The characteristic of peak-valley step price determines the following relationship among tariffs:max1max10,1,2,,10,1,2,,1p p i i i v v i i i P P P i N P P P i N ++ <<≤=− <<≤=− (18)In this formula, the upper limit of tariff P is decided byelectricity consumption level, policy, economy and other factors, which results in some differences.VI.C ONCLUSIONSIn order to reflect the time value of electricity, this paper introduces peak-valley TOU price under the traditional residential tiered electricity price model, so peak-valley TOU price model is constructed. While the promotion of residential peak-valley TOU price directly influences the system operation cost, in order to ensure stable operation of thesystem, this paper constructs the optimization model forpeak-valley step price with the goal of maximizing system operation benefit.Optimization for residential tiered electricity price plays an important role in promoting the system to consume the random power resources. The final optimized model can promote random power resources into the grid, so the power output of thermal power unit will be reduced, as well as the cost of power generation system. Finally, the significant benefits would be created in economy and environment.R EFERENCES[1] Wu Jianhong. Pricing Model of Tiered Electricity Pricing for Residentsand Policy Simulation Based on Social Equilibrium [D]. North China Electric Power University, 2013, 4-7.[2] National Development and Reform Commission improves residentialtiered electricity price. National Energy Administration, /2013-12/26/c_132998400.htm[3] Wang Ruichun. Analysis of different pricing scheme under the guidanceof residential tiered electricity price [J]. Water Resources and Power, 2013, 31(1), 215-218.[4] Chen Minjun, Ci Xiangyang, Ping Zongfei. Residents Ladder ElectricityPrice Effect Evaluation Based on Analytic Hierarchy Process [J]. Science Technology and Industry, 2014, 14(9), 88-91.[5] Li Gen. Implementation Status and Improvement Strategy of China'sResidents Ladder Price[J]. Information and Communication, 2013, (2), 271-272.[6] ZENG Ming, LI Na, LIU Chao. Energy-Saving Assessment of TieredPricing Program for Residential Electricity Based on Utility Function [J]. East China Electric Power, 2011, 39 (8), 1215-1219.[7] HUANG Hai-tao. Design Model for Residential Block ElectricityPricing Structure and Level [J]. East China Electric Power, 2012, 40 (5), 0721-0727.[8] ZENG Ming. Assessment of Tiered Pricing Program for ResidentialElectricity Based on the Multiple Indexes [J]. East China Electric Power, 2012, 40 (3), 0359-0362.5R RRλ−≤ 1mi opi C C =≥∑。
- 1、下载文档前请自行甄别文档内容的完整性,平台不提供额外的编辑、内容补充、找答案等附加服务。
- 2、"仅部分预览"的文档,不可在线预览部分如存在完整性等问题,可反馈申请退款(可完整预览的文档不适用该条件!)。
- 3、如文档侵犯您的权益,请联系客服反馈,我们会尽快为您处理(人工客服工作时间:9:00-18:30)。
第36卷第9期电网技术V ol. 36 No. 9 2012年9月Power System Technology Sep. 2012文章编号:1000-3673(2012)09-0232-06 中图分类号:TM 919 文献标志码:A 学科代码:470·4054 电池储能系统恒功率削峰填谷优化策略研究陈满1,陆志刚2,刘怡2,丁泽俊2,饶宏2,鲍冠南3,陆超3(1.南方电网调峰调频发电公司,广东省广州市 510630;2.南方电网科学研究院,广东省广州市 510080;3.清华大学电机系,北京市海淀区 100084)Research on Optimal Peak Load Shifting Strategy ofBattery Energy Storage System Operated in Constant Power Mode CHEN Man1, LU Zhigang2, LIU Yi2, DING Zejun2, RAO Hong2, BAO Guannan3, LU Chao3(1. China Southern Power Grid Power Generation Company, Guangzhou 510630, Guangdong Province, China;2. Electric Power Research Institute, CSG, Guangzhou 510080, Guangdong Province, China;3. Department of Electrical Engineering, Tsinghua University, Haidian District, Beijing 100084, China)ABSTRACT: Taking battery energy storage demonstration project with capacity in megawatt grade located in Biling substation of China Southern Power Grid as the background, an optimal model of peak load shifting of battery energy storage system (BESS) operated in constant power mode is proposed to solve the peak load shifting strategy of BESS charged and discharged with constant power, and a practical simplified algorithm for the solution of the proposed model is given. Making the battery charged and discharged by maximum power, the proposed algorithm can rapidly solve the charging and discharging strategy of BESS while the battery is charged once a day and discharged many times a day, then a real-time control strategy for peak load shifting is given. Based on two sets of actual load data of Biling substation a peak load shifting model for BESS operated in constant power mode is built and optimized by sequential quadratic programming (SQP) with multiple initial points and the practical simplified algorithm respectively, and the solutions by the two algorithms are compared. Comparison result shows that the proposed practical simplified algorithm is effective, besides results of on-site testing performed in Shenzhen Baoqing BESS also verify the effectiveness of the proposed algorithm.KEY WORDS: battery energy storage system; peak load shift; constant power摘要:以南方电网MW级电池储能示范工程为背景,以求解采用恒功率充放电策略运行的电池储能系统削峰填谷策略为目的,提出了电池储能系统恒功率削峰填谷优化模型及求解该模型的实用简化算法。
该算法令电池以最大功率充放电,可以快速求解电池1d充电1次、放电多次情况下的电池储能系统充放电策略。
给出了削峰填谷实时控制策略。
针对深圳碧岭站的2组实际负荷数据建立了恒功率削峰填谷优化模型,分别采用多初始点的序列二次规划法和实用简化算法进行了优化,对2种算法的求解结果做了比较,证明了该算法的有效性。
深圳宝清电池储能站的现场测试结果也验证了该算法的有效性。
关键词:电池储能系统;削峰填谷;恒功率0 引言电力系统削峰填谷是负荷管理的重要方面[1]。
对电网运营者来说,负荷峰值降低有利于推迟设备容量升级,提高设备利用率[2],节省设备更新的费用[3],降低供电成本[4];对电力用户来说,可以利用峰谷电价差获得经济效益。
大规模电池储能系统(battery energy storage system,BESS)以其独特的优势在削峰填谷方面能够发挥巨大作用[4-6]。
在国外已有许多大规模BESS在运行;在国内,南方电网开展了MW级电池储能系统示范项目,建成了深圳宝清电池储能站(接入深圳碧岭变电站)。
本文的研究基于南方电网MW级电池储能项目,并应用于监控系统的高级应用控制部分。
电池储能系统的削峰填谷功能可以分为两步来完成。
第一步是日前优化,在新的一天开始前,根据预测出的日负荷曲线,优化出24h的BESS最优充放电策略,即每个时刻电池是否充放电,充放电的功率大小为多少。
第二步是实时控制,根据日前优化给出的充放电策略,以及当前时刻的负荷值、电池状态等数据,计算出充放电功率指令并下发给每组电力电子变流器(power conversion system,PCS)。
求解电池储能系统削峰填谷策略的算法主要包括梯度类算法、智能算法、动态规划算法。
文第36卷第9期电网技术 233献[7]提出用序列二次规划方法求解BESS的运行策略,使其在实时电价系统中获得最大的利润。
梯度类算法要求模型连续。
文献[8-15]中提出用智能算法来求解含储能装置的系统最优策略问题,包括遗传算法、模拟退火法、粒子群算法。
智能算法的缺点是无法保证收敛到全局最优解。
文献[5]和[6]提出用动态规划方法求解BESS削峰填谷日前优化问题,以电池剩余电量或荷电状态(state of charge,SOC)为状态变量。
采用动态规划算法的好处包括[16]:可以在模型中考虑电池的物理约束,如充放电功率限制,电池中与充放电过程有关的非线性内部损耗约束,电池电压波动约束等;动态规划算法不需要连续函数,且方便使用计算机求解。
为了提高计算速度,文献[5]提出了多进程动态规划算法。
文献[17]针对微网中的储能系统,提出了基于短期负荷预测的主动控制策略。
电池储能系统采用恒功率的充放电策略,既方便对电池控制,又有利于削峰填谷实时控制。
尤其是当负荷高峰提前到来时,若采用恒功率充放电策略,在实时控制时可以根据实际负荷值灵活地控制起始放电时间。
本文针对采用恒功率充放电策略运行的电池储能系统,提出恒功率充放电优化模型。
为便于实际应用,提出求解该模型的实用简化算法。
通过对深圳碧岭站的2组预测负荷数据进行优化,得到电池的充放电策略,验证该实用简化算法的实用性,并与序列二次规划算法的求解结果进行比较。
1 电池储能系统恒功率充放电优化模型1.1 模型假设本文提出2点假设:1)忽略电池的爬坡速率约束;2)忽略电池组的内部损耗。
1.2 优化变量模型中的优化变量为电池每次充放电的功率()p j以及电池每次充放电的起始时间start ()T j和结束时间stop ()T j,j=1,2,",n,其中n为1d中电池充放电次数,根据负荷曲线及电池使用状况来确定。
考虑到充放电次数过多会影响电池使用寿命,可使电池每天充放电各1次。
如负荷曲线在上午和下午有2个高峰,可令电池在1d中充放电各2次。
如考虑到晚间民用负荷高峰,可让电池充放电各3次。
通过改变参数可灵活控制电池的充放电次数,利于延长电池的使用寿命。
定义电池的充电功率为正,放电功率为负。
1.3 目标函数储能系统可在套利模式和负荷转移模式2种模式下工作。
在套利模式下,目标函数()f b是使套利最大化。
根据给定的分时电价曲线,模型可给出电池充放电策略,带来经济效益。
一般来说,负荷高峰期电价高,负荷低谷期电价低。
电池在电价高时放电,在电价低时充电,起到了削峰填谷的作用。
在负荷转移模式下工作时,目标函数()f b为最小化负荷的方差,因为在数学上,方差可反映随机变量偏离其均值的程度。
本文中采用第2种目标函数。
将1d划分成pn个相等的时间段,目标函数为p p21111p p11min()()()n ni jf b D i D jn n==⎛⎞=−⎜⎟⎜⎟⎝⎠∑∑ (1)式中:1()D i为经过电池削峰填谷后第i个时间段上的负荷值,i=1,2,",pn。
1.4 约束条件1)负荷值约束为10start=1() ()()[(sign(())1)]2njp jD i D i i T j=−−−∑,p1,2,,i n="(2)式中:()D i(i=1,2,",pn)为已知的第i个时间段上的预测负荷数据;sign()x为符号函数,当x≥0时sign()x=1,当x<0时sign()x=−1。
当i在start()T j和stop()T j(j=1,2,",n)之间时,1D是D与()p j之和;当i取其他值时,1D与D相等。