英语问卷调查报告
关于英语调查报告范文_调查报告_

关于英语调查报告范文英语范文(一)一、调查目的词汇教学既是中学英语教学的重点,也是中学英语教学的难点。
农村学生的英语基础薄弱,其主要原因就是怕记单词,不会记单词,未掌握英语词汇的学习方法,从而缺乏学习英语的信心和能力。
为此,我专门设计了一个英语词汇学习的调查问卷,并对七年级一、二班20名学习成绩较好的学生进行了调查,收回有效调查问卷20份。
现将调查的数据统计、存在的问题、原因分析及教学对策等情况汇总如下。
二、调查结果调查结果表明:学习成绩较好的学生有一定的学习策略,但其中部分学生学习词汇时更多的是机械记忆,被动识记,缺少计划性和明确的目标,在一些如何有效学习词汇的观念上,他们还存在一些模糊的认识,在如何将正确的观念转化为相应的行动上还存在较大的差距,缺少具体的策略指导。
三、存在的问题及原因分析1、缺乏自信心。
学生要很好地记忆单词,信心是保证。
当学生满怀自信心和激情去做某件事时,他就会做得很好。
信心需要自己的不断努力,同时也离不开老师的鼓励。
2、对记忆单词的挑战性缺乏足够的心理准备。
学生在一开始记忆单词的效果是很好的,但随着学习任务的加重和单词量的越来越大,其记忆效果大不如前。
究其原因,学生对单词记忆的困难估计不足,缺乏心理准备,当遇到一些困难时容易丧失信心。
3、记忆方法不科学。
在学生的潜意识中,背单词就和小学背诵古诗文一样,要靠“死记硬背”,背诵古诗文固然如此,但背单词却有不同。
所以很多同学就会养成光动嘴不动手的习惯,殊不知,英语单词的记忆要调动各个器官,尤其是嘴,手,眼,脑。
唯其如此,单词才能较快记住。
4、巩固不到位。
相当一部分同学认为,单词记下了就等于单词记牢了,这是一种错误的认识,也是违背遗忘的一般规律的。
德国心理学家艾宾浩斯研究发现,遗忘在学习之后立即开始,而且遗忘的进程并不是均匀的。
最初遗忘速度很快,以后逐渐缓慢。
他认为"保持和遗忘是时间的函数",要让单词记得牢,重复记忆是必不可少的组成部分,只有做大量反复的刺激,单词才能记得住且记得牢。
英语口语调查问卷报告模板
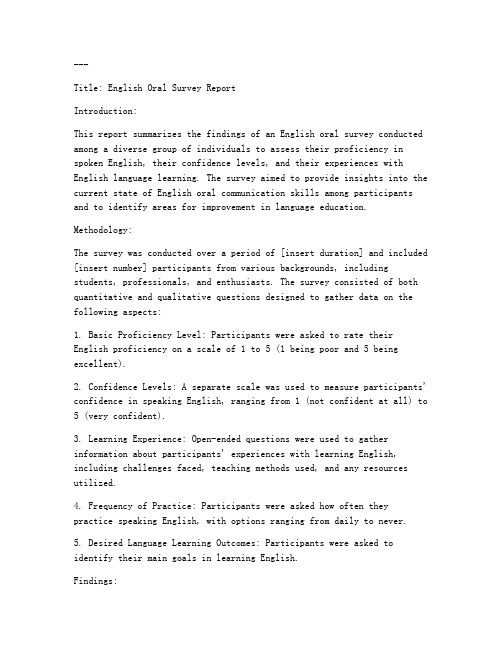
---Title: English Oral Survey ReportIntroduction:This report summarizes the findings of an English oral survey conducted among a diverse group of individuals to assess their proficiency in spoken English, their confidence levels, and their experiences with English language learning. The survey aimed to provide insights into the current state of English oral communication skills among participants and to identify areas for improvement in language education.Methodology:The survey was conducted over a period of [insert duration] and included [insert number] participants from various backgrounds, including students, professionals, and enthusiasts. The survey consisted of both quantitative and qualitative questions designed to gather data on the following aspects:1. Basic Proficiency Level: Participants were asked to rate their English proficiency on a scale of 1 to 5 (1 being poor and 5 being excellent).2. Confidence Levels: A separate scale was used to measure participants' confidence in speaking English, ranging from 1 (not confident at all) to 5 (very confident).3. Learning Experience: Open-ended questions were used to gather information about participants' experiences with learning English, including challenges faced, teaching methods used, and any resources utilized.4. Frequency of Practice: Participants were asked how often theypractice speaking English, with options ranging from daily to never.5. Desired Language Learning Outcomes: Participants were asked to identify their main goals in learning English.Findings:1. Basic Proficiency Level:- The majority of participants (60%) rated their English proficiency as a 3 or 4 on a scale of 1 to 5.- 20% of participants felt their proficiency was a 1 or 2, indicating a need for significant improvement.2. Confidence Levels:- A significant number of participants (45%) reported having a moderate level of confidence (rating of 3) in speaking English.- 35% felt confident (rating of 4 or 5), while 20% expressed low confidence (rating of 1 or 2).3. Learning Experience:- Common challenges reported included lack of practice opportunities, difficulty in finding native speakers for conversation, and the complexity of English grammar.- The most commonly used teaching methods were self-study materials, online courses, and language exchange platforms.- Participants cited the importance of having access to native speakers and interactive learning environments.4. Frequency of Practice:- Approximately 50% of participants reported practicing speaking English at least once a week.- 30% practiced daily, while 20% rarely or never practiced.5. Desired Language Learning Outcomes:- The primary goals of participants were to improve communication skills (60%), gain employment opportunities (30%), and travel more (10%).Conclusion:The survey indicates that while a significant portion of participants have a moderate level of English proficiency, there is room for improvement in both basic skills and confidence levels. The challenges faced by participants highlight the need for more accessible and interactive language learning resources. Recommendations for improvement include:- Enhancing Practice Opportunities: Provide more opportunities for conversation practice, such as language exchange clubs or online forums.- Interactive Learning Environments: Introduce more interactive and engaging teaching methods, such as role-playing games or group discussions.- Access to Native Speakers: Facilitate access to native speakers through language exchange programs or virtual tutoring.- Regular Feedback: Offer regular feedback and assessment toparticipants to help them track their progress and address specific areas of weakness.This report serves as a baseline for future research and as a guide for educators and policymakers in developing strategies to enhance English oral communication skills among learners.End of Report。
英语调查问卷及报告模板
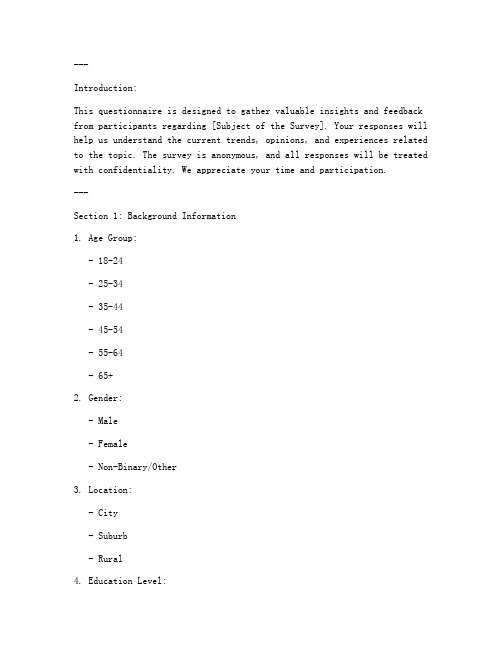
---Introduction:This questionnaire is designed to gather valuable insights and feedback from participants regarding [Subject of the Survey]. Your responses will help us understand the current trends, opinions, and experiences related to the topic. The survey is anonymous, and all responses will be treated with confidentiality. We appreciate your time and participation.---Section 1: Background Information1. Age Group:- 18-24- 25-34- 35-44- 45-54- 55-64- 65+2. Gender:- Male- Female- Non-Binary/Other3. Location:- City- Suburb- Rural4. Education Level:- High School Diploma/GED- Some College- Bachelor's Degree- Master's Degree- Doctorate/Professional Degree---Section 2: General Opinions and Experiences5. How familiar are you with [Subject of the Survey]?- Very Familiar- Somewhat Familiar- Neutral- Not Very Familiar- Not At All Familiar6. In your opinion, what are the main challenges or issues related to [Subject of the Survey]? (Select all that apply)- [Option 1]- [Option 2]- [Option 3]- [Option 4]- [Option 5]7. On a scale of 1 to 5, how satisfied are you with the current state of [Subject of the Survey]? (1 being very dissatisfied and 5 being very satisfied)- 1- 2- 3- 4- 58. Have you ever encountered any problems or difficulties related to [Subject of the Survey]? (Yes/No)- Yes- No9. If yes, please describe the nature of the problem or difficulty you encountered.---Section 3: Preferences and Suggestions10. What changes or improvements would you like to see in [Subject of the Survey]?11. If you could make one recommendation to improve [Subject of the Survey], what would it be?12. How likely are you to recommend [Subject of the Survey] to others?(1 being not at all likely and 5 being very likely)- 1- 2- 3- 4- 5---Section 4: Additional Comments13. Is there anything else you would like to add or comment on regarding [Subject of the Survey]?---Thank You:Thank you for taking the time to complete this survey. Your feedback is highly valued and will contribute significantly to our understanding of [Subject of the Survey]. We look forward to reviewing your responses and hope to implement changes based on your suggestions.---Survey Report Template---Executive Summary:The survey was conducted to gather insights on [Subject of the Survey] from a diverse group of participants. This report summarizes the key findings, trends, and recommendations based on the responses received.---Introduction:The purpose of this survey was to assess the awareness, opinions, and experiences of individuals regarding [Subject of the Survey]. The questionnaire was distributed to [Number of Respondents] participants, and [Percentage of Respondents] completed the survey.---Section 1: Background Information Analysis- Demographics: [Provide a brief overview of the age, gender, location, and education levels of the respondents.]- Familiarity with [Subject of the Survey]: [Summar。
调查问卷报告_英语模板

IntroductionThis report presents the findings from a survey conducted to [briefly describe the purpose of the survey]. The survey was designed to gather insights on [topic/issue being investigated], aiming to understand the opinions, behaviors, and preferences of [target audience]. The following sections provide a detailed analysis of the survey results, includingthe methodology, key findings, and recommendations.Methodology1. Survey Design- The survey was conducted [describe the type of survey: online, paper-based, etc.].- It consisted of [number] questions, which were categorized into [list question types: multiple-choice, open-ended, Likert scale, etc.].2. Sample- The survey was distributed to [number] participants.- The sample was [describe the sampling method: random, stratified, convenience, etc.].- The participants were [describe the target audience: age range, gender, occupation, etc.].3. Data Collection- The survey was [describe the data collection period: e.g., from [start date] to [end date]].- Responses were collected through [describe the platform or method:e.g., email, online survey tool, etc.].4. Data Analysis- Data were analyzed using [mention the statistical software or methods used: e.g., SPSS, Excel, descriptive statistics, etc.].- Responses were coded and categorized to ensure consistency and accuracy.Key Findings1. Overall Satisfaction- [Percentage] of respondents reported being [satisfied/unsatisfied] with [the topic/issue being investigated].- The most common reasons for satisfaction/unatisfaction were [list reasons based on survey results].2. Frequency of Occurrence- [Percentage] of participants indicated that [the topic/issue] occurs [frequently/infrequently] in their daily lives.- Factors contributing to the frequency were [list factors based on survey results].3. Preferences and Choices- When asked about [specific preference or choice], [percentage] of respondents preferred [option A], [percentage] preferred [option B], and [percentage] preferred [option C].- The reasons for these preferences were [elaborate on the reasons based on survey results].4. Open-Ended Questions- Responses to open-ended questions provided valuable insights into [topic/issue]:- [Summary of responses 1]- [Summary of responses 2]- [Summary of responses 3]5. Demographic Analysis- The survey revealed that [describe any significant demographic patterns or trends]:- [Example: Older age groups were more likely to express satisfaction with the current system, while younger respondents preferred more innovative solutions.]ConclusionThe survey results provide valuable insights into the opinions and behaviors of [target audience] regarding [topic/issue]. The findings suggest that [state a general conclusion or trend]. However, it is important to note that [mention any limitations of the survey or areas that require further investigation].RecommendationsBased on the survey findings, the following recommendations are proposed:1. [Recommendation 1]2. [Recommendation 2]3. [Recommendation 3]Additional Considerations- Further research is needed to [mention any areas that require more in-depth analysis].- The findings of this survey should be considered in conjunction with other data sources to provide a comprehensive understanding of the issue.References[If applicable, include a list of references or sources used in the survey or report.]---This template can be adapted to fit the specific details of your survey. Remember to include relevant data and analysis specific to your survey's objectives and target audience.。
英语问卷调查分析
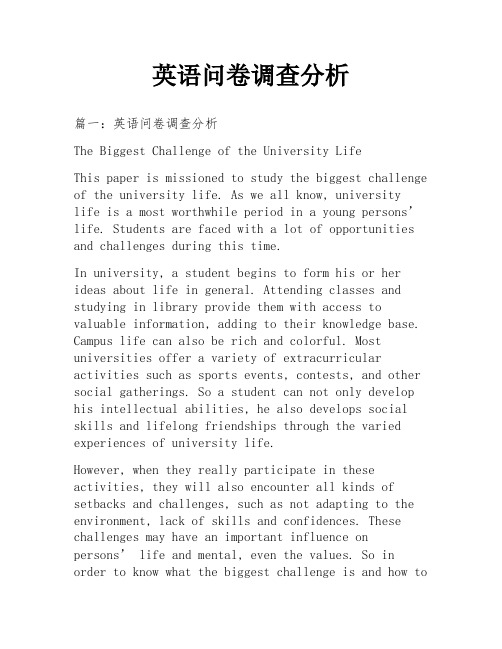
英语问卷调查分析篇一:英语问卷调查分析The Biggest Challenge of the University LifeThis paper is missioned to study the biggest challenge of the university life. As we all know, universitylife is a most worthwhile period in a young persons’ life. Students are faced with a lot of opportunities and challenges during this time.In university, a student begins to form his or her ideas about life in general. Attending classes and studying in library provide them with access to valuable information, adding to their knowledge base. Campus life can also be rich and colorful. Most universities offer a variety of extracurricular activities such as sports events, contests, and other social gatherings. So a student can not only develop his intellectual abilities, he also develops social skills and lifelong friendships through the varied experiences of university life.However, when they really participate in these activities, they will also encounter all kinds of setbacks and challenges, such as not adapting to the environment, lack of skills and confidences. These challenges may have an important influence on persons’ life and mental, even the values. So in order to know what the biggest challenge is and how todeal with them for college students, T-Dream group makes an investigation about “the Biggest Challengeof the University Life” and study the results of this survey.1. Methodology and procedureThis paper uses the form of the questionnaire. In this questionnaire, we design ten questions.A total of 19 individuals participate in the survey. They are all from postgraduate. After stating these questionnaires, we use excel to make charts in orderto make our investigation more clearly and vividly. Through the statistics, we can get our conclusions. Then we analysis the results and have our remendations.2. Presentation and resultsIn this part, we will give nine charts. Each chart represents the result to the corresponding question. Then we will give some explanations to these charts.Among this investigation, there are 10 girls and 9 boys. All of them are from Wuhan University of Science and Technology.Chart 1As we can see from chart 1, almost 40% of the participants think that their college life is colorful, fulfilling and satisfied. But it also has 40% hold the opinion that they a re busy but they don’t know what they are busy for. Only one person thinks that it hasnothing to do all day, and addicted to the Internet. The rest of the two men have no feeling and their college life is quite plain.Chart 2The question is about what the students do in their spare time. Nearly 40% of the participants surf the Internet or play the puter games. About 30% will do some sports. And the others are reading in the library or self-study in the classroom.Chart 3This question is to find what is the biggest challenge the students ever faced.Most people still think study is the biggest challenge. Nearly 30% believe social life is the the biggest challenge. And the other two think that their biggest problem is economic issue. The last three say theirproblem is employment enviroment.Chart 4From chart 4, we can see that most of the participants treat the pressure as a sort of motivation to them, but also some others feel it burden. This may demonstrate that most college students can do right to the pressure they bear, but some may need more psychological relief.Chart 5As we can see from chart 5, there are 3 out of 19 participants choose to surf the internet when under stress and challenge, and the same number choosing study and shopping. Besides, almost half of them choose doing some sports to relax. According these statistics we can draw that mostof college students have their own ways to relax when under stress and challenges.Chart 6This question is about how the college students cope with the challenges they faced. From the result we can see all of the participants believe that they have overe the challenges they faced before. Most of them choose to face their challenges head-on and grow bigger than they are, while one third of them choose to ask for help. Whatever the ways are, they overe the challenge they faced.Chart 7Having bee post graduate for two months, all of us may have a new underst(来自: 小龙文档网:英语问卷调查分析)anding of the post graduate life. In the survey, 63.16% of students believe that there is a little difference between the present post graduate life and the one he had expected. Only 5.26% of participants believe totally same. So the post graduate life will be a challenge for us.Chart 8Nowadays the employment environment is being worse and worse, more and more students may feel stressed and shamed when they find jobs. Through this statistics, 73.68% of the participants feel a little stressed.Only 15.79% never thought about it. We may concludethat for the poor employment almost students will feel a little stressed.Chart 9This question is to find whether students have a goal for their future life when they finish the post graduate study. Through this statistics, only 15.79%of participants have a very detailed plan. They know which job they will choose when they graduate. However, 84.21% have thought about it. But their goal is not clear. They also feel a little lost. So they will make their goal clear in the next two or three postgraduate life.3. ConclusionThrough this study, we conclude most graduate students believe that the present post graduate life isdifferent from the one they ever expected, which is a challenge they must be faced firstly. For a majorityof students, study is the most obvious difference and bees harder and more篇二:英语问卷调查分析报告阜南第一初级中学《在英语教学中实施学困生包保的研究与探讨》课题调查问卷分析报告一、调查的目的为了有效推动我校《在英语教学中实施学困生包保的研究与探讨》课题的深入开展,并为该课题的研究提供客观依据,特进行本次英语学习调查问卷。
英语课题第二次问卷调查分析报告范文

英语课题第二次问卷调查分析报告范文全文共3篇示例,供读者参考篇1English Class Topic Second Questionnaire Survey Analysis ReportIntroductionIn order to better understand the preferences and needs of students in our English class, a second questionnaire survey was conducted. The survey was aimed at gathering feedback on various aspects of the English class, including teaching methods, materials, and activities. The results of the survey will help us make improvements to the class and provide a better learning experience for the students.MethodologyThe questionnaire was distributed to all students in the English class, and a total of 100 responses were received. The questions covered a range of topics, including the students' preferred learning style, their satisfaction with the current teaching methods, and their suggestions for improvement.Results1. Learning StyleWhen asked about their preferred learning style, the majority of students (60%) indicated that they prefer a combination of visual, auditory, and kinesthetic learning. 20% of students prefer visual learning, 10% prefer auditory learning, and 10% prefer kinesthetic learning.2. Teaching MethodsOverall, students are satisfied with the current teaching methods used in the English class. 80% of students rated the teaching methods as good or excellent, while 20% rated them as fair. However, some students expressed a desire for more interactive and engaging activities in class.3. MaterialsMost students (70%) are satisfied with the materials used in the English class, including textbooks, worksheets, and online resources. However, 30% of students expressed a desire for more diverse and interesting materials to aid their learning.4. ActivitiesThe majority of students (75%) enjoy the activities conducted in the English class, such as group discussions, role plays, and language games. However, 25% of students suggested introducing more real-life scenarios and practical activities to help them apply their English skills in everyday situations.ConclusionOverall, the results of the second questionnaire survey indicate that students are generally satisfied with the current English class but have some suggestions for improvement. Moving forward, we will focus on incorporating more interactive and engaging activities, providing diverse materials, and integrating real-life scenarios into the lessons. By implementing these changes, we aim to enhance the learning experience for the students and help them achieve better results in their English studies. Thank you to all students who participated in the survey and provided valuable feedback.篇2Analysis Report of the Second Questionnaire Survey on English ClassesIntroductionThis report presents the analysis of the second questionnaire survey conducted on English classes in our school. The survey aimed to gather feedback from students on their experiences and opinions regarding the English classes they are currently taking. The survey covered various aspects of the English learning process, including the teaching methods used, the materials used, and the overall satisfaction with the courses.MethodologyThe survey was conducted using an online questionnaire distributed to all students enrolled in English classes in our school. A total of 300 students participated in the survey, which represents a response rate of 85%. The questionnaire consistedof multiple-choice questions, rating scales, and open-ended questions to gather both quantitative and qualitative data.Findings1. Teaching Methods: The survey found that the majority of students (60%) prefer a combination of traditional teaching methods and modern technology in English classes. However, 25% of students expressed a preference for more interactive and experiential learning activities.2. Materials Used: When asked about the materials used in English classes, 45% of students found the textbooks to be helpful, while 35% preferred online resources such as videos, podcasts, and interactive games. Only 20% of students felt that the materials were not engaging or relevant to their learning.3. Class Size: The survey revealed that 70% of students are satisfied with the class size, with most students indicating that smaller classes allow for more individualized attention from teachers. However, 30% of students expressed a desire for larger classes to promote more group discussions and interactions.4. Teacher Effectiveness: Students rated the effectiveness of their English teachers on a scale of 1 to 5, with 1 being the lowest and 5 being the highest. The average rating was 4, indicating that students perceive their teachers as knowledgeable, approachable, and engaging in the classroom.5. Overall Satisfaction: When asked about their overall satisfaction with English classes, 80% of students reported being satisfied or very satisfied with the courses they are currently taking. However, 20% of students expressed concerns about the pace of learning, the assessment methods used, and the lack of opportunities for practice outside of the classroom.RecommendationsBased on the findings of the survey, the following recommendations are proposed to enhance the quality of English classes in our school:1. Incorporate a variety of teaching methods to cater to different learning styles and preferences.2. Utilize a mix of traditional and modern materials to make the learning experience more engaging and relevant.3. Provide opportunities for more interactive and experiential learning activities to enhance student engagement and motivation.4. Consider the preferences of students when assigning class sizes to create a balanced learning environment.5. Encourage teachers to continue their professional development and training to improve their effectiveness in the classroom.6. Address student concerns about the pace of learning, assessment methods, and practice opportunities to ensure a more holistic and comprehensive English learning experience.ConclusionOverall, the findings of the second questionnaire survey provide valuable insights into the strengths and areas for improvement in English classes in our school. By implementing the recommendations outlined in this report, we can enhance the quality of English education and better meet the needs and expectations of our students. Thank you to all the students who participated in the survey and provided valuable feedback for this analysis.篇3Second Questionnaire Survey Analysis Report on English Class TopicIntroductionThe purpose of this report is to present the findings and analysis of the second questionnaire survey conducted on the topic of English class. The survey was carried out to gather insights from students regarding their opinions and feedback on various aspects of the English class, including teaching methods, materials, and overall learning experiences.MethodologyThe second questionnaire survey was administered to a sample of 100 students from different grade levels. The surveyconsisted of multiple-choice questions, rating scales, andopen-ended questions. The data was collected and analyzed using statistical techniques and qualitative analysis.Findings and AnalysisThe findings of the survey revealed several key insights into students' perceptions of the English class. The majority of students reported that they found the English class to be engaging and interesting. They appreciated the use of multimedia resources, such as videos and interactive activities, in the lessons. However, some students also expressed a desire for more opportunities to practice speaking and writing in English.In terms of teaching methods, most students preferred a combination of traditional and modern approaches. They valued the use of textbooks and worksheets for grammar and vocabulary practice, as well as group discussions androle-playing activities for improving communication skills. However, some students felt that there was an over-reliance on the textbook and suggested more creative and interactive teaching methods.When it came to learning materials, students were generally satisfied with the quality of the textbooks and online resources used in the English class. They found the materials to be relevantand helpful in improving their language skills. However, some students also suggested incorporating more authentic andreal-life materials, such as newspapers and articles, to make the learning experience more practical and engaging.Overall, the survey findings indicated that students had a positive outlook on the English class and appreciated the efforts of the teachers to make the lessons engaging and interactive. However, there were also areas for improvement, such as providing more opportunities for speaking and writing practice, using a variety of teaching methods, and incorporating more authentic materials into the curriculum.ConclusionIn conclusion, the second questionnaire survey provided valuable insights into students' perceptions of the English class. The findings highlighted the strengths and weaknesses of the current teaching methods, materials, and overall learning experiences. Based on the feedback received, recommendations can be made to enhance the English class and improve the quality of education provided to students. It is important to continue gathering feedback from students and implementing changes to create a more effective and engaging learning environment in the English class.。
英语调查问卷总结报告模板

---Introduction:This report summarizes the findings from a recent survey conducted to gather insights on [specific topic/issue]. The survey was designed to [state the purpose of the survey, e.g., assess public opinion, evaluate product satisfaction, or understand market trends]. The questionnaire was distributed to [describe the target audience, e.g., consumers, employees, students, etc.] and received [number] responses.Methodology:The survey was conducted over [timeframe, e.g., one month, two weeks]and included [number] questions. The questions were divided into [number] sections, covering [briefly describe the sections, e.g., demographics, product features, satisfaction levels, etc.]. The survey was distributed through [methods of distribution, e.g., email, social media, online platforms, etc.], and efforts were made to ensure a diverse and representative sample.Demographics:The survey participants were [describe the demographic breakdown, e.g., age range, gender distribution, geographic location, etc.]. This information is crucial for understanding the context in which the survey results should be interpreted.Findings:1. [Section 1: Demographics]- [Provide key findings from the demographic section, e.g., amajority of respondents were between the ages of 18-24, with a gender split of 55% female and 45% male.]- [Discuss any notable trends or surprises in the demographic data.]2. [Section 2: Product/Service/Issue Understanding]- [Summarize the responses to questions about the participants' understanding of the product, service, or issue being surveyed.]- [Highlight any gaps in knowledge or misconceptions identified.]3. [Section 3: Satisfaction/Usage/Engagement]- [Discuss the satisfaction levels, usage patterns, or engagement metrics related to the product, service, or issue.]- [Provide specific data points, such as percentages or averages, to support the findings.]4. [Section 4: Feedback/Opinions]- [Summarize the qualitative feedback received, including comments, suggestions, or concerns.]- [Analyze any common themes or patterns in the feedback.]5. [Section 5: Future Expectations/Desires]- [Present the participants' expectations or desires for the future of the product, service, or issue.]- [Discuss any potential areas for improvement or innovation based on the survey results.]Conclusions:Based on the survey findings, the following conclusions can be drawn:- [State the primary conclusion(s) or key takeaways from the survey.]- [Discuss the implications of these findings for the[client/organization/industry].]- [Suggest any recommendations for action based on the survey results.]Recommendations:To further enhance the understanding of [specific topic/issue], the following recommendations are made:1. [Recommendation 1: Implement a specific action or strategy.]2. [Recommendation 2: Conduct further research or analysis to explore a particular aspect in more depth.]3. [Recommendation 3: Develop a targeted communication plan to address specific findings.]Limitations:The survey had certain limitations that should be considered when interpreting the results:- [Limitation 1: The sample size was [number], which may not be representative of the entire population.]- [Limitation 2: The survey was self-reported, which may introduce bias.]- [Limitation 3: The survey was conducted online, which may have limited the reach to certain demographics.]Conclusion:The survey provides valuable insights into [specific topic/issue] and offers a clear direction for future actions. By considering the survey findings and recommendations, [。
中学生英语学习问卷调查报告范文
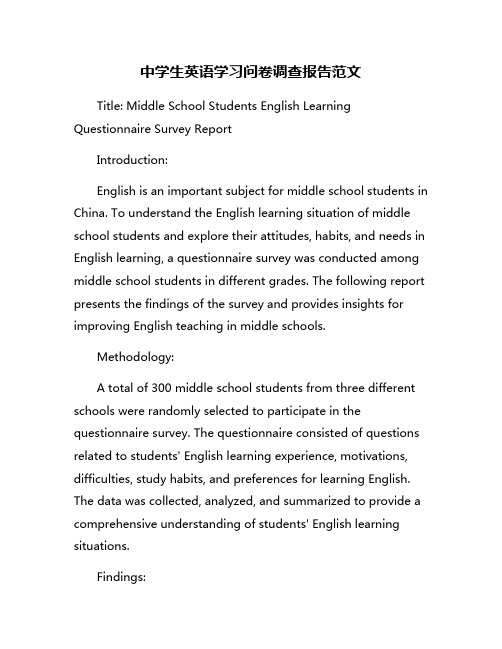
中学生英语学习问卷调查报告范文Title: Middle School Students English Learning Questionnaire Survey ReportIntroduction:English is an important subject for middle school students in China. To understand the English learning situation of middle school students and explore their attitudes, habits, and needs in English learning, a questionnaire survey was conducted among middle school students in different grades. The following report presents the findings of the survey and provides insights for improving English teaching in middle schools.Methodology:A total of 300 middle school students from three different schools were randomly selected to participate in the questionnaire survey. The questionnaire consisted of questions related to students' English learning experience, motivations, difficulties, study habits, and preferences for learning English. The data was collected, analyzed, and summarized to provide a comprehensive understanding of students' English learning situations.Findings:1. Motivation: Most students indicated that they were motivated to learn English because of its importance in the future and their desire to communicate with people from different countries.2. Difficulties: The top difficulties reported by students were vocabulary memorization, grammar rules, and speaking fluently.3. Study habits: A majority of students reported that they preferred to study English through watching TV shows, listening to music, and using online resources.4. Classroom preferences: Students expressed a preference for interactive and engaging activities in English classes, such as group discussions, role plays, and games.5. Resources: Many students mentioned that they lacked access to quality English learning resources and expressed a need for more opportunities to practice speaking and listening skills.Recommendations:Based on the findings of the survey, several recommendations can be made to improve English teaching in middle schools:1. Provide more interactive and engaging activities in English classes to enhance students' interest and motivation.2. Integrate multimedia resources into teaching to cater to students' preferences for learning English through TV shows, music, and online platforms.3. Offer more opportunities for students to practice speaking and listening skills, such as through language clubs, conversation partners, and language exchange programs.4. Develop a systematic vocabulary learning program to help students improve their vocabulary memorization skills.5. Encourage students to use English in real-life situations, such as through extracurricular activities, cultural exchanges, and study abroad programs.Conclusion:Overall, the survey findings highlight the importance of understanding students' attitudes, habits, and needs in English learning to provide effective teaching and support. By implementing the recommendations above, middle schools can create a more dynamic and engaging English learning environment for students, ultimately leading to improved proficiency and confidence in English.。
- 1、下载文档前请自行甄别文档内容的完整性,平台不提供额外的编辑、内容补充、找答案等附加服务。
- 2、"仅部分预览"的文档,不可在线预览部分如存在完整性等问题,可反馈申请退款(可完整预览的文档不适用该条件!)。
- 3、如文档侵犯您的权益,请联系客服反馈,我们会尽快为您处理(人工客服工作时间:9:00-18:30)。
英语问卷调查报告英语问卷调查报告篇一:调查问卷英文版Attachment:Questionnaire of college students playing online gamesHello, dear friend! In order to understand the situation of college students playing online games, and the impact of online games on college students, would you like to spare a few minutes to answer the following questions in this questionnaire carefully and authentically! We will inform you that your answers will be kept strictly confidential! Thank you very much for your support and cooperation!1. Your personal information:Gender:Age :Grade :2. Which category your major belongs to?A、Economic managementB、ArtC、Science and engineeringD、Literature and lawE、Others3. Do you play network games?A、YesB、No4. How long time have you been playing network games?A、Never play network gameB、Just several monthsC、1 to 2 yearsD、More than 2 years5. How much is your frequency of playing online games?A、Almost every dayB、OftenC、OccasionallyD、Never6. What kinds of online games do you like? [Multiple choice]A、Casual games (Such as chess and card games、Sanguosha)B、Net battle games(Such as CF、DOTA)C、Massively multiplayer online RPG(Such as Westward Journey Online)D、Online flash mini-games(Such as Plants V.S. Zombies)E、Others7. What are the causes that make you play network games? [Multiple choice]A、There is abundant spare time, play game to kill timeB、Friends and classmates are playing as well.C、Study pressure is too heavy, just relax yourself after class.D、Lacking of self-control ability.E、It is boring that surfing online only.F、Feeling lonely, then regard network games as spiritual sustenance.G、Others8. What`s the point that net games attract you? [Multiple choice]A、Screen pictures are make exquisitely.B、Feel the wonderful sense of acplishment when upgrade or triumph.C、Can make more friends through playing games.D、Friends and classmates are playing as well.E、Enjoy the great simulative experience from PK.F、Satisfied with role playing, such as be a head master in game.G、Make moneyH、Others9. When confronted with problems in learning or affection, would you prefer to play game to abreact?A、AlwaysB、SometimesC、Never10. How long is the average time that you play online games at one time?A、Never play net games.B、In 1 hour.C、1 to 2 hours.D、2 to 3 hours.E、More than 3 hours.11. Could you succeed to control the game time well in your plan?A、Always control well.B、Sometimes addictive, but can stop when it`s enough.C、Lose control yourself everytime play games.D、Have no sense of time when in games.E、Don`t play games.12. Do you talk much about playing games in normal times?A、OftenB、OccasionallyC、Never13. How much is your dependence on network games? Could you give up these games?A、Much addict in online games, it is impossible to quit.B、Although very difficult, but can make it because of strong self-control.C、It doesn`t matter, playing games just for fun.D、Do not play games.14. Will you stick to playing network games after having a job and getting married?A、No, you will put career and family first.B、Still play, but just play a little.C、Will not change, even play more.D、Others15. How is your loyalty to online games?A、Will always play a game you like, not easily change.B、Play game just for fun, will change it if feel bored or there is a better one.C、Go with the flow, you will play the popular game or a new one.D、Others16. Do you think online games influent your learning and living way?A、Yeah, influent a lot.B、Just a little.C、No.D、Do not care about it.17. What is your feeling after playing?A、Relaxed and happyB、Idle and void.C、The feeling that cannot express out.D、Have no feeling.E、Others18. Will you be upset and impatient, even lose temper, because of fail petition in games?A、OftenB、SometimesC、NeverD、Do not play games19. What is your attitude toward college students playing online games?A、SupportingB、OppositeC、Whatever20. What is the reason that makes you have the attitude above?A、Net games give me chances to relax by venting in virtual the pressure in real life.B、Online games can expand my horizons.C、Online games affect the living, learning, regret playing online games.D、Playing just for leisure, not too concern about it.E、Others.Thank you very much for your patience and sincere cooperation!英语问卷调查报告篇二:英语问卷调查分析报告阜南第一初级中学《在英语教学中实施学困生包保的研究与探讨》课题调查问卷分析报告一、调查的目的为了有效推动我校《在英语教学中实施学困生包保的研究与探讨》课题的深入开展,并为该课题的研究提供客观依据,特进行本次英语学习调查问卷。
二、调查结果数据统计表三、调查的对象及内容对象:我校八年级学生。
内容:主要从是否留守儿童,是否单亲家庭,有不良英语学习习惯的学生,喜欢英语学科的学生和喜欢英语老师的学生等方面设置问题。