双体船的阻力性能预估
高速穿浪双体船船型及性能研究_何义(1)

⾼速穿浪双体船船型及性能研究_何义(1)⾼速穿浪双体船船型及性能研究*何义赵连恩(哈尔滨⼯程⼤学船舶与海洋⼯程系,哈尔滨150001)摘要穿浪双体船(WPC)是在⼩⽔线⾯双体船和⾼速双体船的基础上发展起来的⼀种新型⾼性能船,它保留了SWATH 船型的低阻⾼速、甲板⾯积宽敞等优点,同时融合了深V 船型优良耐波性作者对穿浪双体船的船型及阻⼒和耐波性等⽅⾯进⾏了研究关键词穿浪双体船;耐波性;阻⼒分类号 U 661.3Study of Form and Performance of High SpeedWave Piercing CatamaranHe Yi Zhao Lianen(Dept.of Naval Architecture and Ocean Eng.,Harbin Eng ineering U niversity ,Harbin 150001)Abstract Wave piercing catamaran is a new type of high speed multi-hull ship w hich is different from conventional high speed catamaran.In this paper the hydrody -namic research of w ave piercing catamaran is described.It includes the study of resis -tance and seakeeping perform ance.The results are compared w ith those of round-bilge and deep-Vee hulls.Key words wave piercing catamaran;seakeeping;resistance图1 艇体型线图0 引⾔穿浪双体船(WPC)是80年代在⼩⽔线⾯双体船(SWATH)和⾼速双体船的基础上发展起来的⼀种新型⾼性能船,它保留了SWATH 船型的低阻⾼速、甲板⾯积宽敞等优点,同时融合了深V 船型优良耐波性,克服了SWATH 船⽚体⽆储备浮⼒和空间⼩等缺点因此WPC 具有⾼效节能,综合性能优良,建造⼯艺简单,使⽤成本低,技术风险⼩等特点,已为许多先进国家所采⽤[1]收稿⽇期:1996-05-31* 船舶⼯业国防科技预研基⾦资助项⽬责任编辑:刘⽟明第18卷第4期哈尔滨⼯程⼤学学报 Vol.18, .41997年8⽉ Journal of H arbin Engineering University Aug.,19971 性能与船型1.1 主尺度及⽚体形状在排⽔量已确定的情况下,选择穿浪双体船的长宽⽐L /B ,或确定修长系数L / 1/3,应以付⽒数F 为根据,在F =1.0~3.0的过渡航态范围,其修长系数越⼤则对阻⼒性能越有利,因此相应的长宽⽐L /B 值就越⼤穿浪双体船的容积付⽒数通常在1.5~2.5的范围,较⼤的修长系数可获得较好的阻⼒性能⽚体采⽤深V 形的横剖⾯形状,艏部龙⾻甚⾄可下沉到基线以下,以增加V 形的程度,形成极深V 形,可避免艇艏底部出⽔,从⽽减⼩波浪的拍击⽔线进⾓,根据付⽒数和结构⽅⾯的允许,取得越⼩越好对⾼速轻型穿浪双体船艉底横向斜升⾓,可以根据阻⼒性能和耐波性能来确定,通常采⽤较⼩的的值可获得较⼤的动升⼒,能提⾼艇的快速性能,同时有利于采⽤喷⽔推进器但对于航速较低、排⽔量较⼤的⼤型穿浪双体船,采⽤使后体变平来产⽣有效升⼒的⽅法是不可取的,这是因为升⼒正⽐于尺度的平⽅⽽排⽔量正⽐于尺度的⽴⽅这不仅不能获得所谓的滑⾏特性,改善阻⼒性能,反⽽会使耐波性恶化因此,对于此类船可以采⽤较⼩的艉端收缩系数和较⼤的艉底部横向斜升⾓ 1.2 浮体⼲舷与常规双体船相⽐,WPC 具有较⼩浮体⼲舷,尤其在艏艉两端,⼲舷⼤幅度减⼩,甚⾄为负值,这使得浮体的储备浮⼒沿船长具有合理的纵向分布,以减⼩船体对波浪运动的响应,避免发⽣失速这使穿浪双体船在波浪中具有较⾼的航速,提⾼耐波能⼒,改善船体运动性能,在较⾼的海情下减⼩晕船率,能正常使⽤和发挥武备的威⼒1.3 连接桥和中央船体的形状连接桥和中央船体的形状与船舶在波浪中的运动性能有密切关系连接桥的形状关系到储备排⽔量的分布,因此影响到穿浪双体船的航态控制和耐波性能连接桥的⽔线⾯尖瘦,能提供的附加储备浮⼒很⼩,特别是在靠近艏艉端部连接桥采⽤拱形的横剖⾯形状,有利于减⼩波浪对船体的冲击作⽤,也有利于船体的横向强度中央船体在艏部的龙⾻采⽤下垂的形式,横剖⾯呈深V 形,可缓和在⼤波浪中中央船体艏底部所受到波浪的砰击,同时提供附加的储备浮⼒在⼀般海情下,中央船体不与波浪接触,只有在很⼤的海浪中,其图2 剩余阻⼒系数曲线附加的储备浮⼒可防⽌由于浮体的储备浮⼒不⾜,⽽使船艏过于陷⼊波涛中,以⾄甲板上浪或发⽣埋艏现象1.4 浮体间距浮体间距增⼤,当F r <0.5时,对于静⽔阻⼒的影响,规律性不太明显;当F r >0.5时,⼀般对静⽔阻⼒有利,对耐波性也有利,间距越⼤对艇在横浪中的运动越有利,可使其横向和纵向加速度明显减⼩,特别是在较短横波长的情况下更为有利同时,使甲板⾯积增⼤,有利于舱室布置9 第4期何义等:⾼速穿浪双体船船型及性能研究图3 阻⼒⽐较和甲板载货但是过⼤的浮体间距对船体的横向强度不利,使艇的结构重量增加2 船模试验及结果2.1 船模尺⼨及试验状态试验模型为玻璃钢材料制作,外观光滑平顺,尺度为船模总长1.740m ,⽔线长1.560m ,总宽0.744m ,⽚体宽0.136m ,吃⽔0.036m ,型线图见图1 2.2 试验数据处理2.2.1 阻⼒试验及数据处理阻⼒试验在静⽔中进⾏,试验前对模型重量、吃⽔和浮态等参数进⾏了严格调整,完成了三种排⽔量时,不同航速下阻⼒的测量试验结果见图2 将阻⼒曲线换算成600t 实船的阻⼒曲线,并与同吨位单体船进⾏⽐较,见图32.2.2 耐波性试验及数据处理试验前对重⼼位置和纵横向惯性矩进⾏了仔细调整和校验,完成了迎浪航⾏三种航速不同波长的试验,同时测量记录了纵摇、升沉、艏加速度、艉加速度、波浪增阻,还完成了正横波浪中静⽌横摇试验,测量记录了横摇、升沉值,试验结果见图4,其它结果见⽂献[2] 为了解实船在⼀定海情下的耐波性,需将船模在⽔池规则波试验结果换算成不规则波条件的运动响应,采⽤ITTC 单参数谱,根据试验值可确定幅频响应函数,从⽽计算出不同有义波⾼和航速下对应的运动有义值,计算通过编程在微机上完成图4 耐波性试验曲线3 理论计算由于穿浪双体船⽚体间距⽐较⼤,如计算迎浪情况,可忽略⽚体间的相互影响,细长的⽚体较好地满⾜了切⽚理论的假设,可采⽤切⽚理论进⾏耐波性计算10 哈尔滨⼯程⼤学学报第18卷(a +A 11) Z +A 12 Z +A 13Z +A 12 +A 13 +A 14 =F Zc cos e t +F Zs sin e t(J +A 21) Z +A 22 Z +A 23Z +A 22 +A 23 +A 24 =M c cos e t +M s sin e t⽅程两边除2,满⾜(a +A 11) Z /2+A 12 Z /2+A 13Z /2+A 12 /2+A 13 /2+A 14 /2=F Zc cos e t /2+F Zs sin e t /2(J +A 21) Z /2+A 22 Z /2+A 23Z /2+A 22 /2+A 23 /2+A 24 /2=M c cos e t/2+M s sin e t /2式中, Z Z Z 分别为升沉加速度、速度、位移;分别为纵摇⾓加速度、⾓速度、⾓度;a 船本⾝的质量;J 船本⾝的纵向转动质量;F =F Zc cos e t +F Zs sin e t 是分解成余弦项和正弦项的升沉波浪扰动⼒;M =M c cos e t +M s sin e t 是分解成余弦项和正弦项的纵摇波浪扰动⼒矩;系数A 11,A 12 ,A 21,A 22 是流体动⼒系数,与频率有关其它符号说明参见⽂献[3]由于两⽚体完全对称,因此可按单体船的切⽚理论进⾏⽔动⼒系数计算及求解,但当对该船计算时应做湿表⾯修正,此修正应根据试验进⾏另外,由于艏部的特殊性,也应特殊处理程序说明见⽂献[4] 本计算在单体计算的基础上计算其耐波性能,包括纵摇、升沉、艏艉加速度、波浪增阻等理论计算及试验⽐较见表1表1 穿浪双体船理论计算与试验⽐较(浪⾼2.0m )纵摇/( )升沉/m 艏加/g艉加/g波浪增阻速度/kn 18301830183018301830理论2.331.300.760.700.400.440.160.251.441.85试验2.481.440.850.730.600.450.240.300.951.51理论计算结果接近试验结果,可以作为迎浪时的耐波性预报4 结果分析及结论(1)由剩余阻⼒系数曲线可知(见图2),此船的阻⼒峰现象明显 F r =0.5时不利⼲扰相互叠加,剩余阻⼒达到峰值,阻⼒⽐同吨位单体船⾼10%,⽆效⼲扰点F r 0据有关资料分析,此类船为0.7附近当F r >F r 0以后,剩余阻⼒曲线明显平坦,所以对于⾼速双体船设计状态取在0.7以后与⼀般单体船⽐较,低速时阻⼒性能稍差⼀些,⾼速时阻⼒性较优(2)通过计算600t 穿浪双体船在航速18kn 和30kn ,波⾼为2.0m (4级海情)和3.5m (5级海情)下的耐波性,并与常规圆舭船及深V 船的⽐较可知(见表2,表3):低速时,由于不11 第4期何义等:⾼速穿浪双体船船型及性能研究能充分有效发挥其穿浪性能,因此耐波性较差;当⾼速时,由于船型发挥了穿浪性能,⽚体象尖⼑⼀样穿过波浪,⼩的⽚体⼲舷更增加了其过浪性能,其运动性能除升沉外,普遍优于⼀般船型表2 穿浪双体船耐波性(浪⾼2.0m )纵摇/( )升沉/m 艏加/g艉加/g波浪增阻速度/kn 18301830183018301830穿浪船2.481.440.850.730.600.450.240.300.951.51深V 船2.172.100.430.570.410.580.240.372.483.06圆舭船2.752.560.650.820.620.740.300.422.632.92表3 穿浪双体船耐波性(浪⾼3.5m )纵摇/( )升沉/m 艏加/g艉加/g波浪增阻速度/kn 18301830183018301830穿浪船5.253.871.842.060.830.820.370.573.317.30深V 船4.334.541.141.470.641.030.390.655.439.08圆舭船5.135.331.461.920.831.330.450.745.779.23(3)波浪增阻在各种速度海情下均优于⼀般船型,因此,该船在波浪中可保持⾼航速通过研究表明,穿浪双体船在⾼速时是⼀种耐波性优良的船型,特别适合于车客渡船和其它对耐波性要求较⾼的船型因此,作者认为穿浪双体船是我国⾼速船发展的重要⽅向,具有⼴阔的应⽤前景参考⽂献1 赵连恩⾼性能穿浪双体船的发展与军事应⽤前景 94⾼性能船学术会论⽂西安,19942 哈尔滨⼯程⼤学新型船舶研究室穿浪双体船模型试验报告哈尔滨⼯程⼤学,19933 李积德船舶耐波性哈尔滨:哈尔滨⼯程⼤学出版社,19924 戴遗⼭船舶适航性计算⽅法船⼯科技,1977,(1)12 哈尔滨⼯程⼤学学报第18卷。
小水线面双体船阻力及其数值模拟方法研究

研究不足与展望
尽管本文取得了一定的研究成果,但 仍存在一些不足之处。首先,本文仅 对小水线面双体船的阻力进行了研究 ,未对其其他性能如稳定性、耐波性 等进行全面评估。未来可以对这些性 能进行深入研究,进一步了解小水线 面双体船的全面性能。
阻力性能是小水线面双体船设计的重要性 能指标,直接影响到船舶的航速、航程和 能耗。
传统的实验测试方法存在成本高、 周期长等问题,因此数值模拟方法 成为研究小水线面双体船阻力的重 要手段。
研究意义
01
通过研究小水线面双体船阻力及其数值模拟方法,有助于提高 船舶设计效率,缩短研发周期,降低研发成本。
02
其次,本文所提出的数值模拟方法虽 然能够模拟小水线面双体船的阻力, 但精度和效率仍需进一步提高。未来 可以尝试采用更先进的数值模拟技术 ,如高精度网格生成技术、湍流模型 等,以提高模拟精度和效率。
最后,小水线面双体船作为一种新型 船型,其设计和制造仍存在许多问题 需要解决。未来可以对小水线面双体 船的设计和制造进行深入研究,探索 更优化的设计方案和制造工艺,为实 际应用打下基础。
02
船舶操纵性
通过数值模拟方法可以评估船舶操纵性能,提高船舶操纵效率。
03
船舶流场分析
通过数值模拟方法可以分析船舶周围流场,了解流体对船舶的影响。
04
小水线面双体船阻力数值模拟应用
小水线面双体船模型建立
船体几何形状定义
根据小水线面双体船的设计特点 ,精确地定义船体的几何形状, 包括船体的长度、宽度、高度以 及船体的各个局部细节。
双体船的总体性能设计
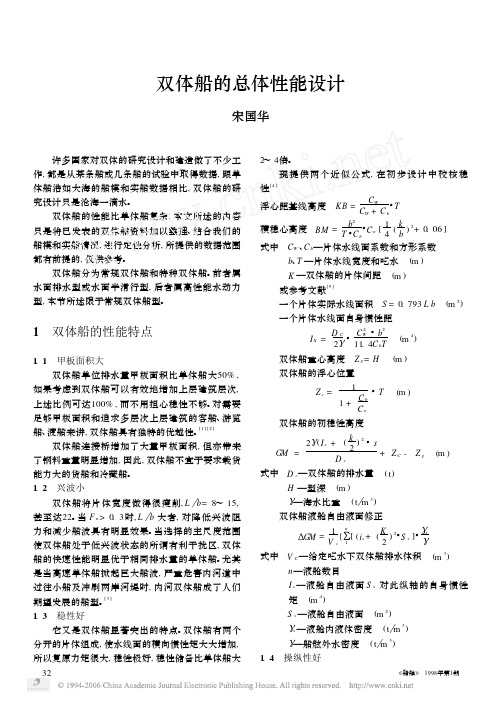
图3 平均破损吃水和破损舱长度, 它沿船长的位置和 渗透系数的关系
(m )
L 船长 (m )
Λ 破损舱的渗透率 计算步骤: ( 1) 参数
a ′ ′ d = f (X L . Λl L ) →Η d Η B
950 t L B = 1. 961 L b = 5. 12 b T = 1. 79
K b= 1. 61。
同时测试的海上救助拖船 ( 功率588 kW , 排水 量 880 t ) , 平均横摇角达 18° - 20° , 谐摇时达 27° 30° 。
中国船舶及海洋工程设计研究院双体船模型摇 摆试验[ 7 ] 结果见表2。 双体船横摇自摇周期随间距比 k b 增大而略有减小, k b 愈大, 如 k b> 2. 5时, 不仅 横摇角大大下降, 而且舷边加速度接近于单体船, 这 点尤为人们注意。 表 2
5级海 5级海 况下 Η况下 a 10° 0. 25 g 45° 0. 25 g
2
双体船的横摇特点是: (1) 当波长等于片体间距时, 双体船的两个片 体始终同时处在波峰、 波谷或者其他波浪斜率相同 的位置, 这时双体船只会作升沉运动而不产生横摇。 当波长等于2 ~ 3 倍片体间距时, 一个片体处于 波峰, 另一个片体处于波谷, 这时双体船横摇最激 烈。 我国沿海多此海况, 故旅客对沿海双体船持批评 态度。 (2) 双体船在大风浪中将如小木筏随波面运 动, 这时双体船最大横摇角等于最大波面斜度 180 如长波的 Κ h ≥20, 则双 h Κ( h Κ为波浪的坡度比) 。
《船舶》 1998年第1期
双体船的总体性能设计
双体船的总体性能设计双体船,也称为双体船只,通过采用两个船体并行排列的设计,具有较高的稳定性和良好的操纵性能。
总体性能设计在双体船的设计过程中起着关键的作用,旨在确保船只的运输效率、舒适性、安全性和可靠性。
以下是双体船的总体性能设计的要点和考虑因素。
1.水动力性能:包括船只的阻力、航速、船体稳定性和操纵性能等。
通过对水动力性能的分析和计算,可以确定出船只的最佳尺寸、型线和布局。
双体船的双船体结构使得其具有较低的阻力和较好的航速性能,但也需要确保船体之间的流体动力特性协调一致。
2.结构设计:包括船体强度、船体刚度和船体的耐久性等。
双体船的结构设计需要考虑两个船体之间的连接和相互作用,在保证结构强度的同时,还需要平衡船体的重量和稳定性。
3.载重能力:双体船具有较高的载重能力,可以满足不同的运输需求。
在总体性能设计中,需要对船只的载重能力进行估算和计算,以确保船只能够安全、稳定地携带所需的货物或乘客。
4.舒适性设计:双体船的双船体结构可以提供更好的平稳性和减少颠簸感,从而提高乘坐舒适性。
在总体性能设计中,需要考虑船舶内部的布局设计、客舱的舒适性和设施等,以提供更好的乘坐体验。
5.安全性设计:双体船的设计应确保船只能够在不同的海况条件下保持稳定,并具备良好的自救能力。
在总体性能设计中,需要对船只的稳定性、操纵性和防浸能力等进行评估和优化,从而提高船只的安全性能。
6.可靠性设计:双体船需要具备良好的可靠性,确保在长时间运输过程中能够保持正常的运营状态。
总体性能设计中,需要考虑船只的系统设计、设备选型和维护保养等,以确保船只的可靠性和故障率的控制。
总体性能设计是双体船设计过程中的一个重要环节,需要综合考虑不同的因素并进行优化。
通过合理的总体性能设计,可以使双体船具备较高的运输效率、舒适性、安全性和可靠性,满足不同的航运需求。
基于CFD的36英尺水翼双体船阻力与运动预报
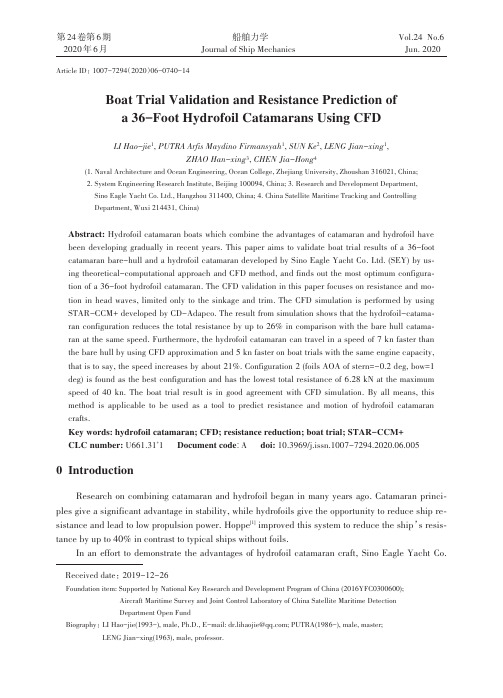
Boat Trial Validation and Resistance Prediction of a 36-Foot Hydrofoil Catamarans Using CFDLI Hao-jie 1,PUTRA Arfis Maydino Firmansyah 1,SUN Ke 2,LENG Jian-xing 1,ZHAO Han-xing 3,CHEN Jia-Hong 4(1.Naval Architecture and Ocean Engineering,Ocean College,Zhejiang University,Zhoushan 316021,China;2.System Engineering Research Institute,Beijing 100094,China;3.Research and Development Department,Sino Eagle Yacht Co.Ltd.,Hangzhou 311400,China;4.China Satellite Maritime Tracking and Controlling Department,Wuxi 214431,China)Abstract:Hydrofoil catamaran boats which combine the advantages of catamaran and hydrofoil have been developing gradually in recent years.This paper aims to validate boat trial results of a 36-foot catamaran bare-hull and a hydrofoil catamaran developed by Sino Eagle Yacht Co.Ltd.(SEY)by us⁃ing theoretical-computational approach and CFD method,and finds out the most optimum configura⁃tion of a 36-foot hydrofoil catamaran.The CFD validation in this paper focuses on resistance and mo⁃tion in head waves,limited only to the sinkage and trim.The CFD simulation is performed by using STAR-CCM+developed by CD-Adapco.The result from simulation shows that the hydrofoil-catama⁃ran configuration reduces the total resistance by up to 26%in comparison with the bare hull catama⁃ran at the same speed.Furthermore,the hydrofoil catamaran can travel in a speed of 7kn faster than the bare hull by using CFD approximation and 5kn faster on boat trials with the same engine capacity,that is to say,the speed increases by about 21%.Configuration 2(foils AOA of stern=-0.2deg,bow=1deg)is found as the best configuration and has the lowest total resistance of 6.28kN at the maximum speed of 40kn.The boat trial result is in good agreement with CFD simulation.By all means,this method is applicable to be used as a tool to predict resistance and motion of hydrofoil catamaran crafts.Key words:hydrofoil catamaran;CFD;resistance reduction;boat trial;STAR-CCM+CLC number:U661.31+1Document code :A doi:10.3969/j.issn.1007-7294.2020.06.0050IntroductionResearch on combining catamaran and hydrofoil began in many years ago.Catamaran princi⁃ples give a significant advantage in stability,while hydrofoils give the opportunity to reduce ship re⁃sistance and lead to low propulsion power.Hoppe [1]improved this system to reduce the ship ’s resis⁃tance by up to 40%in contrast to typical ships without foils.In an effort to demonstrate the advantages of hydrofoil catamaran craft,Sino Eagle Yacht Co.第24卷第6期船舶力学Vol.24No.62020年6月Journal of Ship Mechanics Jun.2020Article ID :1007-7294(2020)06-0740-14Received date :2019-12-26Foundation item:Supported by National Key Research and Development Program of China (2016YFC0300600);Aircraft Maritime Survey and Joint Control Laboratory of China Satellite Maritime Detection Department Open FundBiography :LI Hao-jie(1993-),male,Ph.D.,E-mail:******************;PUTRA(1986-),male,master;LENG Jian-xing(1963),male,professor.第6期LI Hao-jie et al:Boat Trial Validation and Resistance (741)Ltd.(SEY),located in Fuyang district,Hangzhou,China,has based their interest in retrofitting their un-launched new products‘Aquila36(A36)’into‘hydrofoil catamaran craft’.Since the research objects of A36bare-hull and hydrofoil catamaran have been developed,the full scale test or boat trial is then carried out to observe actual craft performance.The data obtained from boat trial fur⁃ther are validated by using theoretical-computational approach and Computational Fluid Dynamics (CFD)in this paper.The CFD assessment for boat trial validation in this paper focuses on resistance and motion of A36hydrofoil catamaran boats in head waves,limited only to the sinkage and trim.CFD simulation has been proved to be able to solve some certain problems recently.Orihara and Miyata[2]applied WISDAM-X method and used overlap grid system to analyze container ship resistance in head waves.Migeotte and Kornev[3]used CFD simulation to calculate the planing hull hydrofoil-assisted catamaran resistance by employing non-linear vortex lattice methods,and compared the results be⁃tween CFD simulation and experiments.He et al.[4]used URANS solvers CFD Ship-Iowa to assess the capability for prediction of resistance,sinkage and trim,and found a good agreement between the numerical results and experimental data.Frisk and Tegehall[5]compared and investigated the planing hull boats resistance and running attitude using two commercial CFD software ANSYS FLU⁃ENT and STAR-CCM+.An indicator of success in hydrofoil catamaran boat development can be seen by its resistance reduction in comparison with conventional hull.Thus,resistance values and running attitude of A36 catamaran hull and A36hydrofoil catamaran were investigated and compared in both boat trial and CFD.Several configurations of A36hydrofoil catamaran were also presented and investigated to find the most optimum configuration.The CFD simulation was performed by using STAR-CCM+de⁃veloped by CD-Adapco in this paper.1Theoretical approaches1.1Hydrofoil catamaran principlesThe main idea in the development of hydrofoil catamaran is to take advantages of both catama⁃ran and hydrofoil.Catamaran has the advantage of great stability and lower resistance.Addition of hydrofoils under the ship hull provides a dynamics lifting force which is able to lift the ship hull out of water surface.At a certain speed,the lift produced by the hydrofoils is the same as the boat weight,therefore the ship hull starts to be lifted out of the water,the ship weight will rely on the hy⁃drofoil.Thus the resistance caused by hull and water interaction reduces,the lifting force of the hy⁃drofoils will increase with the inerease of the ship speed.The hull will be lifted until its maximum position and the lift force arising from the hydrofoils becomes constant.1.2Foil lift and dragThe hydrofoil lift force(F L)as shown in Fig.1can be obtained using the following equation,F L=12ρV2AC L(1) whereρis the water density,V is the foil velocity,C L is the foil lift coefficient and A is the foil sur⁃face area.A=λb2,whereλis the foil aspect ratio and b is the foil chord[6].The hydrofoil lift coefficient (C L )varies ac⁃cording to the Angle of Attack (AOA).Implementa⁃tion of C L with finite aspect ratio,moving under free water surface is [6],C L =k φ()∂C L ∂α0()α+α0-∆α01+()∂C L ∂α0k φπλ1+τς+θ(2)where the derivative()∂C L∂αis valid for a deeplysubmerged and infinite aspect ratio of hydrofoil.The apparent attack angle,α,is the angle of inter⁃section among trailing edge,leading edge and horizontal line.Therefore,α0is the effective zero-at⁃tack angle whereas,Δα0and k φare correction values of the effective angle of attack and the lift de⁃rivative for free water surface proximity.Next,λand τare finite aspect ratio and Glauert correction.The function of the strut positions,foil position and aspect ratio accounted by ςfor the foil submer⁃gence effects and θfor the strut influence.For simplified 2D thin wing,the coefficient ()∂C L∂α0is equal to 2πand αT represents the AOArelative to the zero angle attack and flow direction.Hence the values of C L are given byC L =2παT (3)The formulations described above are valid only for near-plane or low dead-rise foils,sepa⁃rate,shallowly submerged,which means the foil depth is less than span,non-cavitating,steady and in calm water or all in ideal condition [6].Thus,the expression is implemented to predict hydrofoil lift with varied number of AOA in this paper.Speer [7]divided foil drag into various components along with each component equation.The equation below depicts drag-governing equations and its components,D =q ∙C f ∙S w +q ∙N i ∙C Di .t 2+q ∙N s ∙C Ds ∙t 2+S w ∙q ∙C Dw +1q L 2[]π()b 2∙E (4)Total drag=Viscous drag+Interference drag+Spray drag+Wave drag+Induced dragq =12ρV 2(5)where C f is skin friction drag coefficient,S w is wetted area of hydrofoil,N i is the number of 90°junc⁃tions,C Di is interference drag coefficient,t is the foil thickness,N s is the number of elements leav⁃ing the water,C Ds is spray drag coefficient regardless of the angle at which they left water,b is foilspan,C Dw is wave drag coefficient,C Dw =0.5C 2LFr 2i e2/Fr2i,Fr i=V gi ,g is gravity and i is the quarter chord depth and E is the lifting surface correction,E =1+2()AR 2,whereas AR is foil aspect ratio,AR =s 2/S w ,with s as foil span.An addition of separation drag due to thin airfoil stall,C Dsep ,alsoFig.1General scheme of a hydrofoil [6]742船舶力学第24卷第6期needs to be considered as total drag components [8]as follows:C Dsep =sin 2α0.222sin α+0.283-()sin αcos α0.222sin α+0.283πAR(6)1.3Numerical methodsThe Sear Stress Transport (SST)k-ωturbulence model which has the advantages of both k-ωand the k-εmodel is used in this rsson et al [9]found that this model has better flow details around ship stern than k-εturbulence model.The Volume of Fluid (VOF)method is used to track and mark an interface between two phases of fluid in order to simulate a body motion in the water.The standard Navier-Stokes equation is then modified to obtain average fluid properties as follows:∂U i ∂t +U j ∂U j ∂x j =-1ρ∂P∂x i +v ∂2U i ∂x j x j+g i +S i ,s *(7)where S i ,s *is a surface tension force which is calculated from momentum exchange throughout the in⁃terface.The dynamic interaction between body and fluid needs to be simulated to solve the equation of motion and find the actual position of rigid body [10].The number of degrees of freedom (DOF)rep⁃resents the number of translational and rotational motion directions of the body.The Finite Volume Method (FVM)is a numerical method to obtain a set of linear algebraic equations by discretizing a continuous partial differential equation (PDE)[11].Basically,the solution domain is divided into a finite number of small volumes based on the cells in a computational grid or mesh at first.Then,the discrete modes of the integral form of the continuum transport equations can be applied to each control volume [10].2Computational methods2.1Hull and foil geometryThe data of hull and foils for current study are obtained from Sino Eagle Yacht Co.Ltd.(SEY)A36project.The standard designs,by J&J Jakopin,were modified to meet the requirements of hy⁃drofoil catamaran craft.The principal ship dimensions are described in Tab.1and the geometries of the models are shown in Fig.2and Fig.3.NACA Foil 16309is used as the foil reference in this project.The lift forces of foils are approx⁃imated by implementing tools for predicting hydrofoil performance established by Matveev [6].The re⁃sults of foil and drag calculation with several AOA and hydrofoil configurations are shownTabs.2-4.Fig.2Hullgeometries Fig.3Foil geometries第6期LI Hao-jie et al:Boat Trial Validation and Resistance (743)Tab.2Bow foil lift and drag forcesAOA (°)00.411.41.5Speed (kn)Foil lift (t)200.380.580.881.081.03300.861.311.982.432.54401.532.333.534.324.52Foil drag (t)200.040.050.070.090.10300.100.120.170.220.23400.180.220.310.390.42Tab.3Stern foil lift and drag forcesAOA (°)-0.4-0.200.20.4Speed (kn)Foil lift (t)201.041.181.311.451.58302.352.652.963.263.57404.184.725.265.816.35Foil drag (t)200.0500.0530.0560.0590.06300.1130.1190.120.130.14400.200.210.220.230.25Tab.4Hydrofoil configurations and liftingforcesTo the placement determined by using Eqs.(12)and (13)consider the boat weight and lift force acting on the foils [12].L 1+L 2=W boats ,L 1∙X 1=L 2∙X 2(8-9)where W boats is boat weight,L is lift,X is dis⁃tance of foil away from Center of Mass (CoM).The stern foils are then installed at the boats after perpendicular (AP),while the bow foils are placed 2m behind forward perpendicular (FP).The distance between bow and stern (X )is 7.4m,and this configuration can be seen in Tab.1Principal ship dimensionItemsLength of over all Length on water line Beam Demihull spacing Spacing hull to length ratioDraftDisplacement Engine Symbol L OA L WL BDemihull S /L T∇Particular dimension10m9,2m 4,4m 1,372m 0,2740,56m 8,100kg 2×300hpFig.4Foil configuration of Aquila 36Hydrofoil built in AutoCAD (side view)744船舶力学第24卷第6期Fig.4.2.2Computational setup2.2.1Computational domain and mesh generationA large domain,as shown in Tab.5and Fig.5,was created to avoid reflection effects on the boundaries.Since only dynamic sinkage and trim motions are considered in this paper,the problem is symmetric and only half of the hull was modeled.Overset mesh method (Fig.6)wasused for mesh generation in this simula⁃tion.This method allows mesh struc⁃tures to change dynamically along with the moving objects.Overset method con⁃tains two overlapping meshes.One is called overset mesh for the moving part,and the other one is called stationary mesh for the background.Subsequently,the equations of motion and rotation of the body are solved to determine mesh position when fluid-solid interaction occurs.2.2.2Multiphase flow model,motion and boundary conditionThe turbulence was modeled using RANS equations combined with the Shear Stress Transport(SST)k -ωturbulence model.Wall functions were used to avoid simulation resolving the whole boundary layer.Multiphase flow model combined with VOF methods is used to resolve the free sur⁃face model.Water and air are treated to be incompressible and their properties are assumed to be constant.The 6DOF solver is used.As a special case,only the translational motion along z -axis (heave)and rotational motion around y -axis (pitch)are considered in this paper.The boundaries of the computational domain are illustrated in Fig.7.The computational do⁃main is divided into 2main regions,background region and overset region describing ship geome⁃try.Boundary definition and setting are shown in Tab.6.The simulation results show that the value oscillates around the equilibrium condition with relatively small amplitudes.Frisk ’s methods [5]were adopted in this study to calculate average values of sampled data and determine sampling in⁃tervals for theapproximation.Fig.5Computational domain of the A36boat in STAR-CCM+Fig.6Illustration of mesh structure inSTAR-CCM+Tab.5Setting of computational domainDomainShip length,LDomain distance in front of model,M >=L Domain distance behind the model,N >=2L Domain distance above the model,O =LDomain distance under the model,P =2ODomain distance beside the model,Q >=0.5(N+L )Dimension (m)101222102016第6期LI Hao-jie et al:Boat Trial Validation and Resistance (745)3Simulation results3.1Bare hull resistance and motionBare hull motion was simulated by using numerical methods described in previous chapter.Its results are then compared with hydrofoils,thus the efficiencies values are found.The prediction of bare hull is also conducted in Maxsurf resistance by using Savitsky method,and the engine thrust values related to resistance can also be obtained.Savitsky method is an algorithm set for estimating planing hull performances in resistance and power developed by Daniel Savitsky [13].The results of Savitsky resistance and power prediction for Aquila 36hulls can be seen in Tab.7.Tab.7Resistance and power prediction of Aquila 36hull obtained using Savitsky methodFig.7Boundaries of the computational domainBoundary nameBackground regionInletOutlet Side Top Bottom SymmetryOverset regionBoats Overset boundaryOverset symmetryBoundary type Velocity inlet Pressure outletSymmetry plane Velocity inlet Velocity inlet Symmetry plane Wall no-slipOverset meshSymmetry planeTab.6Boundary definitionFig.8Trim motion and water surface contour of Aquila 36hull by STAR-CCM+at speeds of=20,30and 33kn746船舶力学第24卷第6期From Tab.7,we can see that the maximum resistance obtained by using Savitsky method suit⁃able for 300hp engine is 13.8kN while the total resistance for the maximum speed of 33kn ob⁃tained by CFD simulation is 13.58kN.The resistances obtained by the two methods agree with each other very well.The planing hull ship has 3motion phases,namely displacement,transition and planing phase.The hull motions at transition and planing phases are depicted in Fig.8with the water surface contour plot of the hull at speeds of 20,30and 33kn.The water surface height is denoted by colored contour.Red colored surface expresses the highest waterexpressed by blue color.The transition phase has the highest resistance,trim angle and wave pat⁃tern intensity in comparison with the planing phase.Tab.8gives the bare hull resistance.3.2Hydrofoil catamaran resistance and motionFour configurations of hydrofoil with different foil AOA are considered as shown in Tab.4.Foil configurations and resistance results for different speeds are given in Tab.9.The maximum speed used was 40kn.It was found that the whole body was lifted away from water surface and re⁃lied on its foils only when its speed exceeded 40kn,and the total resistance was reduced accord⁃ingly.Tab.9Foil configuration and resistance obtained by STAR-CCM+Configu⁃ration 1,2,3and 4.The motion phases of the hydrofoil catamaran are similar to the bare hull.The hydrofoil transition phase can be seen at around 20kn,the trim angle increases from displacement phase and reduces after the transition phase,and then becomes stable at around 40kn.Fig.9Trim motion and water surface contour of Aquila 36Hydrofoil Configuration 1bySTAR-CCM+at speeds of 20,30and 40knTab.8Bare hull resistance obtained by 第6期LI Hao-jie et al:Boat Trial Validation and Resistance (747)Fig.10Trim motion and water surface contour of Aquila 36Hydrofoil Configuration 2bySTAR-CCM+at speeds of 20,30and 40knFig.11Trim motion and water surface contour of Aquila 36Hydrofoil Configuration 3bySTAR-CCM+at speeds of 20,30and 40knFig.12Trim motion and water surface contour of Aquila 36Hydrofoil Configuration 4bySTAR-CCM+at speeds of 20,30and 40knTab.10Resistance and speed comparison of the bare hull and hydrofoilcatamaran748船舶力学第24卷第6期tions.It is demonstrated that the hydrofoil system can generally reduce total resistance by up to 26%by comparison with the bare hull at the same speed.Moreover,the hydrofoil catamaran could travel in a speed of 7kn faster than the bare hull with the same engine capacity;that is to say,the speed increases by about 21%.Fig.13gives 4hydrofoil configurations and resistance results obtained by CFD simulation.Connecting the graph in Fig.13with foil lift cal⁃culation in each configuration in Tab.4,it is known that Configurations 1and 2produce the lowest lifting force among all the configurations,and its value is approximately equal to the boat displacement.Whereas the foil lifting force was set higher than the boat displacement,at the maxi⁃mum speed,for Configurations 3and 4.This is intended to allow boats perform a planing condition earlier than Configurations 1and 2.In the simulation,this objective is then achieved,known by see⁃ing their motions and total resistance lower than Configuration 1after the transition phase.But,con⁃versely,their resistances become higher than Configuration 1and 2when the speed exceeds 35kn.Initially,this condition may occur because the foils over-produce their lifting force and cause their structures away from the water.The foils thus lose their lifting force when coming out of the water and making the boats hull sink down.This condition then occurs continuously,which in result,the total resistance values increase.On the other hand,Configuration 2shows a similar behavior like Configurations 3and 4until the speed reaches 30kn,but keeps showing good performance,with the total resistance values be⁃low Configuration 1up to the maximum speed.Thus,we can consider that Configuration 2showes the best performance of resistance and motion from CFD simulation.4Boat trial results and validationThe boat trial was done in several conditions and configurations as shown in Tab.11.Tab.11Trial configuration of Aquila 36Configuration nameTrial Configuration 1Trial Configuration 2=CFD Configuration 2Trial Configuration 3=CFD Configuration 3Trial Configuration 4=CFD Configuration 4Configuration settingA36Bare -HullA36Hydrofoil with AOAA36Hydrofoil with AOA A36Hydrofoil withAOA Bow:1degStern:-0.2deg Bow:1.5deg Stern:0.2deg Bow:1.5deg Stern:0.4deg A36bare hull trial,or Trial Configuration 1,was carried out by adjusting the trim angle of out⁃board engine and stern flap in several experimental times.Stern flap is a plate extension of the hull bottom surface located at the aft of the transom,as shown in Fig.14.This device is expected to in⁃crease vertical lift force at the transom by modifying flow surrounding aft body and increasing pres⁃Fig.13Resistance for each configuration第6期LI Hao-jie et al:Boat Trial Validation and Resistance (749)sure distribution.In result,the total hull resistance is reduced.The stern flap installed into A36boat is ad⁃justable and its trim is able to be automatically con⁃trolled onboard within the range of 0°-5°.Boat trials were performed in Fuchun River,Hang⁃zhou,China.Two tracks were used during trials,the first is for the boat against the water current named up⁃stream and the second is for the boat in the same direc⁃tion with water current named downstream.The boatweight before trial is about 8.1t with an average draft of 0.52m.The results of A36bare-hull trials at the maximum engine rotation speed for upstream and downstream are shown in Tab.12.Tab.12The results of A36bare-hull trials for upstream anddownstreamflap and engine are at trim of 3°.Whereas during downstream running,the highest speed is 34.2kn,reached when the flap trim is 3°and engine trim is 1°.The average speed for all configurations is 32.61kn or ~33kn.Fig.15shows images of A36bare-hull trial compared with CFD motion prediction at the same speed.The bare-hull trials result show good agreement in motion and speed in comparison with CFD simulation.Fig.15A36bare hull trials and CFD simulation resultsActually there are 4design configurations of A36hydrofoil,but only 3configurations were per⁃formed and investigated by boat trials in accordance with the company ’s consideration.The average maxi⁃mum speeds of each configuration recorded are shown inTab.13.Fig.14Stern flaps of A36boat Tab.13Maximum speed average ofeach foilconfigurationFig.16shows images of A36hydrofoil catamaran during boat trials compared with CFD simula⁃tion at the same speed.From those images we can consider that boat trial results of hydrofoil cata⁃maran also show good agreement in motion compared with CFD simulation.Fig.16A36Hydrofoil catamaran during boat trials (planing phase)and CFD simulation resultsThe resistance value from A36hydrofoil trial in this research was determined by super⁃imposing pictures or videos with CAD model.Recorded videos from boat trials were split into several pictures and then imported to Maxsurf software and superimposed to find the actual Wetted Surface Area (WSA)of the hull which was further used as input data to calculate resis⁃tance values,as shown in Fig.17.Resistance ofA36hydrofoil catamaran obtained by using this approximation of each configuration is presented in Tab.14.Tab.14Boat trial resistance of eachconfigurationTab.15Comparison of resistance and speed from CFD and boattrialsmotionFig.17Superimposing video of boat trialand resistance values in a certain speed.Tab.15shows the comparison of resistance values and speed from CFD and boat trials.Generally,the motion and resistance values show good agreement between CFD simulation and boat trials.Configuration2of A36hydrofoil catamaran presents a bet⁃ter performance in speed,motion and resistance at the maximum speed by comparing the results with other configurations.Thus,this paper suggests that Configuration2is regarded as the most op⁃timum hydrofoil configuration.5ConclusionsMotions of bare hull catamaran and hydrofoil catamaran with different foil angles were ob⁃served during boat trials and validated by using CFD simulation.The motion phases of two kinds of boats are similar.Generally,the transitional phase occurs at a speed of about20kn,then is reduced along with the trim angle,and finally becomes stable.However,the bare hull is lifted partially from the water surface whereas the hydrofoil catamaran was fully lifted and just relied on its foil system. This phenomenon reduces total resistance of hydrofoil catamaran by up to26%in comparison with the bare hull at the same speed using CFD simulation.Furthermore,the hydrofoil catamaran can travel in a speed of7kn faster than the bare hull by using CFD approximation and5kn faster on boat trials with the same engine capacity,that is to say,the speed is increased by up to about21%. Comparison of resistances for hydrofoil catamarans with several foil angle configurations and speed was carried out,and the most efficient configuration was chosen.The boat trial results were validat⁃ed by comparing those with CFD simulation and showed good agreement with each other.References[1]Hoppe K G.Recent application of hydrofoil supported catamaran[J].Fast Ferry International,2001:1-20.[2]Orihara H,Miyata H.Evaluation of added resistance in regular incident waves by computational fluid dynamics motion simu⁃lation using an overlapping grid system[J].Journal of Marine Science and Technology,2003,8(2):47-60.[3]Migeotte G,Kornev N.Development of modern hydrofoil-assisted multi-hulls[C].China International Boat Show&HPMV Conference,2004.[4]He Wei,Castiglione T,Kandasamy M,Stern F.Numerical analysis of the interference effects on resistance,sinkage and trim of a fast catamaran[J].Journal of Marine Science and Technology,2015,20:292-308.[5]Frisk D,Tegehall L.Prediction of high-speed planing hull resistance and running attitude[D].Chalmers University of Tech⁃nology,Gothenburg,Sweden,2015:55.[6]Matveev K,Duncan R.Development of the tool for predicting hydrofoil system performance and simulating motion of hydro⁃foil-assisted boats[C].High Speed/High Performance Ship and Craft Symposium,Washington,USA,2005.[7]Speer T.Generic hydrofoil trade study[EB/OL].[2016-10-04].\hydrofoil\generic.pdf.[8]Migeotte.Development of hydrofoil supported catamaran with semi displacement hulls[D].Department of Mechanical Engi⁃neering,University of Stellenbosch,South Africa,1997.[9]Larsson L,Stern F,Bertram V.Benchmarking of computational fluid dynamics for ship flows:The Gothenburg2000work⁃shop[J].Journal of Ship Research,2003,47:63-81.[10]CD-Adapco STAR-CCM+User guide version10.06[M].CD-Adapco,2015.[11]Toro E F.Riemann solvers and numerical methods for fluid dynamics[M].Springer-Verlag,1999.[12]Slamet A S,Suastika Kajian K.Eksperimental pengaruh posisi perletakan hydrofoil pendukung terhadap hambatan kapal[J].Jurnal Jurusan Teknik Perkapalan Fakultas Teknologi Kelauatan Institut Teknologi Sepuluh Nopember,2012. [13]Savitsky D,Brown P W.Procedure for hydrodynamic evaluation of planning hulls in smooth and rough water[J].Marine Technology,1976,13(4):381-400.基于CFD的36英尺水翼双体船阻力与运动预报李豪杰1,PUTRA Arfis Maydino Firmansyah1,孙科2,冷建兴1,赵汉星3,陈嘉鸿4(1.浙江大学海洋工程学系船舶与海洋结构研究所,浙江舟山316021;2.中国船舶工业系统工程研究院,北京100094;3.浙江杭州华鹰游艇有限公司,杭州311400;4.飞行器海上测量与控制联合实验室,江苏无锡214431)摘要:近年来,兼具双体船和水翼船优点的水翼双体船迅速发展。
小水线面双体船阻力及其数值模拟方法研究

小水线面双体船阻力及其数值模拟方法研究随着科技的不断发展,人们对于水上运输的需求也越来越高,而其中的阻力问题一直是制约船只速度的重要因素。
近年来,小水线面双体船因其具有较小的阻力、良好的平稳性、大载货量等优点而备受关注。
本文将重点探讨小水线面双体船阻力及其数值模拟方法研究。
一、小水线面双体船阻力的构成小水线面双体船的阻力主要由摩擦阻力、压力阻力和波浪阻力所组成。
其中摩擦阻力和压力阻力发生在船苗和船身表面,波浪阻力则是因为船体在水面上运动时,其周围的水形成波浪导致。
1. 摩擦阻力摩擦阻力指的是,船体表面与水流接触时,由于摩擦而产生的阻力。
摩擦阻力主要受到流体黏性、流体密度、流速、船体表面粗糙度和湍流程度的影响。
通常情况下,摩擦阻力占整个船体阻力的比例较小。
2. 压力阻力压力阻力是由于船体移动时,在船体前部会产生压力导致船体后部产生负压力而产生的。
船体成形和船速是影响压力阻力的两个主要因素。
一般来说,压力阻力约占船体阻力的20%到30%。
3. 波浪阻力波浪阻力是因为船体在水面上运动时,其周围的水形成波浪导致。
波浪阻力是船体阻力的主要组成部分。
波浪阻力的大小与船体速度、船型和水深等因素有关。
对于小水线面双体船而言,由于其设计采用了双体结构,其波浪阻力相对其他类似大小的船而言要小一些。
二、小水线面双体船阻力的数值模拟方法研究1. 流体动力学数值模拟方法流体动力学数值模拟方法是利用计算机模拟流体力学的方法。
通过对流体的运动逆推出其力学行为。
通过数学模型来描述流体的各个特性,使用数学运算求出船体所受到的各个力学参数,进而计算出船体的运动特性,从而对其阻力进行分析。
2. 边界元法边界元法是一种计算机数值模拟方法,其原理是将解析求解过程转化为离散求解。
边界元法适用于很多物理问题,如电磁场、声学、热力学和流体动力学等。
边界元法可以用于计算整个流体流动领域内的力学参数,精度高,计算效率高。
三、结论小水线面双体船的阻力主要包括摩擦阻力、压力阻力和波浪阻力。
双体船的总体性能设计
2 2
1 双体船的性能特点
1. 1 甲板面积大
IX =
2Χ
双体船单位排水量甲板面积比单体船大 50% , 如果考虑到双体船可以有效地增加上层建筑层次, 上述比例可达100% , 而不用担心稳性不够。 对需要 足够甲板面积和追求多层次上层建筑的客船、 游览 [1][2] 船、 渡船来讲, 双体船具有独特的优越性。 双体船连接桥增加了大量甲板面积, 但亦带来 了钢料重量明显增加, 因此, 双体船不宜于要求载货 能力大的货船和冷藏船。 1. 2 兴波小 双体船将片体宽度做得很瘦削, L b = 8~ 15, 甚至达 22。 当 F n > 0. 3 时, L b 大者, 对降低兴波阻 力和减少船波具有明显效果。 当选择的主尺度范围 使双体船处于低兴波状态的所谓有利干扰区, 双体 船的快速性能明显优于相同排水量的单体船。 尤其 是当高速单体船掀起巨大船波, 严重危害内河道中 过往小船及冲刷两岸河堤时, 内河双体船成了人们 [3] 期望发展的船型。 1. 3 稳性好 它又是双体船显著突出的特点。 双体船有两个 分开的片体组成, 使水线面的横向惯性矩大大增加, 所以复原力矩很大, 稳性极好, 稳性储备比单体船大
L) L)
高速双体船适航性研究表明[ 5 ] , 高速时的横摇 角和横摇加速度分别比低速时缓和3- 3. 5 倍和22. 5倍; 高速时双体船纵摇角和纵摇加速度超过相同 参数的单体船。 图1是常规单体船和双体船横摇和纵
33
摇3% 保证率的角度摆幅。
图1 单体船和双体模型横摇纵摇3% 保证率的角度摆幅
排水体积佛氏数 F b 谐摇时 qm 谐摇时 am
双体船 单体船
45 45
k b
基于兴波理论与阻力图谱资料的高速双体船阻力预报方法
Vo.0 1 No5 1 .
O t2 O c. O 6
基 于兴 波理论与 阻力图谱资料 的 同 速双体船 阻力预报方法
-.L . .J _ 口
赵 连 恩 1, 振 煌 ’ 应 业炬 .杜 2 ,
( 浙 江 海 洋 学 院 , 江 舟 山 3 60 2哈 尔 滨 工 程 大学 , 尔 滨 10 0 ) 1 浙 104; 哈 50 1
维普资讯
第 1 0卷第 5期
20 0 6年 l 0月
文章 编 号 : 0 7 7 9 (0 6 0 — 0 7 0 10 — 2 4 2 0 )5 0 1 - 7
船 舶力学
J un lo hp Me h nc o ra fS i c a is
实 用 、 效 、 活 、 捷 和可 靠 的 计 算 方 法 。 高 灵 便
关 键词 : 高速 双 体 船 阻 力 汁算 ; 尾 阻 力 重 分析 图谱 ; 船 理 论 ; 幅 函数 ;兴 波 阻力 理 论 ;电子 阻力 图 表 方 薄 波
中 图分 类 号 : 6 l U 6 文献标识码 : A
t n o i o s r ssa c e c l u a e y Mir s f E c li h oe p o e sT e c lu a in r s l f i fvs u e i n e b a c l td b c o o t x e n t e wh l r c s .h a c l t e u t o o c t o s a x mp eW P 0 f rwa e i r i g c t ma a h w t a h t o s a p id i h ef in y a i n n e a l , 6 , o v p e c n aa r n s o h tt e me h d i p l ,h g fi e c , gl a d e c e d p n a l. e e d be
双体船的总体性能设计续2
双体船的总体性能设计(续2)宋国华6 双体船阻力估算双体船阻力分成片体阻力和片体间干扰阻力两部分。
由于片体间干扰阻力反映在剩余阻力上,而片体间水流加快导致摩擦阻力的变化忽略不计,这样,双体船阻力估算可以像单体船一样,分为摩擦阻力、剩余阻力和空气阻力。
下面介绍估算方法。
6.1 参考文献[11]为内河双体船的阻力计算,它的标准片体线型见图46。
计算参数:片体相对间距比C=c2bc—在吃水T时两片体舯横剖面处内侧舷之间的距离 (m)b—在吃水T时片体舯横剖面处的宽度 (m)雷诺数R e=V・LL—在吃水T时船舶水线长度 (m)v—船速 (m s)Τ—在某水温下的运动粘性系数 (m s)排水体积佛氏数F r∃=F n L∃1 3F n=VgL佛氏数,F n=0.5为临界速度点∃—在吃水T时的双体船排水体积 (m3)计算公式及图表总阻力系数 C t=(C f+∃C f)+C R+C1+C2总阻力 R=12p sc t・V2其中,摩擦阻力系数 C f=0.455(logR e)2.58粗糙度补贴∃C f=(0.3~0.7)×10-3对高速船和较大的船取小值。
空气及附体阻力系数C1+C2=(0.1~0.15)×10-3剩余阻力系数:(1)C R=C L b R・x b T・x cb本公式用于F n<0.5的深水内河双体船。
C L b R、X b T、x cb由图41、42、47、48、49、50、51、52确定。
(2)C R=C L b R・x b T・x cb・k e本公式用于F n> 0.5的深水内河双体船。
C L b R、X b T、x cb由图43、44、45、53、54、55、56、57、58确定。
k e=C RC RO=实船的内侧间距比C时的剩余阻力值计算时采用的图谱内侧间距比C时的剩余阻力值由图59确定例如:F n=0.71,实船C=0.575,计算采用图谱C= 0.5查图59,分别为C R=1.24,C RO=1.315所以 k e=1.241.315=0.943例题11计算低于临界航速区域航行的双体船运动阻力,该船要素如下:片体计算船长 L=78.0m片体计算船宽 b=4.5m排水量为846t时吃水T=2.32m方形系数 C b=0.531相对内侧间距 C=0.775片体内侧间距 C=7.0m两个片体的湿表面积 S=998.4m2片体相对船长 L b=17.3片体相对船宽 b T=1.94在计算时,利用了《L b》组图表(见图42)、参数b T的影响系数图表(见图48)和参数C b的影响系数图表(见图52)。
双体船的阻力性能预估
双体船的阻力性能预估注:该论文针对了NAVCAD4(及之前)的双体船的阻力性能预报。
该文章陈述了两种不同技术的计论问题。
问题双体船的阻力为单个片体的两倍,并且加上两个片体相互作用的拖力。
NAVCAD预测阻力(船体与相互作用)有两种方法:双体系统方案及修改后的单体船方案。
双体系统解决方案直接预测系统阻力。
该预测算法联合了船体及相互作用的阻力。
修改后的单体方案预测单片体阻力,就如同预测一个单体的阻力。
NAVCAD增加相互作用的拉力,以修正双体船模型测试,这个即通过对正预测特征来实现。
采用这种方案后,船体参数和间距可以清楚地预测出来。
双体系统方案NAVCAD采用【Gronnselett,1991】算法来解决这个问题,该算法应用一系列曲线用于剩余阻力。
全尺寸的评估修正和高速排水型号双体船测试,在算法里双体船是修长船型的半个片体。
该方法在将船体分开与合并时并无多大不同,相互作用拉力在生成平均值时平均计算,这个算法表现出惊人的精确性,尽管如此,我们列出了这些船型的特征。
首先,船体长且修长,属于高速范围(Fn0.6~1.6)。
阻力中最大成份是伴流阻力,这个部分可以直接计算。
第二,船体间距对低速时相互作用力影响最大,此时主要是兴波阻力(Fn0.3~0,7)。
在上述速度范围以外,片体间距对增加的相互间作用力影响不大。
修正单体解决方案以上系统解决方案足以应对低速范围及非典型的小水线面或高速排水型双体船,改良型单体船解决方案可以用于这些模拟,以提高总体预测精度,这种方法要求采用模型试验或全尺寸试验。
这种方法的关键问题是处理船体模型的一半,换句话讲,这些结果显示为每个船体。
总阻力此时为单个片体的两倍。
双体船模型剩余阻力系数对单体或双体船是相同的,该系数由湿表面积决定,阻力与湿表面积被分成两份,系数保持一到。
因此,Cr值可以直接输入模型试验的数值或未经过试验的数值。
这些Cr值包括船体拉力,同时也包括相互作用拖力。
第一步是选择双体船模型试验,具有相似的L/B,片体中心间距相应。
- 1、下载文档前请自行甄别文档内容的完整性,平台不提供额外的编辑、内容补充、找答案等附加服务。
- 2、"仅部分预览"的文档,不可在线预览部分如存在完整性等问题,可反馈申请退款(可完整预览的文档不适用该条件!)。
- 3、如文档侵犯您的权益,请联系客服反馈,我们会尽快为您处理(人工客服工作时间:9:00-18:30)。
双体船的阻力性能预估
注:该论文针对了NAVCAD4(及之前)的双体船的阻力性能预报。
该文章陈述了两种不同技术的计论问题。
问题
双体船的阻力为单个片体的两倍,并且加上两个片体相互作用的拖力。
NAVCAD预测阻力(船体与相互作用)有两种方法:双体系统方案及修改后的单体船方案。
双体系统解决方案直接预测系统阻力。
该预测算法联合了船体及相互作用的阻力。
修改后的单体方案预测单片体阻力,就如同预测一个单体的阻力。
NAVCAD增加相互作用的拉力,以修正双体船模型测试,这个即通过对正预测特征来实现。
采用这种方案后,船体参数和间距可以清楚地预测出来。
双体系统方案
NAVCAD采用【Gronnselett,1991】算法来解决这个问题,该算法应用一系列曲线用于剩余阻力。
全尺寸的评估修正和高速排水型号双体船测试,在算法里双体船是修长船型的半个片体。
该方法在将船体分开与合并时并无多大不同,相互作用拉力在生成平均值时平均计算,这个算法表现出惊人的精确性,尽管如此,我们列出了这些船型的特征。
首先,船体长且修长,属于高速范围(Fn0.6~1.6)。
阻力中最大成份是伴流阻力,这个部分可以直接计算。
第二,船体间距对低速时相互作用力影响最大,此时主要是兴波阻力(Fn0.3~0,7)。
在上述速度范围以外,片体间距对增加的相互间作用力影响不大。
修正单体解决方案
以上系统解决方案足以应对低速范围及非典型的小水线面或高速排水型双体船,改良型单体船解决方案可以用于这些模拟,以提高总体预测精度,这种方法要求采用模型试验或全尺寸试验。
这种方法的关键问题是处理船体模型的一半,换句话讲,这些结果显示为每个船体。
总阻力此时为单个片体的两倍。
双体船模型剩余阻力系数对单体或双体船是相同的,该系数由湿表面积决定,阻力与湿表面积被分成两份,系数保持一到。
因此,Cr值可以直接输入模型试验的数值或未经过试验的数值。
这些Cr值包括船体拉力,同时也包括相互作用拖力。
第一步是选择双体船模型试验,具有相似的L/B,片体中心间距相应。
线性分析评估该模型,产生一相应曲线以仿真双体船拉力(作为一单体船计算)。
该修正曲线然后应用于设计的预估(按单体船预估,L/B,Cp)单个片体的阻力预报,用相似距离来修正最终模型。
改良的单体程序
hy公司完成许多试验,它们是基于方艉,圆舭船体,成功地应用了阻力预估。
这种方法要求较宽的L/B范围和间距(S/L比),通过十五组试验包括纯单体(参考),双体船
L/B=7~11,S/L=0.2~0.5,其它的测试结果已被加到Navcad中,已经形成母型资料库。
系统性程序描述如下:
复查并选择双体船模型试验报告具有相似的L/B,与S/L比
输入数据,速度、Cr值。
如果低速形状因子可以确定,也应输入,船体参数,应该是单个片体船的参数,如湿表面积及排水量。
输入设计要素
计算阻力,选择适合范围的预报方法
选择修改预报,阻力参数Rbare,Rr,Rw应修正。
定义模型名字,并计算。
改良的单体推断
如果模型和设计要求在形状、参数很相近,推将会非常接近。
该推断(评估)生成阻力-排水量曲线及Fn,在适合的尺寸和速度有效缩放。
如果能计算真实的湿面积及伴流分数,此时总阻力的预估,就如同剩余阻力(兴波)一样可计。
【该文为初稿,为保证可靠性,会实时修改】
若有疑问请到新浪或网易博客上留言
郭远洋:2011/11/30。