英文文献翻译 - 中文
英文文献翻译
外文文献原稿和译文原稿Sodium Polyacrylate:Also known as super-absorbent or “SAP”(super absorbent polymer), Kimberly Clark used to call it SAM (super absorbent material). It is typically used in fine granular form (like table salt). It helps improve capacity for better retention in a disposable diaper, allowing the product to be thinner with improved performance and less usage of pine fluff pulp. The molecular structure of the polyacrylate has sodium carboxylate groups hanging off the main chain. When it comes in contact with water, the sodium detaches itself, leaving only carboxylions. Being negatively charged, these ions repel one another so that the polymer also has cross-links, which effectively leads to a three-dimensional structure. It has hige molecular weight of more than a million; thus, instead of getting dissolved, it solidifies into a gel. The Hydrogen in the water (H-O-H) is trapped by the acrylate due to the atomic bonds associated with the polarity forces between the atoms. Electrolytes in the liquid, such as salt minerals (urine contains 0.9% of minerals), reduce polarity, thereby affecting superabsorbent properties, especially with regard to the superabsorbent capacity for liquid retention. This is the main reason why diapers containing SAP should never be tested with plain water. Linear molecular configurations have less total capacity than non-linear molecules but, on the other hand, retention of liquid in a linear molecule is higher than in a non-linear molecule, due to improved polarity. For a list of SAP suppliers, please use this link: SAP, the superabsorbent can be designed to absorb higher amounts of liquids (with less retention) or very high retentions (but lower capacity). In addition, a surface cross linker can be added to the superabsorbent particle to help it move liquids while it is saturated. This helps avoid formation of "gel blocks", the phenomenon that describes the impossibility of moving liquids once a SAP particle gets saturated.History of Super Absorbent Polymer ChemistryUn til the 1980’s, water absorbing materials were cellulosic or fiber-based products. Choices were tissue paper, cotton, sponge, and fluff pulp. The water retention capacity of these types of materials is only 20 times their weight – at most.In the early 1960s, the United States Department of Agriculture (USDA) was conducting work on materials to improve water conservation in soils. They developed a resin based on the grafting of acrylonitrile polymer onto the backbone of starch molecules (i.e. starch-grafting). The hydrolyzed product of the hydrolysis of this starch-acrylonitrile co-polymer gave water absorption greater than 400 times its weight. Also, the gel did not release liquid water the way that fiber-based absorbents do.The polymer came to be known as “Super Slurper”.The USDA gave the technical know how several USA companies for further development of the basic technology. A wide range of grating combinations were attempted including work with acrylic acid, acrylamide and polyvinyl alcohol (PVA).Since Japanese companies were excluded by the USDA, they started independent research using starch, carboxy methyl cellulose (CMC), acrylic acid, polyvinyl alcohol (PVA) and isobutylene maleic anhydride (IMA).Early global participants in the development of super absorbent chemistry included Dow Chemical, Hercules, General Mills Chemical, DuPont, National Starch & Chemical, Enka (Akzo), Sanyo Chemical, Sumitomo Chemical, Kao, Nihon Starch and Japan Exlan.In the early 1970s, super absorbent polymer was used commercially for the first time –not for soil amendment applications as originally intended –but for disposable hygienic products. The first product markets were feminine sanitary napkins and adult incontinence products.In 1978, Park Davis (d.b.a. Professional Medical Products) used super absorbent polymers in sanitary napkins.Super absorbent polymer was first used in Europe in a baby diaper in 1982 when Schickendanz and Beghin-Say added the material to the absorbent core. Shortly thereafter, UniCharm introduced super absorbent baby diapers in Japan while Proctor & Gamble and Kimberly-Clark in the USA began to use the material.The development of super absorbent technology and performance has been largely led by demands in the disposable hygiene segment. Strides in absorption performance have allowed the development of the ultra-thin baby diaper which uses a fraction of the materials – particularly fluff pulp – which earlier disposable diapers consumed.Over the years, technology has progressed so that there is little if any starch-grafted super absorbent polymer used in disposable hygienic products. These super absorbents typically are cross-linked acrylic homo-polymers (usually Sodium neutralized).Super absorbents used in soil amendments applications tend to be cross-linked acrylic-acrylamide co-polymers (usually Potassium neutralized).Besides granular super absorbent polymers, ARCO Chemical developed a super absorbent fiber technology in the early 1990s. This technology was eventually sold to Camelot Absorbents. There are super absorbent fibers commercially available today. While significantly more expensive than the granular polymers, the super absorbent fibers offer technical advantages in certain niche markets including cable wrap, medical devices and food packaging.Sodium polyacrylate, also known as waterlock, is a polymer with the chemical formula [-CH2-CH(COONa)-]n widely used in consumer products. It has the ability to absorb as much as 200 to 300 times its mass in water. Acrylate polymers generally are considered to possess an anionic charge. While sodium neutralized polyacrylates are the most common form used in industry, there are also other salts available including potassium, lithium and ammonium.ApplicationsAcrylates and acrylic chemistry have a wide variety of industrial uses that include: ∙Sequestering agents in detergents. (By binding hard water elements such as calcium and magnesium, the surfactants in detergents work more efficiently.) ∙Thickening agents∙Coatings∙Fake snowSuper absorbent polymers. These cross-linked acrylic polymers are referred to as "Super Absorbents" and "Water Crystals", and are used in baby diapers. Copolymerversions are used in agriculture and other specialty absorbent applications. The origins of super absorbent polymer chemistry trace back to the early 1960s when the U.S. Department of Agriculture developed the first super absorbent polymer materials. This chemical is featured in the Maximum Absorbency Garment used by NASA.译文聚丙烯酸钠聚丙烯酸钠,又可以称为超级吸收剂或者又叫高吸水性树脂,凯博利克拉克教授曾经称它为SAM即:超级吸收性物质。
国际贸易对碳排放的影响外文文献翻译中英文

外文文献翻译(含:英文原文及中文译文)英文原文The effects of international trade on Chinese carbon emissionsB Wei ,X Fang ,Y WangAbstractInternational trade is an important impact factor to the carbon emissions of a country. As the rapid development of Chinese foreign trade since its entry into the WTO in 2002, the effects of international trade on carbon emissions of China are more and more significant. Using the recent available input-output tables of China and energy consumption data, this study estimated the effects of Chinese foreign trade on carbon emissions and the changes of the effects by analyzing the emissions embodied in trade between 2002 and 2007. The results showed a more and more significant exporting behavior of embodied carbon emissions in Chinese international trade. From 2002 to 2007, the proportion of net exported emissions and domestic exported emissions in domestic emissions increased from 18.32% to 29.79% and from 23.97% to 34.76%, respectively. In addition, about 22.10% and 32.29% of the total imported emissions were generated in processing trade in 2002 and 2007, respectively, which were imported and later exported emissions. Although, most of the sectors showed a growth trend in imported and exportedemissions, sectors of electrical machinery and communication electronic equipment, chemical industry, and textile were still the biggest emission exporters, the net exported emissions of which were also the largest. For China and other developing countries, technology improvement may be the most favorable and acceptable ways to reduce carbon emissions at present stage. In the future negotiations on emissions reduction, it would be more fair and reasonable to include the carbon emissions embodied in international trade when accounting the total emissions of an economy. Keywords: input-output analysis, carbon emissions, international trade, ChinaIntroductionGlobal warming has been considered an indisputable fact. The main reason is that the warming of the global climate system is due to the continuous increase in the concentration of greenhouse gases in the atmosphere, the result of human activities (IPCC, 2007). In order to avoid the possible negative impact on human society's global warming, a series of measures have been taken to reduce global greenhouse gas emissions to slow down global warming. However, around the CO2 emission reduction and the future allocation of carbon emission rights, the game plays a different interest group.With the development of globalization, the impact on the international trade of the environment is becoming more and moresignificant, including the potential impact of carbon emissions from geographical relocation. Many researchers estimate that it is reflected in international trade in certain countries as well as in the world economy (Wykoff and Rupp, carbon emissions in 1994; Schaefer and Lealdesa, 1996, Machado et al., 2001 Year; Munksgaard, Peder and Sen, 2001; Ahmed and Wykov, 2003; Sanchez-Chóliz and Duarte, 2004; Peters and Hess, 2006, 2008; Mäenpää et al, 2007; Keman et al., 2007). The general conclusion is that in a more open economy, the impact of large foreign trade on the carbon emissions of a country. In addition, all these studies have pointed out that import and export trade cannot ignore a relatively open economy; otherwise, energy and carbon emissions figures may be seriously distorted by this economy (Machado et al., 2001). In terms of total volume, the value of China’s trade surplus increased from US$30.43 billion in 2002 to US$261.83 billion in 2007 (National Bureau of Statistics, 2008). The rapid growth of China’s foreign trade will have a significant effect on China’s carbon emissions.As one of the countries with the highest carbon emissions, China is facing increasing pressure to reduce emissions. However, China is also a big country in international trade. The rapid development of China’s economy has led to steady growth in foreign trade. From 1997 to 2002, China’s total import and export value increased by an average annual growth rate of 14.35%. Since joining the World Trade Organization, theaverage annual growth rate of China’s trade has jumped to 28.64%. From 2002 to 2007, the value of exports compared with 2002, it increased by 2.7 times in 2007 to reach US$1.2177.8 billion. Imports also soared to US$955.95 billion in 2007, which was 2.2 times higher than the 2002 imports. In terms of total volume, the value of China’s trade surplus increased from US$30.43 billion in 2002 to US$261.83 billion in 2007 (National Bureau of Statistics, 2008). The rapid growth of China’s foreign trade will have a significant effect on China’s carbon emissions.However, quantitative assessment of the impact of China's international trade in energy use and carbon emissions has only recently begun. Estimates from the IEA (2007) show that China's domestic production and export of energy-related carbon dioxide emissions account for 34% of total emissions, and if it is used in 2004, the weighted average carbon intensity of commodity countries imported from China is estimated. China's net exports of EM-rich CO2 may be more than 17% of total emissions in 2004 (Levin, 2008). Using a single-area input-output model, Pan et al. (2008) estimated that their production of energy and emissions in 2002 accounted for 16% and 19% of China’s net exports of primary energy consumption, respectively, in 2002. In the input-output analysis, China reported that the discharge volume of pre-grid discharges to the United States accounted for about 5%. Weber et al. (2008), ESTI mating production exported from China's carbon dioxide emissions from1987 to 2005. In 2005, about one-third of China's emissions were due to production exports, and this proportion has risen from 12% in 1987 to 21% in 2002. In developed countries, consumption is driving this trend. Wei et al.'s estimation (2009a) also found that the presence of emissions in China's economy in 2002 reflected significant export behavior; in addition, subsequent exports (processing trade played by EMIS--) were total imports of 20 %the above. In addition, using a multi-area input-output model, Peters and Hewei (2008) also found that export emissions represented 24.4% of China's domestic emissions, and the proportion of imports in 2001 was only 6.6%. A similar study by Atkinson et al. (2009) also shows that China is a net exporter of carbon emissions in international trade. In recent years, using ecological input-output based on physical access programs, MOD-Y eling, Chen and Chen (2010) estimated that in 2007 China's export of carbon dioxide emissions and total energy were respectively 32.31% and 33.65% of total emissions.Both the United States and European countries are major importers of China’s export carbon emissions. Using the economic input-output life cycle assessment software, Ruihe Harris (2006) found that about 7% of China’s carbon dioxide emissions from exports to the United States during the period of 1997-2003 were produced by 14% of the total; the US’s CO2 emissions will At 3%-6%, if increased imports from Chinahave been produced in the United States. AP-walking a similar approach, Lee Hewitt found that bilateral trade between the United Kingdom and China (2008) produced about 4% of CO2 emissions. In 2004, China's CO2 emissions were for the UK market to produce goods and the UK trade decreased. About 11%. Weber et al. (2008) also found that most of China’s recent export emissions went to developed countries, approximately 27% of the United States, 19% of the EU-27, and 14% of the remaining Annex B countries, mainly Japan and Australia. And New Zealand. Recently, Xu et al. (2009) studied the impact of energy consumption and exhaust emissions on the environment. From 2002 to 2007, the use of environmental input-output analysis and adjustment of bilateral trade data reflected trade in the East (from China to the United States). Zhang (2009) has also obtained similar results. Energy and CO2 account for about 12% and 17% of China's energy consumption, and China's CO2 emissions are 8% and 12%, respectively.Although China's international trade is a meaningful research on carbon emissions, further related research is necessary because of the rapid development of China's foreign trade, especially the development of processing trade. According to statistics (National Bureau of Statistics, 2008), the export share of processing trade has been more than 50% of total exports since 1996. In 2002 and 2007, the share of processing trade reached 55.26% and 50.71%, which will be processing trade. Thenecessary distinction between the impact of general trade and China's carbon emissions.Since China's input-output table is only 5 years, we have chosen from 2002 (entry to the WTO) to 2007 (the latest issue), and China's international trade input-output table has impact on carbon emissions with the view of the last requirement of this paper. Influence changes. In addition, we distinguish between domestic processing trade and import investment in the assessment of production processes (import emissions and re-exports), which will help us to further understand the impact of international trade on emissions status. In this study, we tried to answer three questions: 1) What is the net emissions generated by foreign trade in China as a big country's foreign trade? 2) China from 2002 to 2007, International How does trade affect carbon emissions? 3) From 2002 to 2007, which departments were the major emitters of China's import and export trade and their roles?Uncertainty in the calculation of carbon emissionsThe calculation of emissions from China's trade reflects a certain degree of uncertainty. One is that the input-output analysis itself has many inherent uncertainties (more discussion in Lenzen, 2001). Based on an input-output table for China's single region, it allows us to obtain a relatively accurate assessment of the emissions that are reflected in China's exports, but this error may be more pronounced when estimatingthe emissions of goods and services exported to China. (Lenzen , 2001; Lenzen et al., 2004). Another important factor of uncertainty is that the calculations come from different regions, which may underestimate the method of importing the carbon intensity factor that is reflected in the import of larger proportion of finished product producing countries and tertiary industries, and the smaller proportion of secondary industries. In addition, the method of pro-grade introduction of the column will inevitably result in some errors in order to obtain a matrix from the inlet of the original import and export table.At present, for reasons of data availability, we cannot fully quantify the accuracy of our calculations, but preliminary estimates suggest that the use of more accurate data results from research will not significantly change the conclusions of this analysis. These restrictions will be improved through the use of multi-zone import and export tables and out-of-zone more detailed industry carbon intensity and sector-to-sector production processes in the future for detailed analysis.Understand the impact of international trade on carbon emissions in ChinaFrom 2002 to 2007, the impact of foreign trade on China’s carbon emissions has greatly expanded. It may be largely related to two factors. The first is the coal-based energy consumption structure. The secondary industry-based production structure will maintain high domestic energyintensity. In 2002, the coal consumption exchange was only 66.3% of the total energy consumption. The 44.8% of China's gross domestic product (GDP) is due to the secondary industry in 2002 (National Bureau of Statistics, 2008). In 2007, related stock prices rose as high as 69.5% and 48.6%, respectively, which will lead to the fact that the unit exports are higher than the carbon emissions reflected in unit imports. The second factor, which may be a more important factor, is the rapid growth of export trade. From 2002 to 2007, China’s exports increased by 246.80%, while imports increased by 199.97% (National Bureau of Statistics, 2008). Export growth is significantly higher than imports, which may lead to a sharp increase in net exports. Decomposition analysis using input and output structures, Liu et al. (2010) also found that the total export expansion of export and energy-intensive products tends to expand, reflecting the export of energy from 1992 to 2005, but the improvement and change of energy efficiency in the primary energy consumption structure can offset part of the impact on export energy. The above driving force is implemented.Although, based on the coal-based energy consumption structure, the carbon dioxide emissions produced by the secondary industry-based production structure, the more important role, it may be difficult for China to adjust because of its endowment characteristics, and in a very short time Its structural characteristics and its current economicdevelop ment stage. In addition, the expansion of China’s foreign trade, including the expansion of the trade surplus, is mainly the result of the market economy’s maximizing its comparative advantage. The development-replacement of China's economy not only provided many of the world's goods and services, but also reduced the nation's production-based relative costs in developed countries. China’s foreign trade has always played an important role in the development of the world economy, due to its huge market, stable government system and abundant cheap labor. Therefore, it can be argued that at the current stage, for China's better methods to reduce the impact of international trade on national or global CO2 emissions should be to improve its production technology, reduce the intensity of energy consumption as a whole, not only to control China The amount of foreign trade. In addition, the imported goods from China should take part in China's carbon emission responsibilities, because the CON-consumer demand of foreign consumers has generated a large amount of China's carbon emissions, especially for consumers in developed countries.ConclusionDespite some uncertainties in this study, most areas produced from the details of the data, we can conclude that international trade has a significant impact on China's carbon emissions, and changed the impact of time on going. Compared with 2002 emissions, domestic exportemissions in 2007 increased from 267.07 MTC to 718.31 MTC, with a speed increase of over 160%; net exports also increased correspondingly, from 204.08 MTC up to 615.65 MTC, over 200% growth rate Now. From 23.97% in 2002, the share of domestic emissions from domestic emissions jumped to 34.76% in 2007. The share of pre-net transplants that exceeded domestic emissions also rose from 18.32% in 2002 to 29.79% in 2007. The results show that more and more significant net export behaviors of implied carbon emissions exist in China's economy and processing trade have more and more significant effects on carbon emissions.Regardless of the emissions of imported emissions or exports, most industries showed a growth trend in 2007. Compared with 2002, emissions although the sectoral emissions have changed for the entire economy from 2002 to 2002, The impact, of which the largest percentage of imported major department or China's export emissions remain unchanged. The largest import emissions (all or actual imports) come from the industries of electrical machinery and communications electronics, chemicals, smelting and rolling plus metals. Electrical machinery and communications electronics equipment, chemicals, textiles and other sectors are the largest emitters of exports, net exports of which are also the largest. Technological progress may be the most favorable and acceptable way for China and other developing countries toreduce their carbon emissions. Considering that the world’s largest carbon emissions and the recent increase in emissions are in developing countries, the historical responsibility for the current responsibilities, developed countries should also take more efforts to help developing countries reduce their carbon emissions. Economic growth through technical assistance And financial support. In the car's list of future emissions reductions, which include the total economic output, the carbon emissions reflected in international trade will be fair and reasonable.中文译文国际贸易对中国碳排放的影响: 一份具有经验性的分析作者:B Wei ,X Fang ,Y Wang摘要国际贸易是一个国家碳排放量重要的影响因素,自2002年加入世贸组织,中国对外贸易的快速发展对碳排放的影响越来越显著。
英文文献用翻译

Adult【成年人】Aged【老年人】Aged, 80 and over【老年人, 80以上】Catheterization, Central Venous/*instrumentation/methods【*导管插入术, 中心静脉/*仪器/方法】Cost-Benefit Analysis【费用效益分析】Equipment Design【设备设计】Equipment Failure【设备失效】Equipment Safety【设备安全性】Female【女(雌)性】Humans【人类】Infusion Pumps, Implantable/adverse effects/*economics【*输注泵, 植入型/副作用/*经济学】Male【男(雄)性】Middle Aged【中年人】Neoplasms/*drug therapy/pathology【*肿瘤/*药物疗法/病理学】Probability【概率】Prospective Studies【前瞻性研究】Risk Assessment【危险性评估】Sensitivity and Specificity【敏感性与特异性】Treatment Outcome【治疗结果】Vascular Patency【血管未闭】Venous Thrombosis/prevention & control【静脉血栓形成】Adolescent【青少年】Adult【成年人】Aged【老年人】Aged, 80 andover【老年人, 80以上】AntineoplasticAgents/*administration& dosage【*抗肿瘤药】*Catheters,Indwelling/adverseeffects/economics【*导管, 留置/副作用/经济学】Female【女(雌)性】Humans【人类】*Infusion Pumps,Implantable/adverse。
英文文献及翻译

Recycling Economics: Higher Costs Are An Illusion Hidden CostsM.A.CokeMany people are surprised when they discover their community may pay more for a curbside recycling program than for regular trash pickup. They ask why - in some cases - they must pay more to give their recyclables to someone who will sell them? This leads many people to believe that recycling is not economical. One reason recycling appears to be uneconomical is that some people already pay a higher cost for trash disposal than they realize. Some local governments pay fees to hauling companies, transfer stations, or landfills out of local tax revenue. That lowers the direct cost to residents and businesses, making the regular trash pickup appear to be less expensive than it really is. But when recycling programs begin, residents usually directly pay the full cost of recycling. This can distort the cost comparisons between the recycling program and disposing of trash at landfills. Depletion Costs Recycling also is economical because costs associated with future disposal are avoided. One of these avoided costs is for landfill depletion. Landfills have limited space, and so can receive a limited amount of trash. When it is full, it must be replaced by another landfill that is generally more expensive to operate and maintain. This is due to higher costs of complying with environmental regulations, higher expenses in siting a new location, buying or allocating land, constructing the landfill, operational expenses, and long-term maintenance costs after the landfill is closed. Additionally, the new landfill may be further away than the old landfill, increasing transportation costs. Generally, a new landfill costs more than an older one. Paying the higher cost at a new landfill is avoided by keeping the older landfill open longer. Recycling and other waste-reducing methods keep the older landfill open longer. Because these avoided costs are not seen when people pay the bills, they do not usually think of the savings recycling produces. Environmental Costs Recycling is economical in several ways related to manufacturing processes. Recycling cuts down on waste produced by processing raw materials into usable forms. For example, recycling aluminum reduces mining wastes, processing wastes, and emissions produced by extracting the aluminum from the ore. Recycling usually requires less refining than raw materials. For example, it takes much less energy to melt down an aluminum can to make another aluminum can than to process the raw materials to make a can. This cuts down on chances for environmental damage and conserves our natural resources. With any product, the costs of cleaning up wastes and limitingemissions usually are passed on to consumers who purchase the product. But sometimes damage to the environment is not realized for years, is difficult to attribute to certain industries, or is caused by a combination of many industries. Acid rain is one example of this type of environmental damage. The costs of dealing with this pollution are hard to assess, but are paid for by everyone in efforts to improve the environment.Energy SavingsManufacturing products from recycled material also can save energy. The energy required to produce one aluminum can is equal to the energy embodied in the amount of gasoline it takes to fill the can half full.While recycling saves energy, that does not always mean that industries save money by using recycled materials. Labor costs for recycled products are often higher than those used in processing virgin material. Materials recovered from curbside collection, drop-off centers, and material recovery facilities must be separated, cleaned, and processed.Making a product from recycled material may require new or retrofitted equipment and other capital expenditures while virgin material supplies and equipment needed to produce most goods already exist.But since recycling saves energy, it also cuts down on pollution emitted by utilities and the companies themselves. When energy is used, the price of the resulting pollution is passed on to all energy consumers in their utility bills. Due to the new clean air law, utility companies must comply with tougher standards in reducing pollutants they release while producing energy. The cost of compliance is usually passed on to each energy consumer.If energy use is reduced by methods such as recycling, less pollution is produced. That reduces everyone's cost in terms of paying to reduce pollution and in limiting damage to natural resources.Once the long-term costs and advantages are weighed, recycling does make economic sense. Using resources wisely is always economical..循环经济学:较高的成本是一个错觉隐藏的费用M.A.Coke许多人都很惊讶当他们发现他们的社区可能多支付一个路边废物回收程序要比普通垃圾的猎物。
英文文献中文翻译
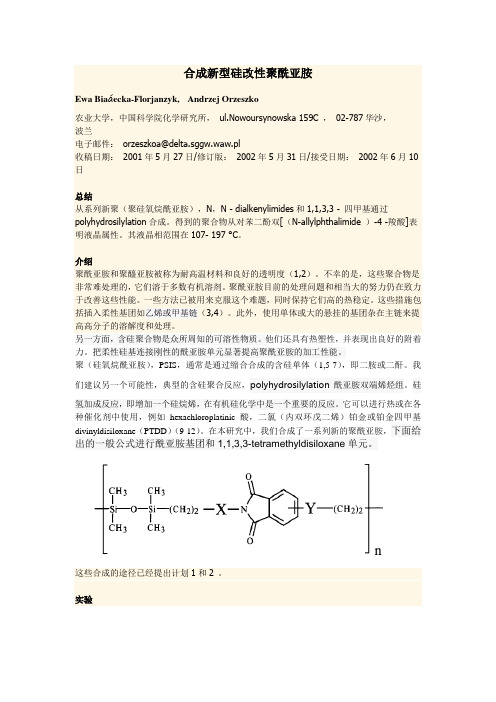
合成新型硅改性聚酰亚胺Ewa Biaáecka-Florjanzyk, Andrzej Orzeszko农业大学,中国科学院化学研究所,ul.Nowoursynowska 159C ,02-787华沙,波兰电子邮件:orzeszkoa@delta.sggw.waw.pl收稿日期:2001年5月27日/修订版:2002年5月31日/接受日期:2002年6月10日总结从系列新聚(聚硅氧烷酰亚胺),N,N - dialkenylimides和1,1,3,3 - 四甲基通过polyhydrosilylation合成。
得到的聚合物从对苯二酚双[(N-allylphthalimide )-4 -羧酸]表明液晶属性。
其液晶相范围在107- 197 °C。
介绍聚酰亚胺和聚醯亚胺被称为耐高温材料和良好的透明度(1,2)。
不幸的是,这些聚合物是非常难处理的,它们溶于多数有机溶剂。
聚酰亚胺目前的处理问题和相当大的努力仍在致力于改善这些性能。
一些方法已被用来克服这个难题,同时保持它们高的热稳定。
这些措施包括插入柔性基团如乙烯或甲基链(3,4)。
此外,使用单体或大的悬挂的基团杂在主链来提高高分子的溶解度和处理。
另一方面,含硅聚合物是众所周知的可溶性物质。
他们还具有热塑性,并表现出良好的附着力。
把柔性硅基连接刚性的酰亚胺单元显著提高聚酰亚胺的加工性能。
聚(硅氧烷酰亚胺),PSIS,通常是通过缩合合成的含硅单体(1,5-7),即二胺或二酐。
我们建议另一个可能性,典型的含硅聚合反应,polyhydrosilylation酰亚胺双端烯烃组。
硅氢加成反应,即增加一个硅烷烯,在有机硅化学中是一个重要的反应。
它可以进行热或在各种催化剂中使用,例如hexachloroplatinic酸,二氯(内双环戊二烯)铂金或铂金四甲基divinyldisiloxane(PTDD)(9-12)。
在本研究中,我们合成了一系列新的聚酰亚胺,下面给出的一般公式进行酰亚胺基团和1,1,3,3-tetramethyldisiloxane单元。
英文文献及翻译
Geotextile reinforced by soft soil1. IntroductionGeotextile known, it has high tensile strength, durability, corrosion resistance, texture, flexibility, combined with good sand, to form reinforced composite foundation, effectively increase the shear strength , tensile properties, and enhance the integrity and continuity of soil. Strengthening mechanism for the early 60's in the 20th century, Henri Vidal on the use of triaxial tests found a small amount of fiber in the sand, the soil shear strength can improve the image of more than 4 times in recent years, China's rock Laboratory workers also proved in the reinforced sand can effectively improve the soil's bearing capacity, reduce the vertical ground settlement, effectively overcome the poor soil and continuity of overall poor performance. As with the above properties of reinforced soil and the characteristics of its low price, so the project has broad application prospects.2.1 Project OverviewThe proposed retaining wall using rubble retaining wall of gravity, the wall is 6 meters high, the bearing capacity of foundation soil required to 250kPa, while the basement geology from the top down as follows: ①clay to a thickness of 0.7 to 2 meters saturated, soft plastic; ② muddy soil, about 22 - 24 meters thick, saturated, mainly plastic flow, local soft plastic; ③ sand layer to a thickness of 5 to 10 meters, containing silty soil and organic matter, saturated, slightly wet; ④ gravel layer, the thickness of the uneven distribution points, about 0 to 2.2 meters, slightly dense; ⑤ weathered sandstone. Including clay and silty soil bearing capacity is 70kPa, obviously do foundation reinforcement.2.2 Enhanced Treatment of reinforced foundation cushion Reinforcement replacement method can be used for sand and gravel used forsoil treatment, but due to loose bedding, based on past experience, witha gravel mat to treat a large settlement of the foundation always exist, even the characteristics of poor, often resulting in cracks in the superstructure, differential settlement of the image, this works for6-meter-high rubble retaining walls, height and large, and because the walls are 3 meters high wall, if there is differential settlement of retaining walls, cracks, will result in more serious consequences and thus should be used on the cushion reinforcement through economic and technical analysis, decide on the sand and gravel stratum were reinforced hardening. Reinforcement treatment method: first the design elevation and the basement excavation to 200mm thick layer of gravel bedding, and then capped with a layer of geotextile, and then in the thick sand and gravel on the 200, after leveling with the yellow sand using roller compaction; second with loaded bags of sand and gravel laying of geotextile, the gap filled with slag, geotextile bags capped 100 thick gravel, roller compaction. Its on repeat laying geotextile → → compacted gravel, until the design thickness of the cushion, the bridge is 1 m thick cushion, a total of 4 layers of geotextile, two bags of sand.This method works fast, simple machine, investment, after years of use, that reinforce good effect, building and construction units are satisfied.3 ExperienceTo achieve the reinforced soil reinforcement effect, must be reinforced earth construction technology, construction strict quality control: 1, geotextile should increase the initial pre-stress, and its end should be a reliable anchor to play the tensile strength of geotextile, anchoring more firmly, more capacity to improve, the foundation of the stress distribution more uniform, geotextile side Ministry of fixed length by laying end to ensure the fold, the folded end wrapped sand to increase its bond strength to ensure that the use will not be pulled out duringthe period.Second, the construction process have a significant effect on the reinforcement effect, the construction should be as soon as possible so that geotextile in tension, tensile strength geotextile can be played only when the deformation, so do not allow construction of geotextile crease occurs, the earth Fabric tension leveling as much as possible. Geotextile in order to have enough by the early Dutch strain, according to the following procedure works: ① laying geotextile; ② leveled the tension at both ends; both ends of the folded package gravel and sand filling at both ends; ③ center fill sand; ④ 2 higher end of sand; ⑤ Finally, the center of sand filling. Click here to enable the construction method of forming corrugated geotextile being stretched as soon as possible, to play a role in the early loaded.Third, the construction of geotextile-reinforced cushion should the level of shop using geotextile geotextile and laying of gravel bags cushion the turn to play bag cushion integrated turn out good, flexural rigidity, and dispersion of good and peace bedding layer of the overall continuity of good advantages.4 ConclusionGeotextile reinforced by soft soil is an effective, economical, safe, reliable, simple method, but the literature describes only qualitative, experience more components, yet the lack of rigorous The theoretical formula, reliable test data to be adequate, these are yet to be theoretical workers and the general engineering and technical personnel continue to explore.土工织物加筋垫层加固软土地基1. 引言土工织物又称土工聚合物,它具有高抗拉强度,耐久性、耐腐蚀性,质地柔韧,能与砂土很好地结合,组合成加筋土复合地基,有效地提高土的抗剪强度、抗拉性能,增强土体的整体性和连续性。
英文文献中文翻译

工作过程中,一些几乎镰刀形的工作空间被封闭在螺旋位移体和气缸的两个圆周壁间的 气体容积空间中。如此,气体从入气口进入,通过缸容积的不断缩小,伴随着工作介质 压力的增加,进而从出气口排出。 在这个已知的机械中,有两个偏心装置被隔开一定距离放置,其中一个能被驱动轴 所驱动。这使得在静态轴承的正常运转过程中能保证在转子位置的上下死点处有积极的 引导。 为了使旋转体得到确切的引导, 在旋转体的死点位置一根导轴也被安装在外壳内, 另外有两个通过传动装置 (一般由齿状传送带构成) 力封闭安装在驱动轴上的平衡装置。 驱动旋转体的主轴中心安装并对称布置了两个平衡块,以使偏心轴承得到保护。这 种平衡块的角位置通常由键来保证。该连接,键的位置在加工问题上是次要的问题。因 为首要条件——装置的平衡运转,要求键有精确的角位置。
则与轴表面在径向的最低点平齐。半径 rW 的选择(在任何情况下应大于轴径)现在则提供 了一种决定面积δA 的方法。 这样有类似椭圆形孔的平衡块 20 能够装入支承座 40。这些平衡件,如烧结零件或低厚 度的冲压件等一个接一个排布安装在轴上构成平衡块。 在这种情况下, 最接近偏心装置的那 些零件就能够装在一个简单的滑块支座上, 并且只有正对于偏心装置, 零件才能被压到轴上。 所有作例说明的原件在图 3 所示的位移机械中都有展示 (解释这个压缩机的工作, 由于 不是本发明的主要课题,请参见 DE-C3-2 603 462) 。接下来的内容,为了解这个发明,只 有机器的结构和工艺步骤是值得简要描述的。 该机械的转动部分由 1 来总体指示。 在碟形件 2 的两侧, 在每个缸中有两个螺旋延伸位 移体相互 180°反向布置。这是垂直安装布于碟形件 2 上的位移体 3,3′。而这些螺旋体, 通常则是由众多相互毗邻的圆弧线构成。 碟形件 2 通过 4 所指示的毂安装在滚动轴承 22 上。 轴承自身则安装在作为驱动轴 24 一部分的偏心盘 3 上。在位移体 3 及 3′外放射状布置着 用于调节安装偏心轴承 26 的位于导向轴承 25 的一个孔 5。 这个导向轴承一方面也是导轴 27 的一部分。 机器的外壳由 7 和 7′两部分组成,它们通过孔 8 的螺栓连接在一起。相互呈 180°布 置的传递空间 11 及 11′以螺旋槽的形式在两部分壳体中被加工出来。传递空间从布置在壳 体内螺旋槽外圆周出的入气口延伸到壳体内侧的出气口。 它们有几乎平行的相互之间距离相 等的缸壁,且形状接近于 360°螺旋线或像碟形位移体 2 一样。在缸壁之间装有与之贴合的 位移体 3 及 3′。
外文参考文献(带中文翻译)
外文资料原文涂敏之会计学 8051208076Title:Future of SME finance(c)Background – the environment for SME finance has changedFuture economic recovery will depend on the possibility of Crafts, Trades and SMEs to exploit their potential for growth and employment creation.SMEs make a major contribution to growth and employment in the EU and are at the heart of the Lisbon Strategy, whose main objective is to turn Europe into the most competitive and dynamic knowledge-based economy in the world. However, the ability of SMEs to grow depends highly on their potential to invest in restructuring, innovation and qualification. All of these investments need capital and therefore access to finance.Against this background the consistently repeated complaint of SMEs about their problems regarding access to finance is a highly relevant constraint that endangers the economic recovery of Europe.Changes in the finance sector influence the behavior of credit institutes towards Crafts, Trades and SMEs. Recent and ongoing developments in the banking sector add to the concerns of SMEs and will further endanger their access to finance. The main changes in the banking sector which influence SME finance are:•Globalization and internationalization have increased the competition and the profit orientation in the sector;•worsening of the economic situations in some institutes (burst of the ITC bubble, insolvencies) strengthen the focus on profitability further;•Mergers and restructuring created larger structures and many local branches, which had direct and personalized contacts with small enterprises, were closed;•up-coming implementation of new capital adequacy rules (Basel II) will also change SME business of the credit sector and will increase its administrative costs;•Stricter interpretation of State-Aide Rules by the European Commission eliminates the support of banks by public guarantees; many of the effected banks are very active in SME finance.All these changes result in a higher sensitivity for risks and profits in the financesector.The changes in the finance sector affect the accessibility of SMEs to finance.Higher risk awareness in the credit sector, a stronger focus on profitability and the ongoing restructuring in the finance sector change the framework for SME finance and influence the accessibility of SMEs to finance. The most important changes are: •In order to make the higher risk awareness operational, the credit sector introduces new rating systems and instruments for credit scoring;•Risk assessment of SMEs by banks will force the enterprises to present more and better quality information on their businesses;•Banks will try to pass through their additional costs for implementing and running the new capital regulations (Basel II) to their business clients;•due to the increase of competition on interest rates, the bank sector demands more and higher fees for its services (administration of accounts, payments systems, etc.), which are not only additional costs for SMEs but also limit their liquidity;•Small enterprises will lose their personal relationship with decision-makers in local branches –the credit application process will become more formal and anonymous and will probably lose longer;•the credit sector will lose more and more i ts “public function” to provide access to finance for a wide range of economic actors, which it has in a number of countries, in order to support and facilitate economic growth; the profitability of lending becomes the main focus of private credit institutions.All of these developments will make access to finance for SMEs even more difficult and / or will increase the cost of external finance. Business start-ups and SMEs, which want to enter new markets, may especially suffer from shortages regarding finance. A European Code of Conduct between Banks and SMEs would have allowed at least more transparency in the relations between Banks and SMEs and UEAPME regrets that the bank sector was not able to agree on such a commitment.Towards an encompassing policy approach to improve the access of Crafts, Trades and SMEs to financeAll analyses show that credits and loans will stay the main source of finance for the SME sector in Europe. Access to finance was always a main concern for SMEs, but the recent developments in the finance sector worsen the situation even more.Shortage of finance is already a relevant factor, which hinders economic recovery in Europe. Many SMEs are not able to finance their needs for investment.Therefore, UEAPME expects the new European Commission and the new European Parliament to strengthen their efforts to improve the framework conditions for SME finance. Europe’s Crafts, Trades and SMEs ask for an encompassing policy approach, which includes not only the conditions for SMEs’ access to l ending, but will also strengthen their capacity for internal finance and their access to external risk capital.From UEAPME’s point of view such an encompassing approach should be based on three guiding principles:•Risk-sharing between private investors, financial institutes, SMEs and public sector;•Increase of transparency of SMEs towards their external investors and lenders;•improving the regulatory environment for SME finance.Based on these principles and against the background of the changing environment for SME finance, UEAPME proposes policy measures in the following areas:1. New Capital Requirement Directive: SME friendly implementation of Basel IIDue to intensive lobbying activities, UEAPME, together with other Business Associations in Europe, has achieved some improvements in favour of SMEs regarding the new Basel Agreement on regulatory capital (Basel II). The final agreement from the Basel Committee contains a much more realistic approach toward the real risk situation of SME lending for the finance market and will allow the necessary room for adaptations, which respect the different regional traditions and institutional structures.However, the new regulatory system will influence the relations between Banks and SMEs and it will depend very much on the way it will be implemented into European law, whether Basel II becomes burdensome for SMEs and if it will reduce access to finance for them.The new Capital Accord form the Basel Committee gives the financial market authorities and herewith the European Institutions, a lot of flexibility. In about 70 areas they have room to adapt the Accord to their specific needs when implementing itinto EU law. Some of them will have important effects on the costs and the accessibility of finance for SMEs.UEAPME expects therefore from the new European Commission and the new European Parliament:•The implementation of the new Capital Requirement Directive will be costly for the Finance Sector (up to 30 Billion Euro till 2006) and its clients will have to pay for it. Therefore, the implementation – especially for smaller banks, which are often very active in SME finance –has to be carried out with as little administrative burdensome as possible (reporting obligations, statistics, etc.).•The European Regulators must recognize traditional instruments for collaterals (guarantees, etc.) as far as possible.•The European Commission and later the Member States should take over the recommendations from the European Parliament with regard to granularity, access to retail portfolio, maturity, partial use, adaptation of thresholds, etc., which will ease the burden on SME finance.2. SMEs need transparent rating proceduresDue to higher risk awareness of the finance sector and the needs of Basel II, many SMEs will be confronted for the first time with internal rating procedures or credit scoring systems by their banks. The bank will require more and better quality information from their clients and will assess them in a new way. Both up-coming developments are already causing increasing uncertainty amongst SMEs.In order to reduce this uncertainty and to allow SMEs to understand the principles of the new risk assessment, UEAPME demands transparent rating procedures –rating procedures may not become a “Black Box” for SMEs: •The bank should communicate the relevant criteria affecting the rating of SMEs.•The bank should inform SMEs about its assessment in order to allow SMEs to improve.The negotiations on a European Code of Conduct between Banks and SMEs , which would have included a self-commitment for transparent rating procedures by Banks, failed. Therefore, UEAPME expects from the new European Commission and the new European Parliament support for:•binding rules in the framework of the new Capital Adequacy Directive,which ensure the transparency of rating procedures and credit scoring systems for SMEs;•Elaboration of national Codes of Conduct in order to improve the relations between Banks and SMEs and to support the adaptation of SMEs to the new financial environment.3. SMEs need an extension of credit guarantee systems with a special focus on Micro-LendingBusiness start-ups, the transfer of businesses and innovative fast growth SMEs also depended in the past very often on public support to get access to finance. Increasing risk awareness by banks and the stricter interpretation of State Aid Rules will further increase the need for public support.Already now, there are credit guarantee schemes in many countries on the limit of their capacity and too many investment projects cannot be realized by SMEs.Experiences show that Public money, spent for supporting credit guarantees systems, is a very efficient instrument and has a much higher multiplying effect than other instruments. One Euro form the European Investment Funds can stimulate 30 Euro investments in SMEs (for venture capital funds the relation is only 1:2).Therefore, UEAPME expects the new European Commission and the new European Parliament to support:•The extension of funds for national credit guarantees schemes in the framework of the new Multi-Annual Programmed for Enterprises;•The development of new instruments for securitizations of SME portfolios;•The recognition of existing and well functioning credit guarantees schemes as collateral;•More flexibility within the European Instruments, because of national differences in the situation of SME finance;•The development of credit guarantees schemes in the new Member States;•The development of an SBIC-like scheme in the Member States to close the equity gap (0.2 – 2.5 Mio Euro, according to the expert meeting on PACE on April 27 in Luxemburg).•the development of a financial support scheme to encourage the internalizations of SMEs (currently there is no scheme available at EU level: termination of JOP, fading out of JEV).4. SMEs need company and income taxation systems, whichstrengthen their capacity for self-financingMany EU Member States have company and income taxation systems with negative incentives to build-up capital within the company by re-investing their profits. This is especially true for companies, which have to pay income taxes. Already in the past tax-regimes was one of the reasons for the higher dependence of Europe’s SMEs on bank lending. In future, the result of rating w ill also depend on the amount of capital in the company; the high dependence on lending will influence the access to lending. This is a vicious cycle, which has to be broken.Even though company and income taxation falls under the competence of Member States, UEAPME asks the new European Commission and the new European Parliament to publicly support tax-reforms, which will strengthen the capacity of Crafts, Trades and SME for self-financing. Thereby, a special focus on non-corporate companies is needed.5. Risk Capital – equity financingExternal equity financing does not have a real tradition in the SME sector. On the one hand, small enterprises and family business in general have traditionally not been very open towards external equity financing and are not used to informing transparently about their business.On the other hand, many investors of venture capital and similar forms of equity finance are very reluctant regarding investing their funds in smaller companies, which is more costly than investing bigger amounts in larger companies. Furthermore it is much more difficult to set out of such investments in smaller companies.Even though equity financing will never become the main source of financing for SMEs, it is an important instrument for highly innovative start-ups and fast growing companies and it has therefore to be further developed. UEAPME sees three pillars for such an approach where policy support is needed:Availability of venture capital•The Member States should review their taxation systems in order to create incentives to invest private money in all forms of venture capital.•Guarantee instruments for equity financing should be further developed.Improve the conditions for investing venture capital into SMEs•The development of secondary markets for venture capital investments in SMEs should be supported.•Accounting Standards for SMEs should be revised in order to easetransparent exchange of information between investor and owner-manager.Owner-managers must become more aware about the need for transparency towards investors•SME owners will have to realise that in future access to external finance (venture capital or lending) will depend much more on a transparent and open exchange of information about the situation and the perspectives of their companies.•In order to fulfil the new needs for transparency, SMEs will have to use new information instruments (business plans, financial reporting, etc.) and new management instruments (risk-management, financial management, etc.).外文资料翻译涂敏之会计学 8051208076题目:未来的中小企业融资背景:中小企业融资已经改变未来的经济复苏将取决于能否工艺品,贸易和中小企业利用其潜在的增长和创造就业。
- 1、下载文档前请自行甄别文档内容的完整性,平台不提供额外的编辑、内容补充、找答案等附加服务。
- 2、"仅部分预览"的文档,不可在线预览部分如存在完整性等问题,可反馈申请退款(可完整预览的文档不适用该条件!)。
- 3、如文档侵犯您的权益,请联系客服反馈,我们会尽快为您处理(人工客服工作时间:9:00-18:30)。
倒置AAO工艺的生产性试验研究陈宏斌1,唐先春1,董斌1,高廷耀1,Martin Wagner21 中国上海同济大学污染控制和资源化研究实验室2 IWAR Institute, Technical University of Darmstadt, 64287 Germany摘要倒置缺氧/厌氧/好氧工艺(倒置AAO工艺)是上世纪90年代中期开发出来的用于脱氮除磷的污水处理工艺。
本文主要阐述了松江污水处理厂(中国)二期工程倒置AAO工艺处理城市污水的运行效果、运行参数以及影响因素。
近两年的运行结果表明:对CODCr 、BOD5、SS、NH3-N和TN具有较好的处理效率,对TN 和NH3-N的处理效率分别达到了0.022 kg TN·kgMLSS-1·d-1和 0.026 kg NH3-N·kgMLSS-1·d-1。
然而,对PO4-P和TP的去除率却并不高。
因此,我们提出了一个除磷效率更高的改进措施。
运行结果表明:倒置AAO工艺不仅适用于新建的污水处理厂的脱氮除磷,同样也适用于现有的脱氮除磷效率不高的污水处理厂改造和扩建。
关键词:硝化反硝化除磷倒置AAO工艺城市污水引言氮和磷是城市污水中导致受纳水体富营养化的主要因素。
生物硝化、反硝化和除磷工艺是经济的可行的控制排放水水质的方法。
生物脱氮除磷技术主要有:AAO工艺系列,氧化沟工艺和序批式活性污泥工艺(SBR法)。
不同菌种脱氮除磷的新陈代谢过程是需要在缺氧,厌氧和好氧条件下进行的。
在AAO工艺和氧化沟工艺中,可通过搅拌、曝气和污泥回流等方法实现上述条件。
SBR工艺是一个以时间顺序实现缺氧,厌氧,好氧的AAO工艺。
在中国,AAO工艺广泛应用于许多污水处理设施。
传统的AAO工艺有很多优点,同时也有两个缺点:1)需要两个回流系统,其总回流比不少于300%;2)从二沉池抽走的剩余污泥有部分没有完全经过厌氧,缺氧和好氧阶段,这可能会减少总磷(TP)的去除率。
Qasim和Udomsinrot把内回流和外回流系统并为一个外回流系统进行试验性研究,将回流污泥被直接抽入曝气池的入口处,这一措施使处理工艺取得了较高的TN和TP的去除率。
对只有外回流系统的倒置AAO工艺去除城市污水中氮和磷效果的深入研究表明倒置AAO工艺对总磷的去除率有所提高,对总氮的去除率与传统AAO工艺差不多。
另有研究表明:良好的除磷效率不仅包括释放磷的程度的功能和聚磷菌对PHB的吸收量,还包括水力停留时间和在厌氧阶段氧化还原电位。
倒置AAO工艺是上世纪90年代末提出的以实现城市污水的生物同步脱氮除磷技术。
其主要特点:污水依次经过缺氧、厌氧和好氧阶段以去除生物营养物;只有一个回流系统和在生物反应池中具有相对较高的混合液悬浮固体浓度。
对倒置AAO 工艺处理不同城市污水的初期和中期试验表明,当关闭传递硝酸盐的内回流系统和增加外回流系统污泥回流比至100 - 200%时,好氧池具有稳定高效的脱氮除磷效率。
这一积极有效的措施降低了污水处理的能耗。
倒置AAO工艺适用于那些现存的没有脱氮除磷功能的污水处理厂的改造。
生产性试验研究表明倒置AAO 工艺也适用于新建的污水处理厂。
松江污水处理厂二期工程是上世纪90年代末设计和建设的,采用的是早期的倒置AAO工艺,本文根据近两年的运行数据对其污水处理效果进行了评估。
材料与方法松江污水处理厂坐落于上海西南部,包括分别建设于上世纪80年代中期的一期工程和90年代末期的二期工程。
一期工程以去除污水BOD5和SS为目标,处理能力为18,000m3·d-1。
为实现脱氮除磷功能,二期工程采用倒置AAO工艺,处理能力为50,000 m3·d-1。
嗜温厌氧消化有助于污泥稳定。
二期工程的流程图在本文中已给出。
松江污水处理厂的进水包括80%的生活污水和20%的工业废水:前者主要来自于松江新城区的污水管道系统,还有少量来自于老城区的黑水;后者则来自于附近的企业。
与常规污水管道系统中的污水相比,其平均CODCr , BOD5, TKN 和TN浓度都比较高。
由于高浓度的污水进入污水处理工艺,进水中的污泥负荷也将增大。
二期工程主要的设计和运行参数如下:初级沉淀池该工程采用两座直径35米高4米的圆形沉淀池沉淀分离大颗粒悬浮固体。
其设计比表面积容积负荷为1.5 m3·m-2·h-1,水力停留时间为2小时。
曝气池工程采用两座矩形曝气池用于生物法去除有机物、脱氮除磷,每一座曝气池有效容积尺寸为:52×39×6 m3,设计水力停留时间为12小时。
每座曝气池组成一个系列,都分为三个廊道,其中第一个廊道又分为4格(见图1)。
前三格池子内安装了搅拌器,第四格安装了鼓风曝气系统(盘片式)。
设计水力停留时间缺氧区和厌氧区与好氧区的比例为1:3。
曝气池设计悬浮固体浓度为4.0g·L-1,进水有机负荷为0.10 kg BOD5·kg MLSS-1·d-1。
外回流系统将二沉池中富含硝酸盐的污泥回流至曝气池入口处,最大回流比为200%。
二次澄清剂二沉池采用的是4座圆形辐流沉淀池来进行泥水分离。
每座沉淀池直径35米深4米,设计表面负荷0.76 m3·m-2·h-1,水力停留时间4小时。
二期工程于2001年初投入运营。
一般情况下,污水厂日流量在38,000-52,000 m3·d-1,年平均流量在43,000-45,000 m3·d-1。
由于进水CODCr , BOD5,SS, TN 和TP浓度大于设计值,实际平均BOD5进水负荷为0.114 kgBOD5·kgMLSS-1·d-1。
在运行期间,采用短时间初次沉淀有助于将更多的营养物带入曝气池,这有利于脱氮除磷。
尽管有许多固体被带入曝气池,池内的悬浮固体浓度可保持在4.5 gL-1以上。
实际曝气率(气水比)在7.5:1到8:1之间。
在曝气池出口处溶解氧浓度(DO)大约为3.0 mg/L。
污泥的循环利用率为100%至150%,正常情况下平均为120%,污泥停留时间为12至15天。
结果除了一个半月的设备修理外,该项目连续23个月的每周平均运行数据被进行了不间断的记录。
下图2-7绘出了主要污染物、CODCr 、BOD5、N 和 P的详细变化情况。
COD Cr 、BOD 5和SS 的去除进水COD Cr 在435至1680间变化,夏季周平均值最高1443mg ·L -1,冬季周平均值最低450mg ·L -1。
平均进水COD Cr 浓度为918.6 ± 306.7 mg ·L -1 ,COD 负荷率两季节都和设计值一样,为0.34 kg ·Kg MLSS -1·h -1。
为控制运营期间出水水质达标,可曝气池的悬浮固体浓度增加至4.5gL -1。
根据图2,可以发现 , 出水COD Cr 低于60 mg ·L - 1;其平均值为56.2 ± 9.7 mg ·L - 1。
进水的BOD 5浓度在162.6 to 591.9 mg ·L -1间,平均浓度为07.5 ± 97.4 mg ·L -1。
处理后,出水的BOD 5浓度低于15·0 mg/L ,其平均浓度为0.2 ± 4.3 mg ·L -1。
总的COD Cr 和BOD 5的平均去除率分别为93.9和96.7%。
尽管生化池内悬浮固体浓度远大于活性污泥浓度,在最近三年的运行中还是很难见到污泥膨胀现象。
通常活性污泥的污泥容积指数(SVI )介于74.3 和124.2 ml ·g -1之间,而MLVSS/MLSS 值比较稳定,保持在60-70%之间。
进水SS 浓度介于257.1和1,499.4 mg ·L -1之间,平均浓度为626.1 ± 264.9 mg ·L -1。
尽管经过短时间的初级沉淀,可去除约50%的SS ;还有许多SS 流进了曝气池,因此相对较高的MLSS 的情况下有较好的沉降效果不难理解的。
最终出水SS 浓度低于15 mg/L ,其平均值为11.9 ± 3.6 mg ·L -1。
脱氮除磷进水NH 3-N 和TN 浓度分别为23.6-47.7 mg ·L -1 and 44.9-138.2 mg ·L -1,平均值分别为31.3 ± 4.7 mg ·L -1和78.2 ± 18.8 mg ·L -1。
进水中约有70%的TN 是有机氮。
从图4中可以看出:出水NH 3-N 和TN 的浓度通常分别低于10mg ·L -1和21 mg ·L -1,其平均浓度分别为:3.14 ± 2.6mg ·L -1 and 18.9 ± 3.1 mg ·L -1。
当回流比为100%至150%时,平均有90.0%的NH 3-N 和75.8%的TN 被去除。
根据图5可看出出水的TKN 平均浓度也很低,为8.2 ± 3.8 mg ·L -1。
可以看出TKN 的去除效率基本不受季节和进水峰值率的影响。
而季节变化对NH 3-N 和TN 则略有影响。
夏天的出水TN 浓度正常低于18 mg/L ,冬天和早春出水TN 浓度则在18 mg ·L -1到25 mg·L-1变化;而NH3-N的春水浓度则基本不受温度的影响。
这可能是由于缺氧池水力停留时间短,而好氧池水力停留时间相对长得多的缘故。
进水的TN 的容积负荷率为0.08 - 0.24 kg·m-3·d-1,平均值0.14 kg TN·m-3·d-1,这要比周围其他污水处理厂高。
年平均去除负荷率为0.11 kg TN·m-3·d-1,相当于0.022 kg TN·kgMLSS-1·d-1。
考虑到有机氮会降解成氨氮,实际平均生物硝化率为0.026kg NH3-N·kg MLSS-1·d-1,最高可达0.033 kg NH3-N·kg MLSS-1·d-1。
有意思的是实测的TN去除率比理论值高出了15-20%,这意味着在曝气池内同时进行着硝化和反硝化反应。
图6显示:进水中NO3-N浓度低于2.0 mg·L-1。
出水NO3-N浓度在6.0与14 mg·L-1之间,平均值为10.8 ± 2.5 mg·L-1。