NEAR OPTIMAL CLUSTER-HEAD SELECTION FOR WIRELESS SENSOR NETWORKS
基于遗传算法的聚类分析
遗传算法[1, 2]是一种借鉴生物界自然选择和进化机制发展起来的具有自适应性和自组织能力的搜索算法,被广泛应用于求解复杂的优化问题。
遗传算法首先随机生成优化问题的一组可能解,并对每个可能解进行编码,这组可能解的集合被称为种群,种群中的每个可能解被称为个体。
每个个体都有一个与之相应的适应度值,用来衡量该个体代表的问题的解的“好坏”。
模仿生物界“适者生存”原理,根据适应度的大小,从初始种群中选择若干个较好的个体参与交叉和变异操作。
交叉操作通过交换重组两个个体的编码的一部分生成新的个体,类似于子代继承父代的基因。
变异操作通过随机改变某个个体的编码位来生成新的个体,从而增加了种群的多样性。
选择、交叉和变异操作迭代执行若干次或一直执行到满足特定的终止规则,最后得到的种群中适应度最高的个体即为优化问题的近似最优解。
遗传算法近年来在模式识别、机器学习、图像处理、智能控制等方面获得了成功的 应用[4]。
聚类分析是模式识别中的一个重要问题,是非监督学习的重要方法。
聚类分析的目的是将若干特征模式按照它们之间的“相似度”划分为若干个集合,每个集合中的特征模式之间按照某种度量来说“相似”,而不同集合中的特征模式之间按相同的度量来说“不相似”。
目前已有很多种聚类算法,如均值算法、最大似然估计算法和基于图论的方K- 法[3]。
均值算法是一种简单常用的方法,该方法首先选定K-某种距离度量作为模式间相似性度量,然后确定某个评价聚类划分结果质量的准则函数,在给出初始聚类中心点后,用迭代法找出使准则函数取极值的最好聚类划分结果。
该方法的缺点是可能受初始选定的聚类中心的影响而过早地收敛于次优 解[5]。
最大似然估计法首先假设代分类数据符合某种先验概率分布,然后根据计算出的后验概率进行数据的分类。
基于图论的方法首先估计每个点的密度梯度值,生成方向树,然后通过查找密度函数的谷点来实现数据的分类。
最近有学者提出了基于遗传算法的聚类方法[6],这种方法采用了均值算法的基本思想,所不同的是它使用遗传算法而不K-是一般的迭代来进行聚类划分的优化。
聚类与自适应波段选择结合的高光谱图像降维

聚类与自适应波段选择结合的高光谱图像降维张悦;官云兰【摘要】针对自适应波段选择法(adaptive band selection,ABS)对高光谱图像降维后得到的最优波段子集用于地物目标分类处理时,分类精度不理想的问题,提出一种K-means聚类与ABS结合的高光谱图像降维方法.算法采用K-means聚类算法对所有波段进行聚类,聚类中分别采用相关系数和欧氏距离2种相似性度量,选取各聚类中ABS指数最大的波段,作为最优波段子集.通过实验,将所提方法与ABS进行分类精度比较.实验结果表明,所提方法在分类精度上优于ABS法,以相关系数作为相似性度量的K-means聚类与ABS结合的降维方法分类效果更好.%Aiming at the problem that the classification accuracy is not ideal based on selected optimal band subset by adaptive band selection(ABS) for hyperspectral image,an improved method of hyperspectral image reduction based on K-means clustering and ABS was proposed.The algorithm uses K-means clustering algorithm to cluster all the bands.Two similarity measures of correlation coefficient and Euclidean distance are respectively used in the clustering,and the band with the largest ABS index in each cluster is selected as a subset of the optimal band.Experiment was done for classification of hyperspectral image by using ABS and the method proposed in the paper.The experimental results show that the method proposed is superior to the ABS method in classification accuracy,and classification accuracy taking the correlation coefficient as a similarity measure for K-means clustering and ABS combined is better.【期刊名称】《遥感信息》【年(卷),期】2018(033)002【总页数】5页(P66-70)【关键词】高光谱图像;波段选择;自适应波段选择法;K-means聚类;图像分类【作者】张悦;官云兰【作者单位】东华理工大学测绘工程学院,南昌330013;流域生态与地理环境监测国家测绘地理信息局重点实验室,南昌330013;东华理工大学测绘工程学院,南昌330013;流域生态与地理环境监测国家测绘地理信息局重点实验室,南昌330013【正文语种】中文【中图分类】P2370 引言高光谱遥感(hyperspectral remote sensing,HRS)是指用多且窄的电磁波波段获得目标物体相关信息的遥感技术,其光谱分辨率可达到纳米数量级[1]。
iXPRESS4+ 牧牛乳产业 Herringbone 牛棚说明书

2 · iXPRESS4+ HERRINGBONE MILKING PARLOURBringing the best together to help farmers drive dairy efficiency When it comes to dairying, New Zealand is known for its passionateinnovators - creating and implementing new products, equipment and methods, and finding new ways to be productive and sustainable.GEA adds a global engineering advantage to the ingenuity of New Zealand’s dairy industry. We make it easy for you to get the support you need to run state-of-the-art dairy businesses, produce healthy, high-quality milk and drive efficiencies.GEA New Zealand’s comprehensive range consists of milking, stalling, dairy automation and herd management tools - all designed to make farming easier. We provide custom-built modular solutions. Each project is customised to suit your farm requirements and budget - not just for now, but into the future. Every product is manufactured inNew Zealand and designed especially for pastoral farming. GEA New Zealand products offer:•High-end automation and high throughput at milking •Savings on labour•Low running and maintenance costs•Modular upgrade options• A cost-effective option with high-tech functionality •Compatibility with all types and makes of milking systems.All GEA New Zealand systems are easy to install and upgradeable for tailored solutions, plus some components fit all types of milking systems.From low-cost pastoral based production methods inNew Zealand, Australia and the UK, to intensive farmingmethods in Europe and the US, the GEA iXPRESS4+ offersa cost-effective and high throughput solution for today’sprogressive dairy farmers.Manufactured as a kitset, the GEA iXPRESS4+ is not onlyshipped to site ready for easy ‘bolt-together’ installation;upgrades are easily applied with no engineering required.The pre-fabricated design means the iXPRESS4+ is quicklyand easily bolted into position. Easy to maintain, it hasproven ideal for any sized operation, from small 8-clusterparlours through to large scale intensive farming methodsand is used all over the world. The iXPRESS4+ has anautomation upgrade pathway, to increase efficiency.• Up to 50 clusters available, with the ability to milk up to400 cows per hour• Basic plant automation, right through to full herdmanagement• Designed for herd sizes - 100-700 cows•The modular system provides flexibility for herd size andsimple automation•Pre-fabricated for quick and simple bolt-together installation•Integrated controls ensure a one-switch operation startsthe entire plant•Easy to maintain and supported by a network of accreditedGEA Service Partners•Designed and manufactured in New Zealand; meetsISO standards for milking system design, constructionand performance.GEA’s iXPRESS4+Herringbone parlourThe modular Herringbone parlour is custom-builtto suit your farm and your business goals.HIGH THROUGHPUTLOWER INPUTAUTOMATIC WALK-OVER TEAT SPRAYERINTEGRATED PLANT CONTROLLOW MAINTENANCEOPTIMUM COW COMFORTINTEGRATED HERD MANAGEMENTiXPRESS4+ Easy FlowThis mid-level, or Easy Flow parlour gives you a milking system that’s not only future proof, it offers optimum cow comfort and reduces worker load.• Perfect positioning thanks to precision stalling• Classic 300 E clusters specifically designed to accommodate narrower teat configurations• AutoPULS S - single pulsator per stall• iASSIST swing down jetter system for improved operator comfort, cleaning and a clear working space• iNTELARM+ for perfect cluster alignmentiXPRESS4+ MaxThis top-level, or Max parlour option gives you a low-maintenance platform with fully integrated herd management, milking point automation and ICAR approved milk sampling for total milking efficiency.• Perfect positioning thanks to precision stalling• Classic 300 E clusters specifically designed to accommodate narrower teat configurations• A utoPULS S - single pulsator per stall• i ASSIST swing down jetter system for improved operator comfort, cleaning and a clear working space• iNTELARM+ for perfect cluster alignmentconfiguration to suit your iXPRESS4+ GrassrootsThis entry-level, or Grassroots option gives you a future-proof parlour with the ability to upgrade in the future. With correct stall spacing and perfect cluster alignment, your cows enjoy long-term comfort in the dairy.• Perfect positioning thanks to precision stalling• Classic 300 E clusters specifically designed to accommodate narrower teat configurations• AutoPULS S - single pulsator per stall• iASSIST swing down jetter system for improved operator comfort, cleaning and a clear working space• iNTELARM+ for perfect cluster alignment MAX3EASYFLOW2GRASSROOTS1MAX3EASYFLOW2GRASSROOTS1• Pre-fabricated, the equipment is quickly and easilybolted into position• Simple operation standardises the milking process • Single point operation reduces time and labour • A-symmetrical cluster alignment for easy, quick and efficient milking• New generation pulsator per milking unit - for afaster, more gentle milking-out process and improved udder health• High throughput system, with adjustable milking techniques to ensure ultimate operator efficiencies• Low cost of ownership and easy maintenance • Customisable to fit your budget and farming strategy.IDEALFOR LOW-COSTPASTORAL MILKINGSYSTEMSS i z e o f i X P R E S S 4+ s y s t e mP R O DU CT I O NG A I NS C OW HE A L T H L A B O URE FF I C I E N C I E S S P AR E T I M E W e c a n He l p .Comfortable cows, better flowMaking sure cows are comfortable while entering, milking out and exiting the dairy is crucial. Not only to cow flow, for milking efficiency too.Exit gatesWith Patented ‘Gear Driven’ twin gate action, cows exit freely with minimal intrusion into the pit and roof space.Herringbone entryClear, wide entry and a clear platform promotes optimum cow movement.Key features• • • • • • Considered one of the best on the market when it comes to milking efficiency,GEA Classic 300 E clusters are installed with every iXPRESS4+.Designed to cater to the modern, high-yielding dairy cow, whose rear quarter teats are closer together, the modular Classic 300 E cluster features a closer positioning of Classic 300 EThe right clusters to suit your herdMAX3EASYFLOW2GRASSROOTS1AVAILABLE WITH:A single pulsator handles one cluster assembly, delivering a perfectly controlled pulse to the cluster and an accurate milking and rest phase.Key features• Easy maintenance pulsators• Individual pulsation per cluster assembly • Front and rear milking ratios possible • Variable and accurate pulsation rates for optimum milking performance • Pulsator airline filter included.GEA AutoPULS SFor long life and optimum milking performanceKey features• Ideal for smaller operators - can easily be pulled down for quick cup attachment before cleaning • Lowers to a convenient operator height for cluster washing • Clear the milking space by easily pushing the jetters and line up out of the operators’ way • Jetter line permanently attached using a flexible hose connection from the feeder-pipe and wash-tub.iASSIST swing down jetter systemAnother smart feature that comes with iXPRESS4+ Easy Flow and Max (or as an optional extra with the Grassroots model) is iASSIST swing down jetter system. Convenient and easy to use, iASSIST improves operator comfort and clears the MAXEASYFLOW2Key features• Heavy-duty, powerful ram fitted to each cluster • High visibility indicators located at the top of ram show milking mode or indicating a problem during milking • Simple user interface with single push-button control • Let-down timer allows the cow to let her milk down before sensor takes over control of the milking (50-300 seconds)• The final interval timer allows cows to be milked out completely (5-30 seconds)• Adjustable end of milkingsensitivity controls take-off set point for milking cows wetter or dryer • Abnormal milking alerts - a red strobe light in the head of the cylinder warns the operator of a cluster being kicked off • Cluster vent time ensures the cluster is slowly vented before retraction from the cow (1-5 seconds)• Alert standby lowers cluster on ram cord to warn the operator of a problem during milking• Manual mode overrides the sensor and timers • Timed take-off removes cluster once set time has been reached (4-20 minutes)• Sleep mode preserves the life of the iCR (30-120 minutes).A-SYMMETRICALCLUSTERALIGNMENTFOR OPTIMUMTEAT COMFORTthese features to the Grassroots iXPRESS4+, or to any other brand of milking parlour, too.Key features• No standard droppers • Clears the working space for the operator • Increases cupping efficiencies • Supports calm and comfortable cow behaviour • Reduces worker discomfort and fatigue Experience an ergonomic working space for the operator and a clean and even The iNTELARM+ swing-over arm is attached to each cluster, providing the perfect MAX3EASYFLOW2iNTELARM+ for perfect Herringbones with swing-over clusters, the new iCR+ with EasyStart lift or pull vacuum activation will help save both time and labour, optional add-on, so post-milk teat spraying can also automate, MAXEASYFLOW2A red warning strobe lamp in the head of the ram along with a green milking status LED and blue washing status LED advise operator of milking status.Key featuresIndividual pulsator control Measures milk yield flow for ideal cluster removal Optimal milking every time with a vacuum that is gentle on Optional KickOff switchSimply raise the cluster to start the milking process with EasyStart.Key featuresControls and monitors themilking process - from pulsation to automatic cluster removal Determines optimal cluster removal point Timely removal protects udder healthMilk yields measured in free flow using LactoFlow milk sensor Gather data on daily milk yields EASYFLOW2EASYFLOW2Key featuresCompatible with all GEA milking parlours, plus can control tasks from other manufacturer’s systems Calculates milk flow rate and exact milk yields using Metatron MB Precision milk sampling function approved by ICAR Visual indicators such as ‘no MAX3DemaTron 70 (Max feature)DemaTron 70 provides a relationship between performance and costs. The versatile milk parlour control unit reveals its talent in daily herd management and, together with the MetatronCowScout™ monitors cows 24 hours a day, providing highly accurate data for heat detection, eating and rumination times.With CowScout™ gain the insight you need to ensure every cow is CowScout™’s health monitoring is great for tracking each individual animal’s health and well-being, while also giving group information.Constant monitoring of cows keeps you informed of any potential health problems at an early stage, allowing for quick and early intervention. This can minimise treatment costs, milk loss and changes in body condition - keeping Transition cows are also fully monitored in the time before and after calving, with CowScout™ keeping a constant and close eye on them. Calving difficulties, metabolic issues and uterine infections can also be identified Key featuresFree up labour without the need for manual teat spraying Each animal receives a consistent, metered dose of teat spray Easy to programme and installUnique walk over pad features an array of cow restrictors to regulate cow flow OPTIONALADD-ON“You can’t argue with data; it’s been key to better efficiency and more days in milk.”Brad PayneWAIKATO, NEW ZEALANDdetection and health Key features• Improve in calf rates through accurate and timely heat detection • Detect metabolic disorders early in newly calved cows • Increase 80 day submission rates in year-round calving herds, and 3 week submission rates in seasonal OPTIONALADD-ONDATAPROCESSED ON FARMDairyPlan herd management software Designed to be a fully-functioning herd management softwareWith a customised menu specifically designed for pasture-basedoperations, it’s easy to navigate for a new user and complete enough forthe seasoned user. The menu incorporates all the reports and graphsAnimal alerts: treated cows, high conductivity cows and cows with aNO MONTHL YSUBSCRIPTION FEESOPTIONAL ADD-ONOffering you various systems for automatically Key features• Minimised cow flow interruption - ID antenna positioned before cows reach the draft system ensures that only cows that need to be drafted are stopped• Guaranteed accuracy - photo eyes are incorporated intothis system to watch animal movements, ensuring very highDual opening gates showing drafting to the left. Dual opening gates showing straight-through drafting.OPTIONAL ADD-ONGEA New Zealand 12-14 Quail Place,Hamilton 3204, New ZealandTel +64 7 843 1780 Fax +64 7 843 1779We live our values.Excellence • Passion • Integrity • Responsibility • GEA-versity© G E A C o m p a n y . A l l r i g h t s r e s e r v e d . S u b j e c t t o m o d i fi c a t i o n s . P r i n t e d i n N e w Z e a l a n d . i X P R E S S 4+022021E N8891-9001-012GEA Group is a global engineering company with multi-billion euro sales and operations in more than 50 countries. Founded in 1881, the company is one of the largest providers of innovative equipment and process technology. GEA Group is listed in the STOXX® Europe 600 Index.。
优化初始聚类中心选择的K-means算法

优化初始聚类中心选择的K-means算法作者:杨一帆贺国先李永定来源:《电脑知识与技术》2021年第05期摘要:K-means算法的聚类效果与初始聚类中心的选择以及数据中的孤立点有很大关联,具有很强的不确定性。
针对这个缺点,提出了一种优化初始聚类中心选择的K-means算法。
该算法考虑数据集的分布情况,将样本点分为孤立点、低密度点和核心点,之后剔除孤立点与低密度点,在核心点中选取初始聚类中心,孤立点不参与聚类过程中各类样本均值的计算。
按照距离最近原则将孤立点分配到相应类中完成整个算法。
实验结果表明,改进的K-means算法能提高聚类的准确率,减少迭代次数,得到更好的聚类结果。
关键词:聚类;K-means;最近邻点密度;初始聚类中心;孤立点Abstract:The clustering effect of K-means algorithm is closely related to the selection of initial clustering center and the isolated points in the data, so it has strong uncertainty.In order to solve this problem, a novel K-means algorithm based on nearest neighbor density is proposed. In this algorithm, considering the distribution of the data set, the sample points are divided into isolated points, low density points and core points, and then the isolated points and low density points are eliminated, and the initial clustering center is selected in the core points. Isolated points do not participate in the calculation of the mean value of all kinds of samples in the process of clustering. The outlier is assigned to the corresponding class according to the nearest principle to complete the whole algorithm. The experimental results show that the improved K-means algorithm can improve the clustering accuracy, reduce the number of iterations, and get better clustering results.Key words: clustering; k-means; nearest neighbor density; initial clustering center; isolated points聚类就是按一定的标准把物理或抽象对象的集合分成若干类别的过程,聚类后得到的每一个簇中的对象要尽可能的相似,不同簇中的对象尽量的相异[1-2]。
基于改进的RRT^()-connect算法机械臂路径规划
随着时代的飞速发展,高度自主化的机器人在人类社会中的地位与作用越来越大。
而机械臂作为机器人的一个最主要操作部件,其运动规划问题,例如准确抓取物体,在运动中躲避障碍物等,是现在研究的热点,对其运动规划的不断深入研究是非常必要的。
机械臂的运动规划主要在高维空间中进行。
RRT (Rapidly-exploring Random Tree)算法[1]基于随机采样的规划方式,无需对构型空间的障碍物进行精确描述,同时不需要预处理,因此在高维空间被广为使用。
近些年人们对于RRT算法的研究很多,2000年Kuffner等提出RRT-connect算法[2],通过在起点与终点同时生成两棵随机树,加快了算法的收敛速度,但存在搜索路径步长较长的情况。
2002年Bruce等提出了ERRT(Extend RRT)算法[3]。
2006年Ferguson等提出DRRT (Dynamic RRT)算法[4]。
2011年Karaman和Frazzoli提出改进的RRT*算法[5],在继承传统RRT算法概率完备性的基础上,同时具备了渐进最优性,保证路径较优,但是会增加搜索时间。
2012年Islam等提出快速收敛的RRT*-smart算法[6],利用智能采样和路径优化来迫近最优解,但是路径采样点较少,使得路径棱角较大,不利于实际运用。
2013年Jordan等通过将RRT*算法进行双向搜索,提出B-RRT*算法[7],加快了搜索速度。
同年Salzman等提出在下界树LBT-RRT中连续插值的渐进优化算法[8]。
2015年Qureshi等提出在B-RRT*算法中插入智能函数提高搜索速度的IB-RRT*算法[9]。
同年Klemm等结合RRT*的渐进最优和RRT-connect的双向搜基于改进的RRT*-connect算法机械臂路径规划刘建宇,范平清上海工程技术大学机械与汽车工程学院,上海201620摘要:基于双向渐进最优的RRT*-connect算法,对高维的机械臂运动规划进行分析,从而使规划过程中的搜索路径更短,效率更高。
基于机会信号的区块模型的能效最优簇数的研究

基于机会信号的区块模型的能效最优簇数的研究刘东;熊召新【摘要】依据无线传感网络(WSNs)中WiFi、声或可见光的机会信号,提出基于最优簇数的区块模型(CML).区块模型为衰落模型,反映机会信号随传播距离的衰减变化.为了减少总体能耗,利用区块模型的泰勒级数展开的不同阶次计算最优簇数.最后利用移动手机、无线接入点、声和光信号建立真实的实验平台,分析最优簇数.实验数据表明,相比Exponential模型和对数Log模型,CML的能耗分别下降约6%和8%.此外,相比于WiFi和声信号,可见光信号的能效提高近12%.【期刊名称】《现代电子技术》【年(卷),期】2018(041)019【总页数】5页(P19-22,26)【关键词】无线传感网络;能效;簇;机会信号;区块模型;最优簇数【作者】刘东;熊召新【作者单位】陕西理工大学物理与电信工程学院,陕西汉中 723001;陕西理工大学物理与电信工程学院,陕西汉中 723001【正文语种】中文【中图分类】TN914-340 引言能效是许多通信系统的基本要求,如无线传感网络(Wireless Sensor Networks,WSNs)、物联网(Internet of Things,IoT)[1]。
为了解决高层问题,如定位、跟踪、路由和连通问题,将兴趣区域划分不同的区。
基于簇的拓扑结构是典型的分区技术。
分簇技术充分利用了传感节点的有限通信半径。
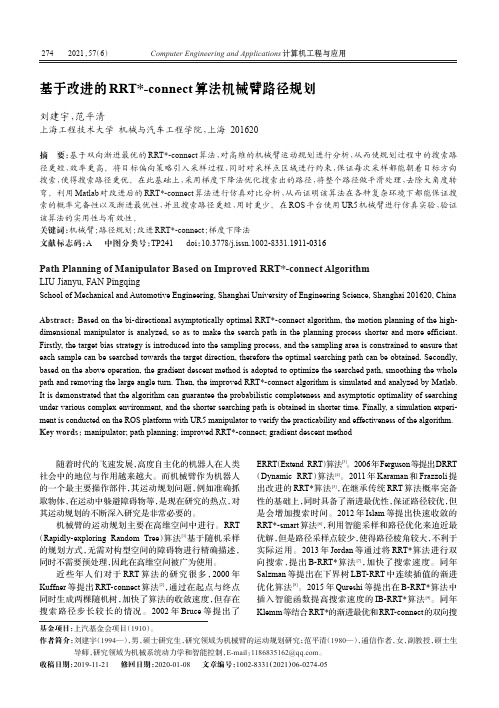
每个簇内产生一个簇头,并由簇头先融合数据,再向信宿传输这些融合数据[2],数据传输示意图如图1所示。
图1 数据传输示意图Fig.1 Schematic diagram of data transmission低功耗自适应簇协议LEACH[3],LEACH协议用Type⁃2逻辑算法选择簇头,簇头在节点间轮流转换,进而平衡网络能耗。
尽管簇技术能够降低网络能耗、提高数据传输效率,但是在固定网络下,分多少个簇,即最优簇数仍是一个挑战问题[4⁃5]。
ClussCluster包用户说明说明书
Package‘ClussCluster’October12,2022Type PackageTitle Simultaneous Detection of Clusters and Cluster-Specific Genes inHigh-Throughput Transcriptome DataVersion0.1.0Description Implements a new method'ClussCluster'descried in Ge Jiang and Jun Li,``Simultane-ous Detection of Clusters and Cluster-Specific Genes in High-throughput Transcrip-tome Data''(Unpublished).Simultaneously perform clustering analysis and signature gene selection on high-dimensional transcriptome data sets.To do so,'ClussCluster'incorporates a Lasso-type regularization penalty term to the objective function of K-means so that cell-type-specific signature genes can be identified while clustering the cells.Depends R(>=2.10.0)Suggests knitr,rmarkdown(>=1.13)VignetteBuilder knitrImports stats(>=3.5.0),utils(>=3.5.0),VennDiagram,scales(>=1.0.0),reshape2(>=1.4.3),ggplot2(>=3.1.0),rlang(>=0.3.4)License GPL-3Encoding UTF-8LazyData trueRoxygenNote6.1.1NeedsCompilation noAuthor Li Jun[cre],Jiang Ge[aut],Wang Chuanqi[ctb]Maintainer Li Jun<*************>Repository CRANDate/Publication2019-07-0216:30:16UTC12ClussCluster R topics documented:ClussCluster (2)filter_gene (3)Hou_sim (4)plot_ClussCluster (5)plot_ClussCluster_Gap (6)print_ClussCluster (7)print_ClussCluster_Gap (7)sim_dat (8)Index9 ClussCluster Performs simultaneous detection of cell types and cell-type-specificsignature genesDescriptionClussCluster takes the single-cell transcriptome data and returns an object containing cell types and type-specific signature gene setsSelects the tuning parameter in a permutation approach.The tuning parameter controls the L1 bound on w,the feature weights.UsageClussCluster(x,nclust=NULL,centers=NULL,ws=NULL,nepoch.max=10,theta=NULL,seed=1,nstart=20,iter.max=50,verbose=FALSE)ClussCluster_Gap(x,nclust=NULL,B=20,centers=NULL,ws=NULL,nepoch.max=10,theta=NULL,seed=1,nstart=20,iter.max=50,verbose=FALSE)Argumentsx An nxp data matrix.There are n cells and p genes.nclust Number of clusters desired if the cluster centers are not provided.If both are provided,nclust must equal the number of cluster centers.centers A set of initial(distinct)cluster centres if the number of clusters(nclust)is null.If both are provided,the number of cluster centres must equal nclust.ws One or multiple candidate tuning parameters to be evaluated and compared.De-termines the sparsity of the selected genes.Should be greater than1.nepoch.max The maximum number of epochs.In one epoch,each cell will be evaluated to determine if its label needs to be updated.filter_gene3 theta Optional argument.If provided,theta are used as the initial cluster labels of the ClussCluster algorithm;if not,K-means is performed to produce starting clusterlabels.seed This seed is used wherever K-means is used.nstart Argument passed to kmeans.It is the number of random sets used in kmeans.iter.max Argument passed to kmeans.The maximum number of iterations allowed.verbose Print the updates inside every epoch?If TRUE,the updates of cluster label and the value of objective function will be printed out.B Number of permutation samples.DetailsTakes the normalized and log transformed number of reads mapped to genes(e.g.,log(RPKM+1) or log(TPM+1)where RPKM stands for Reads Per Kilobase of transcript per Million mapped reads and TPM stands for transcripts per million)but NOT centered.Valuea list containing the optimal tuning parameter,s,group labels of clustering,theta,and type-specificweights of genes,w.a list containig a vector of candidate tuning parameters,ws,the corresponding values of objectivefunction,O,a matrix of values of objective function for each permuted data and tuning param-eter,O_b,gap statistics and their one standard deviations,Gap and sd.Gap,the result given by ClussCluster,run,the tuning parameters with the largest Gap statistic and within one standard deviation of the largest Gap statistic,bestw and onesd.bestwExamplesdata(Hou_sim)hou.dat<-Hou_sim$xrun.ft<-filter_gene(hou.dat)hou.test<-ClussCluster(run.ft$dat.ft,nclust=3,ws=4,verbose=FALSE)filter_gene Gene FilterDescriptionFilters out genes that are not suitable for differential expression analysis.Usagefilter_gene(dfname,minmean=2,n0prop=0.2,minsd=1)4Hou_simArgumentsdfname name of the expression data frameminmean minimum mean expression for each genen0prop minimum proportion of zero expression(count)for each geneminsd minimum standard deviation of expression for each geneDetailsTakes an expression data frame that has been properly normalized but NOT centered.It returns a list with the slot dat.ft being the data set that satisfies the pre-set thresholds on minumum mean, standard deviation(sd),and proportion of zeros(n0prop)for each gene.If the data has already been centered,one can still apply thefilters of mean and sd but not n0prop. Valuea list containing the data set with genes satisfying the thresholds,dat.ft,the name of dat.ft,andthe indices of those kept genes,index.Examplesdat<-matrix(rnbinom(300*60,mu=2,size=1),300,60)dat_filtered<-filter_gene(dat,minmean=2,n0prop=0.2,minsd=1)Hou_sim A truncated subset of the scRNA-seq expression data set from Hou et.al(2016)DescriptionThis data contains expression levels(normalized and log-transformed)for33cells and100genes. Usagedata(Hou_sim)FormatAn object containing the following variables:x An expression data frame of33HCC cells on100genes.y Numerical group indicator of all cells.gnames Gene names of all genes.snames Cell names of all cells.groups Cell group names.note A simple note of the data set.DetailsThis data contains raw expression levels(log-transformed but not centered)for33HCC cells and 100genes.The33cells belongs to three different subpopulations and exhibited different biological characteristics.For descriptions of how we generated this data,please refer to the paper.Sourcehttps:///geo/query/acc.cgi?acc=GSE65364ReferencesHou,Yu,et al."Single-cell triple omics sequencing reveals genetic,epigenetic,and transcriptomic heterogeneity in hepatocellular carcinomas."Cell research26.3(2016):304-319.Examplesdata(Hou_sim)data<-Hou_sim$xplot_ClussCluster Plots the results of ClussClusterDescriptionPlots the number of signature genes against the tuning parameters if multiple tuning parameters are evaluated in the object.If only one is included,then plot_ClussCluster returns a venn diagram and a heatmap at this particular tuning parameter.Usageplot_ClussCluster(object,m=10,snames=NULL,gnames=NULL,...)top.m.hm(object,m,snames=NULL,gnames=NULL,...)Argumentsobject An object that is obtained by applying the ClussCluster function to the data set.m The number of top signature genes selected to produce the heatmap.snames The names of the cells.gnames The names of the genes...Addtional parameters,sent to the methodDetailsTakes the normalized and log transformed number of reads mapped to genes(e.g.,log(RPKM+1) or log(TPM+1)where RPKM stands for Reads Per Kilobase of transcript per Million mapped reads and TPM stands for transcripts per million)but NOT centered.If multiple tuning parameters are evaluated in the object,the number of signature genes is computed for each cluster and is plotted against the tuning parameters.Each color and line type corresponds to a cell type.If only one tuning parameter is evaluated,two plots will be produced.One is the venn diagram of the cell-type-specific genes,the other is the heatmap of the data with the cells and top m signature genes.See more details in the paper.Valuea ggplot2object of the heatmap with top signature genes selected by ClussClusterExamplesdata(Hou_sim)<-ClussCluster(Hou_sim$x,nclust=3,ws=c(2.4,5,8.8))plot_ClussCluster(,m=5,snames=Hou$snames,gnames=Hou$gnames)plot_ClussCluster_Gap Plots the results of ClussCluster_GapDescriptionPlots the gap statistics and number of genes selected as the tuning parameter varies.Usageplot_ClussCluster_Gap(object)Argumentsobject object obtained from ClussCluster_Gap()print_ClussCluster7 print_ClussCluster Prints out the results of ClussClusterDescriptionPrints out the results of ClussClusterUsageprint_ClussCluster(object)Argumentsobject An object that is obtained by applying the ClussCluster function to the data set.print_ClussCluster_GapPrints out the results of ClussCluster_Gap Prints the gap statisticsand number of genes selected for each candidate tuning parameter.DescriptionPrints out the results of ClussCluster_Gap Prints the gap statistics and number of genes selected for each candidate tuning parameter.Usageprint_ClussCluster_Gap(object)Argumentsobject An object that is obtained by applying the ClussCluster_Gap function to the data set.8sim_dat sim_dat A simulated expression data set.DescriptionAn example data set containing expressing levels for60cells and200genes.The60cells belong to4cell types with15cells each.Each cell type is uniquely associated with30signature genes,i.e.,thefirst cell type is associated with thefirst30genes,the second cell type is associated withthe next30genes,so on and so forth.The remaining80genes show indistinct expression patterns among the four cell types and are considered as noise genes.Usagedata(sim_dat)FormatA data frame with60cells on200genes.ValueA simulated dataset used to demonstrate the application of ClussCluster.Examplesdata(sim_dat)head(sim_dat)Index∗datasetsHou_sim,4sim_dat,8ClussCluster,2ClussCluster_Gap(ClussCluster),2filter_gene,3Hou_sim,4plot_ClussCluster,5plot_ClussCluster_Gap,6print_ClussCluster,7print_ClussCluster_Gap,7sim_dat,8top.m.hm(plot_ClussCluster),59。
HETEROGENEOUS COMPUTING
HETEROGENEOUS COMPUTINGShoukat Ali, Tracy D. Braun, Howard Jay Siegel, and Anthony A. MaciejewskiSchool of Electrical and Computer Engineering, Purdue UniversityHeterogeneous computing is a set of techniques enabling the use of diverse computational capabilities for the execution of a meta-task [2, 4, 7]. A meta-task is an arbitrary collection of independent (non-communicating) tasks with a variety of computational needs, which are to be executed during a given interval of time (e.g., a day). Some tasks may be decomposable into one or more communicating subtasks (subtasks may, in turn, have diverse computational needs). There are many types of heterogeneous computing systems [2]. This article focuses on mixed-machine systems, where a heterogeneous suite of independent machines is interconnected by high-speed links to function as a meta-computer (see Meta-Computer) or as part of a computational grid(see Computational Grid) [3]. The user of a heterogeneous suite has the illusion of working on a single virtual machine.Research in the field of heterogeneous computing is motivated by the fact that high performance machines vary in capability and, hence, suitability for different types of tasks and subtasks. Examples of such machine architectures include large distributed shared memory machines (e.g., an SGI 2800), distributed memory multiprocessors (e.g., an IBM SP2), and small shared memory machines (e.g., a Sun Enterprise 3000 Server). Furthermore, two implementations of a given machine type may vary in CPU speed, cache memory size and structure, I/O bandwidth, etc. With the recent advances in high-speed digital communications, it has become possible to use collections of different machines in concert to execute large meta-tasks whose tasks and subtasks have diverse computational needs.The goal of heterogeneous computing is to assign these tasks and subtasks to machines and schedule their execution to optimize some performance measure. This measure may be as simple as the execution time of the meta-task. The measure may be more complex and be a mathematical function of various factors such as the weighted priorities of tasks, deadlines for task execution, security requirements, and quality of service (QoS) needs (see QoS). The process of assigning (matching) tasks/subtasks to machines and scheduling their execution is called mapping.A hypothetical example task with four subtasks that are best suited for different machine architectures is shown in Figure 1. The example task executes for 100 time units on a typical workstation. The task consists of four subtasks: the first (S1) is best suited to execute on a large cluster of PCs (e.g., a Beowulf Cluster), the second (S2) is best suited to execute on a distributed memory multiprocessor, the third (S3) is best suited to execute on a distributed shared memory machine, and the fourth (S4) is best suited to execute on a small shared memory machine.Executing the whole task on a large cluster may improve the execution time of the first subtask from 25 to 0.3 time units, and those of the other subtasks to varying extents. The overall execution time improvement may only be about a factor of five because other subtasks are not well suited for execution on a cluster (e.g., due to the need for inter-processor communication). However, using four different machines that match the computational requirements for each of the individual subtasks can result in an overall execution time that is better than the execution time on the workstation by a factor of over 50. For communicating subtasks, inter-machine data transfers need to be performed when multiple machines are used. Hence, data transfer overhead has to be considered as part of the overall execution time on the heterogeneous computing suite whereas there is no such overhead when the entire task is executed on a single workstation.This is a simplified example. Actual tasks may consist of a large number of subtasks with a much more complex inter-subtask communications structure. Also, the sharing of the machines by all the tasks in the meta-task must be considered when mapping.MappingFinding a mapping for tasks that optimizes some performance measure is, in general, an NP-complete problem. For example, consider mapping 30 tasks onto five machines. This means that there are 530 possible mappings. Even if it took only one nanosecond to evaluate each mapping, an exhaustive search to find the best mapping would require 530 nanoseconds > 1000 years! Therefore, it is necessary to have heuristics to find near-optimal mappings without using an exhaustive search. Factors that impact mapping decisions include: (1) match of the task computational requirements to the machine capabilities, (2) overhead for the inter-machine communication of code and data (initial and generated), (3) expected machine load and network congestion, and (4) inter-subtask precedence constraints.There are many different types of heuristics for mapping tasks to the machines in a heterogeneous computing suite. In static mapping heuristics [1], the mapping decisions are made off-line before the execution of the meta-task. A staticmapping heuristic is employed if (1) the tasks that comprise the meta-task are known a priori , (2) predictions about the available heterogeneous computing resources are likely to be accurate, and (3) the estimated expected execution time of each task on each machine in the suite is known reasonably accurately. Static mapping heuristics can be used for planning the “next day’s work” on a heterogeneous computing system.Figure 1. Hypothetical example (based on [4]) of the advantage of using a heterogeneous computing suite of machines. The number underneath each bar indicates execution time. For the suite, each subtask execution time includes the overhead to receive data. Not drawn to scale.In dynamic mapping heuristics [6], the mapping decisions are made on-line during the execution of the meta-task. Dynamic approaches to mapping are needed if any of the following are unpredictable: (1) arrival times of the tasks, (2) machines available in the heterogeneous computing system (some machines in the suite may go off-line and new machines may come on-line), and (3) expected execution times of the tasks on the machines. While a static mapper considers the entire meta-task to be executed (e.g., the next day) when making decisions, a dynamic mapper has only information about tasks that have already arrived for execution. Furthermore, because a dynamic mapper operates on-line, it must make decisions much faster than an off-line static mapper. Consequently, dynamic mapping heuristics often use feedback from the heterogeneous computing system (while tasks are executing) to improve any “bad” mapping decisions.A semi-static mapping heuristic [8] can be used for an iterative task whose subtask execution times will change from iteration to iteration based on the input data. A semi-static methodology observes, from one iteration to another, the effects of the changing characteristics of the task's input data, called dynamic parameters, on the task's execution time. The off-line phase uses a static mapping algorithm to generate high quality mappings for a sampling of values for the dynamic parameters a priori. During the on-line phase, the actual dynamic parameters are observed and a new mapping for the subtasks may be selected from the precomputed off-line mappings. Automatic Heterogeneous ComputingOne of the long-term goals of heterogeneous computing research is to develop software environments that will automatically map and execute tasks expressed in a machine-independent high-level language. Such an environment will facilitate the use of heterogeneous computing suite by increasing portability, because the programmer need not be concerned with the composition of the heterogeneous computing suite, and increasing the possibility of deriving better mappings than the user can derive with ad hoc methods. Thus, it will improve the performance of and encourage the use of heterogeneous computing. While no such environment exists today, many researchers are working to develop one. A conceptual model for such an environment using a dedicated heterogeneous computing suite of machines is described in Figure 2, and consists of four stages.Stage 1 uses information about the type of tasks in the meta-task and machines in the heterogeneous computing suite to generate a set of parameters relevant to both the computational characteristics of tasks and the architectural features of machines. The system then derives categories for computational requirements and categories for machine capabilities from this set of parameters.Stage 2 consists of two components: task profiling and analytical benchmarking. Task profiling (see Task Profiling) decomposes each task of the meta-task into subtasks, where each subtask is computationally homogeneous. The computational requirements of each subtask are quantified by profiling the code and data. Analytical benchmarkingexecution on a cluster(see Analytical Benchmarking) quantifies how effectively each available machine in the suite performs on each type of computational requirement.The information available from stage 2 is used by stage 3 to derive the estimated execution time of each subtask on each machine in the heterogeneous computing suite, along with the associated inter-machine communication overheads. These statically derived results are then incorporated with initial values for machine ready times, inter-machine network delays, and status parameters (e.g., machine/network faults) to perform the mapping of subtasks to machines based on a given performance metric. The result is an assignment of subtasks to machines and an execution schedule. The process as described corresponds to a static mapping.The subtasks are executed in stage 4. If dynamic mapping is employed, the subtask completion times and loading/status of the machines/network are monitored (shown in dashed lines in Figure 2). The monitoring process is necessary because the actual computation times and data transfer times may be input-data dependent and deviate considerably from the static estimates. This information may be used to re-invoke the mapping of stage 3 to improve the machine assignment and execution schedule.Figure 2. Model for integrating the software support needed for automating the use of heterogeneous computing systems (based on [7]). Ovals indicate information and rectangles indicate action.1 2 3 4Environments and ApplicationsExamples of heterogeneous computing environments are: (1) the Purdue University Network Computing Hubs, a wide area network computing system which can be used to run a selection of software tools via a World Wide Web browser [5]; (2) NetSolve, a client-server system with geographically distributed servers that can be accessed from a variety of interfaces, including MATLAB, shell scripts, C, and FORTRAN [3]; and (3) the Globus meta-computing infrastructure toolkit, a set of low-level mechanisms that can be built upon to develop higher level heterogeneous computing services [3].Example applications that have demonstrated the usefulness of heterogeneous computing include: (1) a three-dimensional simulation of mixing and turbulent convection at the Minnesota Supercomputer Center [7]; (2) the shipboard anti-air warfare program (HiPer-D) used at the Naval Surface Warfare Center for threat detection, target engagement, and missile guidance; and (3) a simulation of colliding galaxies performed by solving large n-body dynamics problems and large gas dynamics problems at the National Center for Supercomputing Applications [7]. Open Problems in Heterogeneous ComputingHeterogeneous computing is a relatively new research area for the computer field. Interest in such systems continues to grow both in the research community and in the user community. The realization of the automatic heterogeneous computing environment envisioned in Figure 2 requires further research in many areas. Machine-independent languages with user-specified directives are needed to (1) allow compilation of a given task into efficient code for any machine in the suite, (2) aid in decomposing tasks into subtasks, and (3) facilitate determination of subtask computational requirements. Moreover, methods must be refined for measuring the loading and status of the machines in the heterogeneous computing suite and the network, and for estimating the subtask completion times. Also, the uncertainty present in the estimated parameter values, such as subtask completion times, should be taken into consideration in determining the mappings. Other research areas are (1) developing communication protocols for reliable, low overhead data transmission over heterogeneous networks with given QoS requirements, (2) devising debugging tools that can be used transparently across the suite of machines, and (3) formulating algorithms for task migration between heterogeneous machines, using task migration for fault tolerance or load re-balancing. Acknowledgment: This work was supported by the DARPA/ITO Quorum Program through the Office of Naval Research under Grant No. N00014-00-1-0599.References[1] T. D. Braun, H. J. Siegel, N. Beck, L. L. Boloni, M. Maheswaran, A. I. Reuther, J. P. Robertson, M. D. Theys, B. Yao, D. Hensgen, and R. F. Freund, A Comparison of Eleven Static Heuristics for Mapping a Class of Independent Tasks onto Heterogeneous Distributed Computing Systems, Journal of Parallel and Distributed Computing, 61(6), 810-837, 2001.[2] M. M. Eshaghian (ed.), Heterogeneous Computing, Artech House, Norwood, MA, 1996.[3] I. Foster and C. Kesselman (eds.), The Grid: Blueprint for a New Computing Infrastructure, Morgan Kaufmann, San Francisco, CA, 1999.[4] R. F. Freund and H. J. Siegel (guest eds.), Special Issue on Heterogeneous Processing, IEEE Computer, 26(6), 1993.[5] N. H. Kapadia and J. A. B. Fortes, PUNCH: An Architecture for Web-Enabled Wide-Area Network-Computing, Cluster Computing: The Journal of Networks, Software Tools and Applications, Special Issue on High Performance Distributed Computing, 2(2), 153-164, 1999.[6] M. Maheswaran, S. Ali, H. J. Siegel, D. Hensgen, and R. F. Freund, Dynamic Mapping of a Class of Independent Tasks onto Heterogeneous Computing Systems, Journal of Parallel and Distributed Computing, Special Issue on Software Support for Distributed Computing, 59(2), 107-131, 1999.[7] M. Maheswaran, T. D. Braun, and H. J. Siegel, “Heterogeneous Distributed Computing,” in Encyclopedia of Electrical and Electronics Engineering, Vol. 8, J. G. Webster, ed., John Wiley, New York, NY, 1999, pp. 679-690. [8] M. D. Theys, T. D. Braun, Y.-K. Kwok, H. J. Siegel, and A. A. Maciejewski, “Mapping of Tasks onto Distributed Heterogeneous Computing Systems Using a Genetic Algorithm Approach,” in Solutions to Parallel and Distributed Computing Problems: Lessons from Biological Sciences, A. Y. Zomaya, ed., John Wiley & Sons, New York, NY, 2001, pp. 135-178.Cross Reference:Analytical Benchmarking see Heterogeneous Computing.Computational Grid see Heterogeneous Computing.Meta-Computer see Heterogeneous Computing.Meta-Task see Heterogeneous Computing.Task Profiling see Heterogeneous Computing.Dictionary Terms:Analytical BenchmarkingAnalytical benchmarking of a given computing machine provides a measure of performance of the machine on each of the different code types that may be present in a given source program. The performance of a particular code type on a specific kind of resource is a multi-variable function. Some of the variables of such a function may be: the quality of service requirements of the application program (e.g., data precision), the size of the data set to be processed, the algorithm to be applied, programmer and compiler efforts to optimize the program, and the operating system and architecture of the machine that will execute the specific code type. (See Heterogeneous Computing.) Computational GridA developing area of research and technology seeking to connect regional and national computational resources in a transparent fashion, thus transforming any computer connected to the grid into part of a new class of supercomputer. The implied analogy is with an electric power grid. If access to advanced computational capabilities and accessories became as ubiquitous and dependable as an electric power grid, the impact on society would be dramatic. (See Heterogeneous Computing.)Meta-ComputerA system framework that utilizes the resources of many different computers connected via a network to cooperate on solving a problem. In general, this allows the problem to be solved much more quickly than would be possible using a single computer. Meta-computers usually consist of heterogeneous, distributed elements, and operate in a coarse-grained fashion. A meta-computer would be a more localized component of a larger computational grid. (See Heterogeneous Computing.)QoSQoS (Quality of Service) is an aggregate function of many different system characteristics used to represent the overall performance of a system. The components in the function, and the computation of the function itself, vary widely (i.e., QoS means many different things to many different people). Sample components of a QoS measure could include task deadlines, data precision, image color range, video jitter, network bandwidth, bit error rate, and end-to-end latency. (See Heterogeneous Computing.)Task ProfilingTask profiling of a given source program specifies types of computations that are present in the source program by decomposing it into code blocks based on computational requirements of the blocks. The set of computation types defined depends on the architectural features of the machines available for executing the source program or its subprograms, and on both the application task code and the types and sizes of data sets it is to process. (See Heterogeneous Computing.)。
optimalk值,基于calinski-harabasz准则 -回复
optimalk值,基于calinski-harabasz准则-回复什么是优化的k值及其意义?在聚类分析中,k值是指将数据集划分为k个簇的数量。
选择合适的k值对于聚类结果的准确性和可解释性至关重要。
优化的k值需要根据具体的数据集和分析目的来确定。
而Calinski-Harabasz准则是一种常用的评估聚类结果的指标之一,它结合了簇内的离散度和簇间的分离度,通过计算Calinski-Harabasz指数来衡量聚类结果的质量。
在这篇文章中,我们将探讨如何通过Calinski-Harabasz准则来选择最优的k值,以获得更好的聚类结果。
首先,我们需要了解Calinski-Harabasz准则的计算方法。
该准则计算的是每个簇内部的离散度和簇间的分离度的比值,即Calinski-Harabasz指数。
指数越大,则表示聚类结果的质量越好。
计算公式如下:CalinskiHarabasz Index = (BSS / WSS) ×(N - k) / (k - 1)其中,BSS(Between-Cluster Sum of Squares)表示簇间的离散度,WSS(Within-Cluster Sum of Squares)表示簇内的离散度,N表示样本数量,k表示簇的数量。
接下来,我们需要构建一个计算Calinski-Harabasz指数的函数,以便后续使用。
代码示例如下:pythonimport numpy as npfrom sklearn.metrics import pairwise_distancesdef calinski_harabasz(X, labels):n = X.shape[0]k = len(np.unique(labels))centroids = np.zeros((k, X.shape[1]))for i in range(k):centroids[i] = np.mean(X[labels == i], axis=0)WSS = np.sum(pairwise_distances(X, centroids[labels], metric='euclidean')2)BSS = np.sum(pairwise_distances(centroids, centroids, metric='euclidean')2)ch_index = (BSS / WSS) * (n - k) / (k - 1)return ch_index接下来,我们将使用该函数来选择最优的k值。
无线传感网络中能量和距离改良的LEACH分簇算法
无线传感网络中能量和距离改良的LEACH分簇算法邬厚民【摘要】LEACH算法作为经典分簇算法在无线传感器网络中有着广泛应用,但由于没有考虑簇头数量及监测区域等因素,使得网络消耗巨大,大大缩减了网络的生命周期.针对这一缺陷,在Warneke的最优覆盖定理的基础上,提出CDE-LEACH算法,通过在基站中预构建“数据表”存储最优覆盖理想簇头位置坐标,结合保证网络能量消耗最小这一目标来选取最优的簇头,改善LEACH算法随机选择簇头的弊端.在Matlab 7.0实验仿真平台下对提出的CDELEACH算法进行仿真,与LEACH算法结果对比发现,网络能量消耗大大减少,并且延长了网络生命周期.%LEACH algorithm as a classic clustering algorithm is widely used in wireless sensor networks. But for the number of cluster head, monitoring areas and other factors are not taken into consideration, the network greatly consumes, and its life is hugely reduced. To overcome these defects, the author proposed a kind of CDE-LEACH algorithm on the basis of the optimal covering theorem presented by Wameke. In the suggested algorithm, iv pre-built "data table" to storage optimal coverage location coordinates of the ideal cluster head in the base station and combined with the goal of guaranteeing minimum network energy consumption to select the optimal cluster head, and to overcome the drawbacks of the cluster head randomly selected by the LEACH algorithm. The simulations of CED -LEACH algorithm and LEACH algorithm were carried out on the experimental simulation platform, Matlab 7.0, and their results were compared. The results show thesuggested algorithm greatly reduced the network energy consumption, and extend the network life cycle.【期刊名称】《中国测试》【年(卷),期】2012(038)005【总页数】5页(P62-65,101)【关键词】最优覆盖;CDE-LEACH算法;分簇;能量;距离【作者】邬厚民【作者单位】广州科技贸易职业学院,广东广州511442【正文语种】中文【中图分类】O233;TN926;TP393;TM930.120 引言能耗问题一直是制约无线传感器网络发展的关键问题。