IBM Cognos 产品功能介绍
Cognos报表展示

Cognos
• 我们可以把商业智能看成一种解决方案。商业智能的关键是从许多来自不同的企业运作系统的数据中提取出 有用的数据并进行清理,以保证数据的正确性,然后经过抽取(Extraction)、转换(Transformation)和 装载(Load),即ETL过程,合并到一个企业级的数据仓库里,从而得到企业数据的一个全局视图,在此 基础上利用合适的查询和分析工具、数据挖掘工具、OLAP工具等对其进行分析和处理(这时信息变为辅助 决策的知识),最后将知识呈现给管理者,为管理者的决策过程提供支持。目前,商业智能产品及解决方案 大致可分为数据仓库产品、数据抽取产品、OLAP产品、展示产品、和集成以上几种产品的针对某个应用的 整体解决方案等。
上钻,下钻,穿透钻取,到 任意相关信息
自助式报表,查询和分析, 提高了最终用户得到信息 的速度
用户
和MS Office无缝集成
多语言支持
为用户屏蔽数据的复杂性
低培训和支持成本,支持广泛的用户范围
Cognos技术特点
考察角 度 友好性
统一元 数据 Web方式
前端工具
界面简洁,从简单到复杂报表都是直 接使用鼠标拖拽,不需要编写程序 所有的前端功能使用统一的元数据。
ห้องสมุดไป่ตู้
议程
1.Cognos工具介绍 2.Cognos报表解决方案 ▪ 1).动态交互式报表 ▪ 2).仪表盘式报表 ▪ 3).图文并茂复杂报表 ▪ 4).中国式复杂报表 ▪ 5).统计分析报表 3.Cognos报表工具特点
仪表盘报表显示
议程
1.Cognos工具介绍 2.Cognos报表解决方案 ▪ 1).动态交互式报表 ▪ 2).仪表盘式报表 ▪ 3).图文并茂复杂报表 ▪ 4).中国式复杂报表 ▪ 5).统计分析报表 3.Cognos报表工具特点
TM1做项目流程

3.建立多维数据集的规则和计算
4.发布应用程序,可以将Perspectives中做的报表效果发布到应用程序中,以便客户的使用。
五、案例
做传统报表存在的问题:
数据采集困难、报表格式单一、数据冗余、数据利用率低等
报表格式不够灵活、模板复用性不强、智能化程度不高。
Architect主要是针对开发人员,TM1 Performance Model主要针对业务人员。
Configuration就是一个配置界面配置管理主机、服务器等
Cognos Insight是做展示的工具
Performance是基于Excel对最终的视图做报表展现。
四、做一个项目的流程
1.梳理业务、数据
文本文件存储了由代理商采集的实际销售数据和生产厂商的预算数据,将这些数据文件转换为TM1可识别的数据文件后加载到TM1多维数据集中。
2)服务器
服务器包括TM1管理服务器和TM1服务器。TM1管理服务器是TM1服务器的服务器,它负责跟踪和管理网络中所有的TM1服务器。TM1服务器启动时首先向TM1管理服务器注册,然后TM1客户端与TM1管理服务器建立通信,获取可用TM1服务器信息;确定可用TM1服务器后,与之建立连接。
预算数据模板文件包括代理商、代理商类型、批发商、产品一级大类(H2)以及月份。厂商按照这些信息对一个财政年度的各个月做预算。
ETL工具在加载实际销售数据时,从实际销售数据采集模板的第4行开始逐行读取,加载预算数据时从预算数据采集模板的第2行逐行读取。
2.2数据ETL设计
数据模型是本系统的核心,数据模型主要由多维数据集和加载数据的Process组成。
销售点
H2
IBM Cognos PowerPlay V11.0 管理指南说明书

IBM Cognos PowerPlay V11.0管理指南IBM©产品信息本文档适用于 IBM Cognos Analytics V11.0.0,还可能适用于后续发行版。
版权Licensed Materials-Property of IBM©Copyright IBM Corp.2005,2017.US Government Users Restricted Rights–Use,duplication or disclosure restricted by GSA ADP Schedule Con-tract with IBM Corp.IBM、IBM徽标和 是 International Business Machines Corp.在全球许多管辖区域内注册的商标或注册商标。
其他产品和服务名称可能是 IBM或其他公司的商标。
IBM商标的当前列表可以在 Web上的"Copyright and trade-mark information"中获取,网址为:/legal/copytrade.shtml。
下列各项是其他公司的商标或注册商标:v Adobe、Adobe徽标、PostScript以及 PostScript徽标是 Adobe Systems Incorporated在美国和/或其他国家或地区的注册商标或商标。
v Microsoft、Windows、Windows NT和 Windows徽标是 Microsoft Corporation在美国和/或其他国家的商标。
v Intel、Intel徽标、Intel Inside、Intel Inside徽标、Intel Centrino、Intel Centrino徽标、Celeron、Intel Xeon、Intel SpeedStep、Itanium和 Pentium是 Intel Corporation或其子公司在美国和其他国家或地区的商标或注册商标。
Cognos基础知识及操作入门

调整数据库连接池大小, 以适应并发访问需求。
使用缓存技术,提高数据 访问速度。
05 报告设计技巧与实践
报告布局与样式设置方法
布局原则
遵循简洁明了、重点突出、信息完整等原则,合理规 划报告布局。
样式设置
通过调整字体、颜色、背景等样式元素,提升报告整 体视觉效果。
标题与段落
实时数据刷新机制设置方法
数据源配置
确保数据源连接正常,并设置合适的数据刷新频率。
缓存策略
合理利用缓存机制,减轻服务器负担,提高数据加载速度。
异步加载
采用异步加载技术,避免页面卡顿和数据延迟现象。
实时推送
结合WebSocket等实时通信技术,实现数据的实时推送和更新。
仪表板性能优化建议
数据预处理
在数据源端进行数据清洗、聚合等预处理操 作,减少数据传输量和计算复杂度。
最近访问
显示用户最近访问的报告或仪表板,方便快速进 入。
菜单栏与工具栏功能详解
01
菜单栏
包括文件、编辑、查看、插入、 格式、工具、窗口和帮助等菜单 项,提供全面的操作选项。
工具栏
02
03
右键菜单
提供常用功能的快捷按钮,如保 存、打印、剪切、复制、粘贴、 撤销和重做等。
在报告或仪表板中右键单击元素 ,可弹出针对该元素的特定操作 菜单。
立方体(Cube)
多维数据集的一种表现形式,由多个维度和度量组成,用于数据分析 和报表展示。
维度(Dimension)
描述数据业务特性的层级结构,如时间、地区、产品等。
度量(Measure)
用于聚合计算的数值型数据,如销售额、利润等。
多维数据集(Multidimension…
IBM Cognos TM1商品说明书

Leveraging IBM Cognos TM1for Merchandise Planning at Tractor Supply CompanyDan Thomas –Architect, Financial Systems Tractor Supply CompanyRicky Rielly –Implementation Manager QueBIT ConsultingAgenda✓Introductions and Company Overviews✓TSC Merchandise Planning Solution Overview ▪Prior State▪Solution and Implementation✓Tips & Tricks for TM1 Perspectives Templates ✓Q&AQueBIT OverviewRicky Rielly –Implementation ManagerAbout QueBIT▪Trusted Experts in Analytics▪15+ years in business with managers on the team who have been working in area of Analytics for 20+ years ▪Full Offerings -Advisory & Implementation Services, Reseller of IBM Software and Developer of Solutions ▪900+ successful Analytics Projects▪450+ analytics customers in all types of industries▪100+ employees with HQ in New York▪Building an experienced team from the ground up▪Deep Expertise in Financial Analytics, Advanced Analytics, Business Intelligence, and DHW ▪Strong focus in Financial Services sector▪Multi-Year Award WinnerQueBIT: Trusted Experts in AnalyticsWe’re driven to help organizationsimprove their agility to makeintelligent decisions that createvalue.This is why we’re committed toexcellence in analytics strategy andimplementation.Tractor Supply Company OverviewDan Thomas –Architect, Financial SystemsTractor Supply Company Overview•Founded in 1938 as a mail order catalog business offering tractor parts to American farmers•Today operating in over 1600 stores in 49 states, annual revenue of $6.8B •Stores primarily located in towns outlying major metropolitan markets and in rural communities•Customers include farmers, horse owners, ranchers, part-time and hobby farmers, and suburban and rural homeowners, as well as contractors and tradesmen•Selling products relating to animal care, truck tool and hardware, seasonal and agricultural products, clothing and giftsRicky Rielly –Implementation ManagerTractor Supply Company and QueBIT •Initial Merchandise Planningmodel implemented in 2014•Core focus on future scalabilityand knowledge transfer•New models and enhancementssince thenTractor Supply Prior State Overview•Primarily Cognos Enterprise Planning solution •Supplemented with manual Excel work•Lack of scalability and manual workarounds •Inflexibility and difficulty with multiple concurrent users •Time consuming to administrate and maintain•Granular, SKU level data loaded to a staging cube▪This data then feeds downstream modules and is used in calculations •Planning occurs on a rolling basis at a Category level•Key Item Planning and other additional modules•Architecture leaves room for future growth▪More products/channels▪Additional modules•Actuals automatically loaded by SKU daily•Significant time savings•Greater scalability•Streamlined process for Merch Planners•Automated handling of 53rd week comparisons in calculations•Can handle restatement of Plan and Forecast based on annual hierarchy realignment•Flexible and streamlined reporting interface•Robust and intuitive Planning user experienceDan Thomas –Architect, Financial SystemsVisual Presentation Tips•Don’t underestimate the importance of the visual aspects within your templates•Use outside sources for inspiration (business journals, other BI / analytic tools, etc.)•If graphic design is not one of your skills, partner with someone who has a talent for that•Incorporating your company logo into templates is a small thing that can make a big perceived difference•You can use gradient shading to give your headers more “pop”Format cells> Fill Effects> Gradient: Two Colors, Horizontaluse a differential of at least two tones, lighter color on top•Add alternate row shading in Active Forms containing a large number of rows and columnsYou can add additional levels within the format area.Here we have added “M” to serve as the alternating format for “N”, and “P” for the total.You can change the formula for the format identifier in the first column of the first row containing data. Make the cell references to be relative, not absolute, so that each row of the Active Form is compared to the row above it.Dan Thomas –Architect, Financial SystemsTSC Forecast Template –Unique Features•Drop downs in Excel for product selection instead of the Subset Editor Less clicks for the end user to get where they want to goShould only be used with reasonably sized subsets because there are calculations which add some overheadUser types in the name of a Product dimension subset (cell A15 in the example below), which powers the available selections within the drop down menu in cell A14TSC Forecast Template –Unique Features Drop Downs (2)To derive the drop down list, hard code a list of index numbers (column B in the example below) Use the DIMSIZ function to evaluate whether the index number is valid within the dimensionIf it is, use the SUBNM function to list the name of the element with that index numberTSC Forecast Template –Unique FeaturesDrop Downs (3)Leverage naming conventions for product codes within the dimension to indent based upon the hierarchy level. Use this output for the drop down.For product codes within our product hierarchy, Categories start with “C”, Departments start with “D” and buyers start with “B”. We used IF formulas to indent a certain number of spaces when the first letter of the element met that condition.There are no product codes in the Go_New_Stores library (only product names), so the example below used the result of the ELLEV function instead.•Used conditional formatting to alert users when they are in a sandbox version This may require VBA to determine the name of the active sandbox for that user. If it’s not equal to “Base” (or blank), then the user is in a sandbox and you can display the conditional formatting. We chose to use a bright blue bar.Not in a sandbox version:In a sandbox version:•User Defined Consolidations (UDCs)User Defined Consolidations allow end users to create a Private customized rollup of elements. This parameter must be set in the Config file: UserDefinedCalculations=T To create a User Defined Consolidation:Step 1 –Create a private subset of elements. We recommend to our users prefixing that name with “udc_” .User Defined Consolidations (2)Step 2 –Insert that private subset into a new one to create a rollup.a) Launch the Subset Editor and remove all visible elements (select all elements in the view and then Delete).b) Go to Edit>Insert Subset from the top of the Subset Editor. Use the Select Subset drop down to choose theprivate subset you had created and click OK.A rollup for the elements in that subset is then created (udc_Golf Clubs in the example below).The name of the rollup is the same as the subset you inserted.c) Save this new subset that contains the rollup (expand before saving). We recommend to our users that theyname this the same as their private subset, without the “udc_” prefix.Quirks: If you modify your original subset,the rollup will not automatically update withthose changes.Depending on how your security is setup,users might be able to spread from therollup.User Defined Consolidations (3)We modified the formulas for the product selection drop downs so that they can handle UDCs.The rollup element in the UDC does not have an index number within the dimension, so you can modify the formula for the first element to be equal to the subset name the user enters (the value in cell A15 in the template example).The UDC rollup is immediately available to the user in the template.•User can change the Year (cell P14 below) so that they can easily access historical data•Dynamic Actual / Forecast period headers determined by Time Control values•Conditional formatting used to display cells with Write access in white•Autocalc VBA to use Perspectives in Manual Calculation mode but behave like Automatic Calculation modeEvery time there’s a change it executes F9 behind the scenes for the userAutomatic calculation mode was exponentially slower with our models•Button that uses VBA to export the template to Excel as flat data Loops through the elements of the active product subset, pastes as values in new file Creates a separate tab for each element•To reduce overhead, most variance calculations only exist in Excel •Assigned a shortcut icon for Perspectives that’s different than Excel so that users can easily distinguish which Excel session is in Manual calc. mode Excel 2010 Example (this will launch the TM1 add-in within a new Excel session):Target: "C:\Program Files (x86)\Microsoft Office\Office14\EXCEL.EXE" "C:\Program Files\ibm\cognos\tm1\bin\tm1p.xla"Dan Thomas –Architect, Financial SystemsOther Tips•Use SUMIF or SUMIFS with Active Forms to create custom subtotals If you add a string element within a cube and Active Form, it can be used to store descriptions which can then be leveraged by SUMIF or SUMIFS formulas. These can be used to create “on the fly” customized subtotals in Excel. Since these descriptions are stored within the cube, the user only needs to enter them once and they are recalled any time they come back to the Active Form.Step 1 -Create a string element. This will need to be within the dimension ordered last within the cube. In this example I have added the “Group” element to the Store Sales Plan dimension (Go_New_Stores sample model).Step 2 -Add attributes relating to the appropriate number of groups you wish end users to be able to utilize. In this example, I have added Group 01, Group 02…Group 05 attributes to the Retailers dimension, in order to give end users the ability to see customized subtotals for up to 5 different product groups by Retailer.Other TipsUse SUMIF or SUMIFs with Active Forms (2)Step 3 -Add the string element to the Active Form with DBRWs so that any entry will be stored within the cube. In this example I have added a column for the Group element within an existing Active Form pointing to the Store Sales Plan cube. Step 4 –Several rows below the Active Form, add a section for the customized subtotals. Let the values of each row represent one of the attribute groups that you created, and add a DBRW to the attribute cube so that the end user can assign a value for each group as needed.In this example I have created 5 rows representing each of the 5 Group attributes. The Group column contains DBRWs which point to their corresponding group attribute (Group 01 -05) within the }ElementAttributes_Retailers cube.Other TipsUse SUMIF or SUMIFs with Active Forms (3)Step 5 -Use SUMIF or SUMIFS formulas to sum the values within the Active Form if it matches the description entered for each group attribute. The formulas must extend from the first data row within the Active Form through one line below the last data row. Use relative, not absolute references so that it becomes dynamic and adjusts to the changing number of rows as the Active Form is rebuilt.This becomes a much more powerful feature when a dimension representing context, such as an event, is present within the cube. In that case the subtotals are event specific, since the data represents the intersection of that particular product group within that event (using the Retailers dimension in the Go_New_Stores example was a less than ideal substitute).Other Tips•You can use Excel and VBA along with TM1 data to create Heat Maps by state, or any other geographic division in PerspectivesQ&ACopyright ©2017by International Business Machines Corporation (IBM). No part of this document may be reproduced or transmitted in any form without written permission from IBM.ernment Users Restricted Rights—use, duplication or disclosure restricted by GSA ADP Schedule Contract with IBM. Information in these presentations (including information relating to products that have not yet been announced by IBM) has been reviewed for accuracy as of the date of initial publication and could include unintentional technical or typographical errors.IBM shall have no responsibility to update this information. This document is distributed “as is” without any warranty, either express or implied. In no event shall IBM be liable for any damage arising from the use of this information, including but not limited to, loss of data, business interruption, loss of profit or loss of opportunity. IBM products and services are warranted according to the terms and conditions of the agreements under which they are provided.IBM products are manufactured from new parts or new and used parts. In some cases, a product may not be new and may have been previously installed. Regardless, our warranty terms apply.”Any statements regarding IBM's future direction, intent or product plans are subject to change or withdrawal without notice. Performance data contained herein was generally obtained in a controlled, isolated environments.Customer examples are presentedas illustrations of how those customers have used IBM products and the results they may have achieved.Actual performance, cost, savings or other results in other operating environments may vary.References in this document to IBM products, programs, or services does not imply that IBM intends to make such products, programs or services available in all countries in which IBM operates or does business.Workshops, sessions and associated materials may have been prepared by independent session speakers,and do not necessarily reflect the views of IBM.All materials and discussions are provided for informational purposes only, and are neither intended to, nor shall constitute legal or other guidance or advice to any individual participant or their specific situation.It is the customer’s responsibility to insure its own compliance with legal requirements and to obtain advice of competent legal counsel as tothe identification and interpretation of any relevant laws and regulatory requirements that may affect the customer’s business and any actionsthe customer may need to take to comply with such laws.IBM does not provide legal advice or represent or warrant that its services or products will ensure that the customer is in compliance with any law.continuedInformation concerning non-IBM products was obtained from the suppliers of those products, their published announcements or other publicly available sources.IBM has not tested those products in connection with this publication and cannot confirm the accuracy of performance, compatibility or any other claims related to non-IBM products.Questions on the capabilities of non-IBM products should be addressed to the suppliers of those products. IBM does not warrant the quality of any third-party products, or the ability of any such third-party products to interoperate with IBM’s products. IBM expressly disclaims all warranties, expressed or implied, including but not limited to, the implied warranties of merchantability and fitness for a particular, purpose.The provision of the information contained herein is not intended to, and does not, grant any right or license under any IBM patents, copyrights, trademarks or other intellectual property right.IBM, the IBM logo, ,Aspera®, Bluemix, Blueworks Live, CICS, Clearcase, Cognos®, DOORS®, Emptoris®,Enterprise Document Management System™, FASP®, FileNet®, Global Business Services®, Global Technology Services®, IBM ExperienceOne™, IBM SmartCloud®, IBM Social Business®, Information on Demand, ILOG, Maximo®, MQIntegrator®,MQSeries®,Netcool®, OMEGAMON, OpenPower, PureAnalytics™, PureApplication®, pureCluster™, PureCoverage®, PureData®, PureExperience®, PureFlex®, pureQuery®,pureScale®, PureSystems®,QRadar®, Rational®, Rhapsody®, Smarter Commerce®, SoDA, SPSS, Sterling Commerce®, StoredIQ, Tealeaf®, Tivoli®Trusteer®, Unica®,urban{code}®, Watson, WebSphere®, Worklight®,X-Force®and System z®Z/OS, are trademarks of International Business Machines Corporation, registered in many jurisdictions worldwide. Other product and service names might be trademarks of IBM or other companies. A current list of IBM trademarks is available on the Web at "Copyright and trademark information" at: /legal/copytrade.shtml.Thank you!。
与同类产品功能优势对比一览
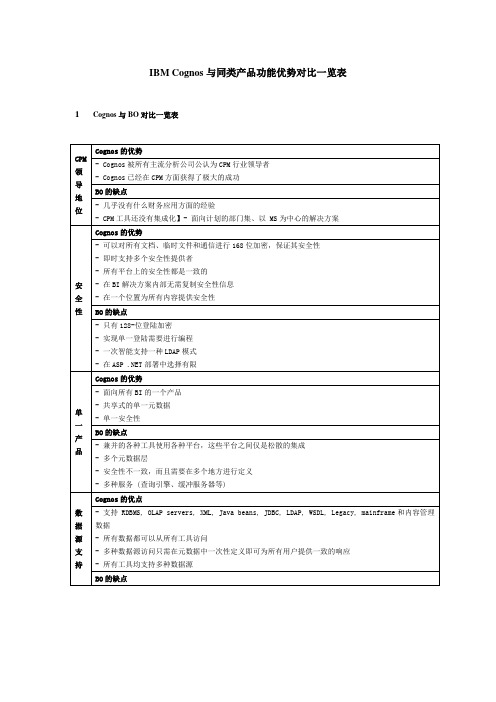
IBM Cognos与同类产品功能优势对比一览表1Cognos与BO对比一览表
2Cognos与Hyperion对比一览表
3Cognos与MicroStrategy对比
MicroStrategy其他不足之处
●没有即席报表工具。
●占数据库容量极大,要求在数据库中建立大量的聚合表和大量磁盘空间。
对数据库的压力极大,
消耗资源大,性能低下。
●开发成本高,设计复杂,有大量的编程量,在时间、成本和人力投入方面有很大风险。
●报表功能有限制。
不可以制作不平衡的嵌套交叉表和汇总报表,无法做到让用户可自定义格式的
各种类型的嵌套交叉表和表头格式设计布局。
●报表访问性能极慢。
由于MicroStrategy所有报表都是基于SQL的报表,所以数据量大的报表访
问速度慢,而且并发访问报表的数量受限。
●在中国没有成功的大用户的案例。
Cognos的详细的组件以及对应的功能描述
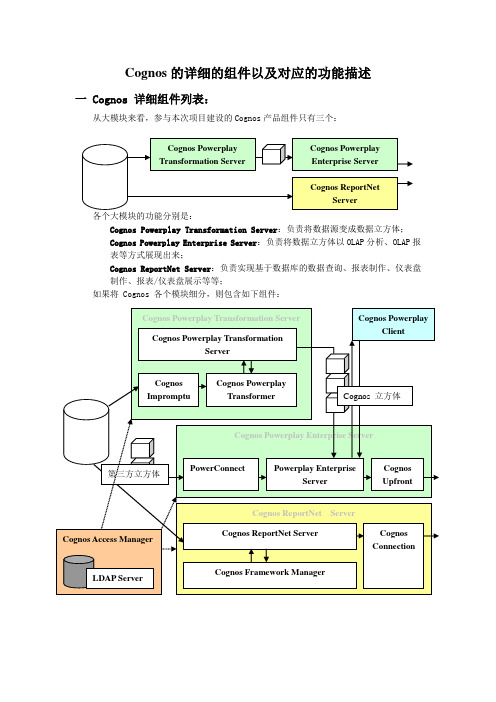
Cognos的详细的组件以及对应的功能描述一 Cognos 详细组件列表:从大模块来看,参与本次项目建设的Cognos产品组件只有三个:各个大模块的功能分别是:Cognos Powerplay Transformation Server:负责将数据源变成数据立方体;Cognos Powerplay Enterprise Server:负责将数据立方体以OLAP分析、OLAP报表等方式展现出来;Cognos ReportNet Server:负责实现基于数据库的数据查询、报表制作、仪表盘制作、报表/仪表盘展示等等;如果将 Cognos 各个模块细分,则包含如下组件:二 Cognos 组件功能介绍:参照上图,我们介绍一下每个Cognos组件的功能:Cognos Powerplay Transformation Server部分:Cognos Impromptu:主要用来连接数据库,形成数据源定义(IQD文件),Transformer 会根据数据源定义到源数据库中抽取数据;Cognos Transformer:在Windows界面中提供一个图形化的模型设计界面,供开发人员设计模型和调试模型;在UNIX版本中,这个模块名称为 Cognos Powerplay Transformer UNIX Client,增加了设计界面对服务器的控制菜单;Cognos Transformation Server:后台的OLAP数据抽取转换引擎,用来把源数据抽取出来形成数据立方体。
在Windows版本中,它与前端设计界面Cognos Transformer 是结合在一起的;在UNIX版本中,它与前端的模型设计界面是分离的,安装在UNIX 环境中,接受命令行或来自于客户端的调度。
Cognos Powerplay Enterprise Server部分:PowerConnect:Cognos Powerplay Enterprise Server与第三方数据立方体的连接接口,通过PowerConnect,可以将MSOLAP、Essbase、IBM DB2 OLAP、SAP R/3 BW 等第三方数据立方体通过Cognos展现出来;Powerplay Enterprise Server:负责通过Web方式或Client方式展现数据立方体、提供OLAP界面和报表界面的服务器产品,是整个Cognos OLAP应用的核心;Cognos Upfront:Cognos Powerplay Enterprise Server提供的门户界面,可以定制外观、功能。
cognos安装使用教程

Cognos的主界面包括菜单栏、工具栏、导航窗格、工作区和状态栏。菜单栏提供文件、 编辑、视图等基本操作;工具栏提供常用功能的快捷按钮;导航窗格显示项目、文件夹 和报表等资源的树状结构;工作区用于显示和编辑报表;状态栏显示当前登录用户和系
统状态信息。数据源配置01Fra bibliotek添加数据源
在Cognos中,可以通过“数据源”向导添加新的数据源。支持的数据
硬件要求
安装Cognos的服务器应具备足够 的内存、处理器和存储空间,以确 保系统的稳定运行和性能。
网络要求
确保服务器可以访问互联网,以便 下载安装包和获取更新。
安装包准备
从官方网站下载最新版本的Cognos 安装包。确保选择与您的操作系统和 硬件兼容的版本。
在下载安装包之前,请仔细阅读官方 文档,了解安装过程中的注意事项和 常见问题。
确保服务器的防火墙和安全设置允许Cognos的正常运行,包括网络通 信和文件访问等。
03
cognos安装步骤
安装向导启动
下载Cognos安装包
从IBM官方网站或其他可信来源下载 Cognos的安装包。
启动安装程序
双击下载的安装包,启动Cognos的安装向 导。
选择安装语言
在安装向导中选择您偏好的安装语言。
源类型包括关系型数据库、多维数据库、XML文件等。添加数据源时需
要提供数据源的名称、类型、连接字符串等信息。
02
配置数据源属性
在数据源配置界面中,可以设置数据源的属性,如连接超时时间、查询
超时时间、最大连接数等。这些属性可以根据实际需要进行调整,以优
化系统性能。
03
测试数据源连接
配置完成后,可以点击“测试连接”按钮,验证数据源配置是否正确。
- 1、下载文档前请自行甄别文档内容的完整性,平台不提供额外的编辑、内容补充、找答案等附加服务。
- 2、"仅部分预览"的文档,不可在线预览部分如存在完整性等问题,可反馈申请退款(可完整预览的文档不适用该条件!)。
- 3、如文档侵犯您的权益,请联系客服反馈,我们会尽快为您处理(人工客服工作时间:9:00-18:30)。
Cognos产品功能介绍Cognos产品构成系统物理结构共分为四层1.数据源层:包括业务数据库、数据集市、数据仓库、多维立方体以及其他来源的非关系型数据,作为查询统计分析的数据来源。
2.模型定义层:模型定义层可以分为两部份,一部分通过Cognos BI Modeling 将数据库在应用层定义为数据查询模型,定义的内容包括:数据库中的表字段在模型层被重新命名,重新组织,使其符合业务人员的逻辑;表及字段被赋予应用级安全性,保证恰当的人可以看到恰当的数据。
第二部分是将通过Cognos BI OLAP Modeling统计汇总数据按照业务逻辑生成多维立方体,将数据按照多维信息重新进行组织并且在应用层设置权限,使用户进行统计分析时得到较好的性能和灵活的查询组合方式。
3.应用服务器层:应用服务器层的Cognos BI Server for Reporting和Cognos BI Server for Analysis将在模型定义层中定义的模型和多维立方体通过Web Server进行发布展示。
需要注意的是,查询模型和多维立方体是可以通过“穿透钻取”有效的连接起来,使得分析—然后—查询的Cognos分析模式得到很好的体现。
4.浏览器层:企业用户可以通过浏览器无需任何插件来进行查询、统计分析,得到正确的信息。
对系统进行管理。
在整个系统中,Cognos主要如下产品:Cognos BI OLAP ModelingCognos BI Server for AnalysisCognos BI ModelingCognos BI Server for Reporting(1) BI OLAP ModelingBI OLAP Modeling是Cognos提供的企业级OLAP 模型设计工具,它将从各类数据源(数据库、数据仓库、平面文件)中筛选出来的数据创建成多维数据立方体。
立方体是按探察业务的OLAP多维因素分析模型的设计创建,通过对多维数据立方体的OLAP分析,用户可以辨明趋势、跟踪业务运作、创建高效的统计汇总报表。
Cognos BI OLAP Modeling具有极高的存储效率和响应速度,完全脱离了关系型数据库在性能和存储空间效率上的羁绊,保证用户在访问数据时达到秒级的响应速度。
(2) Cognos BI ModelingCognos BI Modeling是Cognos的元数据模型设计工具,它可以连接多个数据源,对数据结构进行描述,为Cognos的多维分析,即席查询,报表等各种应用提供统一一致的数据视图,降低对企业数据访问的复杂性,同时提供对各种应用使用的结构的统一的管理。
(3)Cognos BI Server for AnalysisCognos BI Server for Analysis是业界领先的OLAP展现工具。
它不仅能够让企业中的每一位员工都能够轻松自如地访问企业重要数据,从而更有效地管理其业务;还能对企业数据进行多维分析和统计汇总报表制作,从而展现整个企业发展的趋势、控制业务运作。
Cognos BI Server for Analysis具有强大的定制分析制作能力,而这一切仅需用户通过鼠标托拽操作来完成,Cognos BIServer for Analysis的易用性使得用户仅需要少量培训即可投入使用。
Cognos BI Server for Analysis以提供零客户端的纯Web访问方式,具有易用性出色的使用界面,同时又使得部署成本降到最低。
(4)Cognos BI Server for ReportingCOGNOS BI SERVER FOR REPORTING是基于Web的即席查询报表制作/展现工具,用来从企业的关系型数据库中直接取出数据进行查询和报表展现,或者定时生成固定报表,满足用户对底层数据深入探查的需求。
COGNOS BI SERVERFOR REPORTING展现的报表基于BI Modeling定制的数据结构,用户可以在浏览器中自定义报表,格式灵活,元素丰富,而且可以通过COGNOS BI SERVER FOR REPORTING进行完全即席的开放式查询。
COGNOS BI SERVER FORREPORTING可以接受来自Cognos BI Server for Analysis的穿透钻取,使用户在分析汇总数据的同时能够深入到自己感兴趣的细节数据中,以便更全面地了解情况,做出正确决策。
COGNOS BI SERVER FOR REPORTING强大的报表制作和展示功能能够制作/展示任何形式的细节报表,其纯粹的Web界面使用方式又使得部署成本和管理成本降到最低。
COGNOSBI SERVER FOR REPORTING还提供了HTML、PDF甚至是XML等多种输出格式,提供给用户最全面的数据查询和即席报表展现功能。
Cognos产品特性简介1.平台独立性Cognos支持主流的UNIX和Windows,在各个平台上的功能没有任何区别。
Cognos的数据探查、分析、报表功能不依赖于任何第三方的支持,都能提供同样强大的功能和出色的表现。
2.安全认证Cognos具有统一的安全性认证机制,在Web方式下提供了完善的安全性认证,安全性能控制到报表单元格级别的访问。
同时Cognos的安全性还是一个开放的安全性系统,能够嵌入操作系统、网络域等多种企业现有的安全性方案中。
Cognos严密有效的安全性机制能有效保证企业数据的安全,为真正的企业级应用打下良好的基础。
3.元数据管理Cognos具有一致,统一的元数据管理,同时在元数据层具有完备的安全性控制。
能够为整个企业提供一致的数据视图。
由管理员或高级用户定义元数据模型,管理种类繁多的字段、表连接、视图等等对象,并且元数据可以贯穿整个Cognos应用始终,便于最终用户探查细节数据。
能够平滑的适应从简单到复杂的应用环境。
4.开放的数据访问用户可以访问各种数据源,基于这些数据源制作报表,分析,这些数据源包括关系型数据库 (IBM, Oracle, SQL, Teradata, Sybase, ODBC, etc.)Cognos Cube:Cognos PowerCubes, Cognos Planning Contributor Cubes, and Cognos Finance CubesOLAP (Microsoft SQL Server Analysis Services, IBM DB2/OLAP, Hyperion Essbase其它:XML, JDBC, LDAP, WSDL对于关系型数据库的内容,也可以定义维度等内容,使用户能够像操作Cube一样对关系型数据库中数据进行分析。
同时ReportNet的强大报表功能也扩展到了OLAP数据源。
可直接通过Query Studio, Report Studio对OLAP数据源进行访问,生成查询和报表。
5.报表制作纯浏览器方式:Cognos采用的是纯浏览器方式,整个系统中最终用户的使用界面为真正的零安装、零维护。
多数据源:Cognos 可以同时连接多数据源,甚至异构数据源,一个报表中可以分页设计,每页都可以进行多查询,每个查询可以连接多个数据源。
从而使系统能够很好的应用在复杂环境中。
存储过程:Cognos 对各种数据库的存储过程都能友好的支持。
可直接将存储过程返回的结果集字段以表的形式展现,还可以做存储过程和存储过程以及存储过程与数据库表之间的连接。
减少了开发人员的工作量,增加了最终用户使用的友好性。
报表制作的方便性:Cognos 在纯浏览器界面中,提供了基于鼠标拖拽的强大的格式定义能力,其优异的XML可视化报表定义方式,可以使用户非常方便的控制报表中内容的精确布局,也可以很方便的制作中国特色的非平衡报表。
只需要做简单的操作就可以完成穿透钻取,级联提示等功能。
使得最终用户可以自己制作个性化的报表,IT部门从烦杂重复劳动中解脱出来,将精力集中在如何利用数据。
报表内容:Cognos 可以将包括声音、视频、图形、表格、文字、关系行数据库内容、OLAP等任何有用的信息集成在报表中,同时这些内容还可以和查询相关联,使报表的内容声色并茂,内容饱满、充实。
可直接访问OLAP和关系型数据源制作报表支持在图形等内容上进行钻取支持在报表制作过程中使用MDX可直接制作非平衡报表,比如将不同维度或字段的内容在同一行或列展现在报表制作过程中进行查询的连接,交并补关系设置更为方便支持仪表盘功能支持地图报表,并提供例子可在图形中添加基本线,标注等,比如表达式的结果,平均,最大最小,标准偏差等增加了图形的种类,包括:甘特图、水平进度图、饼图、两维图、三维图等穿透钻取:Cognos的各个模块能够紧密集成,能够迅速有效地传递数据流和安全性信息,用户可以从一个主题钻取到另一个主题,其独特的分析后的查询,使用户能够通过OLAP分析再穿透钻取到相关的明细数据,适应了用户的分析和使用习惯,从而能从业务上层次上跟踪发生了什么问题和为什么发生了这样的问题。
高级报表功能:Cognos可以很方便的制作KPI,平衡记分卡,仪表盘等各种高级报表。
6.报表发布Cognos中,所有数据立方体、报表、图表、分析、查询等等对象都可以发布到统一的信息门户中,做到信息集中,为使用者的访问增加便捷。
7.强大的基于Web的分析功能模块Analysis Studio,提供纯浏览器的高级分析功能。
Analysis Studio不仅可以像以前的PowerPlay那样访问OLAP数据源,还可以像PowerPlay那样方式访问通过多维建模的关系型数据源。
8.开放APICognos作为一个企业级的端对端的解决方案,产品本身已经提供了全面完备的功能。
同时Cognos也完全开放API供企业内部不同应用系统的集成和根据用户需求所作的二次开发9.负载均横Cognos产品是为企业级应用精心设计的,具有良好的可扩展性能,其服务器本身就具有智能的负载均衡功能,能根据实际使用情况对各个的模块进行负载,满足企业级大用户数并发访问的要求,需要加入一台新的服务器,通过简单的注册就能加入到整个扩展环境中参与负载;并且支持NT和UNIX混和环境的负载均衡,能最大限度的利用现有资源保护已有投资。
10.对资源的利用Cognos 采用的无状态连接,服务器只有在用户进行动态操作时才会使用,能更有效的使用系统资源,支持更多用户并发。
Cognos采用的是多线程机制,每个用户请求对系统资源的占用少,能最大化资源的利用和用户并发,即使某个用户请求出了问题,不会影响其他请求,系统还能照常运行。
11.事件生命周期管理Event Studio,通过他可以在影响业务的事件发生时对用户进行自动的提醒,你可以通过Agent对事件的条件进行定义,设置处理事件的任务,从而为系统提供全面的监控,对用户进行及时提醒。