高中英语作文之图表类作文写法
高中英语图表作文范文

高中英语图表作文范文在高考中,我们遇到图表类作文的话怎么写?下面是店铺给大家整理的高中英语图表作文范文,供大家参阅!高中英语图表作文范文1受某英文报的委托,你最近对高中生的英语阅读兴趣做了一次调查。
请根据以下信息,用英语为该报写一篇100词左右的短文。
短文的标题及首句已为你写好。
调查内容:在新闻、故事、科普、学习方法四种英文文章中,学生最喜欢哪一种调查范围:湖北省的10所中学调查对象:高中生调查人数:1,000调查方式:访谈调查结果:(见下图)范文:Reading Interests of Senior Middle School StudentsRecently,a survey has been done to find out the reading interests of senior middle school students. In this survey,one thousand senior middle school students from ten schools in Hubei Province were interviewed. They were asked which they liked reading most among the four categories of English articles,news,stories,popular science articles and articles about learning methods.The survey shows that more than half of the students like to read news most. Twentysix percent of the students say that English stories are their favorite. Only seven percent of the students are most interested in reading articles about learning methods. However, the number of students who enjoy reading popular science articles doubles that of those who prefer readingarticles about learning methods.高中英语图表作文范文2最近,你参加了高三年级组织的“你最重视哪科作业”的调查,结果见下面的饼状图。
图表型英语作文模板
图表型英语作文模板篇一:英语作文图表类提纲类作文写作模板第一部分、写作模板——图表式作文It is obvious in the graphic/table that the rate/number/amount of Y has undergone dramatic changes. It has gone up/grown/fallen/dropped considerably in recent years (as X varies). At the point of X1, Y reaches its peak of …(多少).What is the reason for this change? Mainly there are …(多少) reasons behind the situation reflected in the graphic/table. First of all, …(第一个原因). More importantly, …(第二个原因). Most important of all, …(第三个原因).From the above discussions, we have enough reason to predict what will happen in the near future. The trend described in the graphic/table will continue for quite a long time (if necessary measures are not taken括号里的使用于那些不太好的变化趋势).第二部分、写作模板——提纲式作文一、说明原因型模块(一)Nowadays , there are more and more XX in some big cities . It is estimated that ( 1 ). Why have there been so many XX ? Maybe thereasons can be listed as follows.The first one is that ( 2 ) .Besides, ( 3 ) . The third reason is ( 4 ). To sum up , the main cause of XX is due to ( 5 ) .It is high time that something were done upon it. For one thing , ( 6 ). On the other hand , ( 7 ). All these measures will certainly reduce the number of XX .注释:(1)用具体数据说明XX现象;(2)原因一;(3)原因二;(4)原因三(5)指出主要原因;(6)解决建议一;(7)解决建议二。
图表类的英语作文模板
图表类的英语作文模板Title: A Template for Writing English Essays on Graphs and Charts。
Introduction:Graphs and charts are essential tools for presenting data and illustrating trends in various fields. In this essay, we will explore a template for crafting well-structured essays based on graphs and charts.1. Overview of the Graph/Chart:Start by describing the type of graph/chart you are analyzing (e.g., bar graph, line graph, pie chart).Provide a brief summary of the data presented and its source.2. Key Trends or Patterns:Identify and discuss the main trends or patterns depicted in the graph/chart.Highlight any significant fluctuations, peaks, or valleys.3. Comparison and Contrast:If applicable, compare different data sets or elements represented in the graph/chart.Analyze similarities and differences between various categories or groups.4. Causes and Implications:Explore potential factors contributing to the observed trends or patterns.Discuss the implications of these findings on the subject matter or relevant stakeholders.5. Forecasting or Projection:Offer insights into future trends based on the data presented in the graph/chart.Discuss potential outcomes or scenarios that may arise.6. Limitations and Considerations:Acknowledge any limitations or constraintsassociated with the data or methodology used to create the graph/chart.Consider alternative interpretations or perspectives.7. Conclusion:Summarize the main points discussed in the essay.Emphasize the significance of the findings and theirrelevance in the broader context.Example Essay Using the Template:Introduction:The following essay analyzes a bar graph depicting the annual sales revenue of a company over the past five years.Overview of the Graph:The bar graph illustrates the annual sales revenue of XYZ Company from 2019 to 2023. The data is sourced from the company's financial reports.Key Trends or Patterns:The graph reveals a steady increase in sales revenue from 2019 to 2022, with a peak in 2022. However, there was a slight decrease in revenue in 2023 compared to the previous year.Comparison and Contrast:Comparing the sales revenue across the five years, it is evident that the growth rate was highest between 2020 and 2022. Furthermore, there is a notable contrast between the substantial increase in revenue from 2021 to 2022 and the subsequent decline in 2023.Causes and Implications:The significant growth in sales revenue from 2020 to 2022 can be attributed to several factors, including expanded market presence, successful product launches, and strategic partnerships. However, the decline in 2023 may be linked to economic downturns or increased competition. This downturn raises concerns about the company's future profitability and market position.Forecasting or Projection:Based on the trends observed, it is projected that the company may experience continued challenges in maintainingrevenue growth in the coming years. Addressing competitive pressures and adapting to changing market dynamics will be critical for sustained success.Limitations and Considerations:It is important to note that the graph only provides a snapshot of the company's financial performance and does not account for external factors such as macroeconomic trends or industry-specific challenges. Additionally, fluctuations in revenue may be influenced by one-time events or seasonal variations.Conclusion:In conclusion, the analysis of the sales revenue graph highlights both positive and concerning trends for XYZ Company. While the growth trajectory from 2019 to 2022 is promising, the decline in 2023 underscores the need for strategic adjustments and proactive measures to ensure future profitability and competitiveness.This template provides a structured approach to effectively analyze and discuss graphs and charts in English essays. By following these guidelines, you can craft insightful and cohesive essays that demonstrate your understanding of data visualization and its implications.。
英语作文图表作文(五篇范文)

英语作文图表作文(五篇范文)第一篇:英语作文图表作文图表分析作文1As is clearly shown in the table/ figure/ graph / chart, 图表总体描述 between 年代 and 年代.Especially, 突出的数据变化.There are three reasons for 具体表示急剧上升、下降或特殊现象的词.To begin with, 原因一.In addition / Moreover, 原因二.For example, 具体例证.Last but no least, 原因三.In short,总结上文.As far as I am concerned, / For my part, / As for me,作者自己的观点.On the one hand, 理由一.On the other hand, 理由二.In brief,总结上文.图表分析作文2The table / figure / graph / chart shows that 图表总述from 年代to年代.It is self-evident that突出的数据变化.Three possible reasons contribute to 具体表示急剧上升、下降或特殊现象的词或代词代替上文内容.One reason is that原因一.Another reason is that 原因二.For instance,举例证.What’s more原因三.As a result, 重述上文之趋势.However, in my opinion 作者观点.For one thing,理由一.For another, 理由二.T o sum up,总结上文.图表分析作文3It can be seen from the table / figure / graph / chart that图表总述between年代and年代.Especially,突出的数据变化.Why are there such great changes during 图表涉及的年头数years? There are mainly two reasons explaining具体表示急剧上升、下降或特殊现象的词或代词代替上文内容.First,原因一.In the old days,比较法说明过去的情况.But now,说明现在的情况.Second,原因二.As a result,总结上文.In my viewpoint,作者自己的观点.On the one hand,论点一.On the other hand,论点二.图表分析作文4As the table / figure / graph / chart shows,图表总述in the past years年代.Obviously,突出的数据变化.Why are there suchsharp contrasts during 图表涉及的年头 years?Two main factors contribute to具体表示急剧上升、下降或特殊现象的词或代词代替上文内容.First of all,原因一.In the past,比较法说明过去的情况.But now 说明现在的情况.Moreover,原因二.Therefore,总结上文.As I see it,作者自己的观点.For one thing,论点一.For another,论点二.图表作文补充句型• As is shown in the graph…如图所示…•The graph shows that…图表显示…•As can be seen from the table,…从表格中可以看出…•From the chart, we know that…从这张表中,我们可知…• All these data clearly prove the fact that… 所有这些数据明显证明这一事实,即…• The increase of ….In the ci ty has reached to 20%.….在这个城市的增长已达到20%.• In 1985, the number remained the same.1985年,这个数字保持不变.• There was a gradual decline in 1989.1989年,出现了逐渐下降的情况.第二篇:英语图表作文图表描述专题训练(一)这类作文时,注意以下几点:第一,审题时,除了要把握好图表的表层信息外,还要分析图标的深层含义,如原因、根源、可能的发展趋势等。
图表类关于学习的英语作文
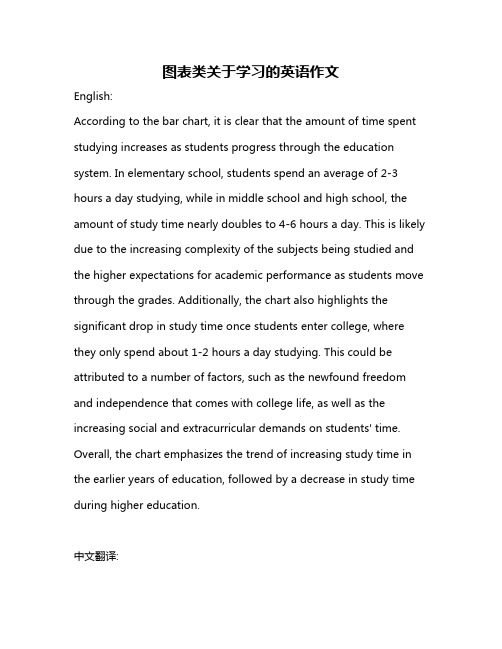
图表类关于学习的英语作文English:According to the bar chart, it is clear that the amount of time spent studying increases as students progress through the education system. In elementary school, students spend an average of 2-3 hours a day studying, while in middle school and high school, the amount of study time nearly doubles to 4-6 hours a day. This is likely due to the increasing complexity of the subjects being studied and the higher expectations for academic performance as students move through the grades. Additionally, the chart also highlights the significant drop in study time once students enter college, where they only spend about 1-2 hours a day studying. This could be attributed to a number of factors, such as the newfound freedom and independence that comes with college life, as well as the increasing social and extracurricular demands on students' time. Overall, the chart emphasizes the trend of increasing study time in the earlier years of education, followed by a decrease in study time during higher education.中文翻译:根据这个柱状图,清楚地显示出随着学生在教育体系中的进展,学习时间的增加。
高中英语作文之图表类作文写法

.
第一段(描述图表,得出结论 )
A number of facts might contribute to this phenomenon. One of the most important reasons can be the development of national economy and the rise of people's living standard, which made it possible for Americans to buy their personal computers.
The number of colour TV sets produced by the factory increased (rose , grew , climbed) from 5000 in 1986 to 21000 in 1990.
.
从表中所给的统计数字可以看出,从1985年到1990年中 国的人均收入迅速提高。 From the statistics given in the table it can be seen that the of average personal income the Chinese people increased (grew 、rose) rapidly from 1985 to 1990.
.
从曲线图可以得出结论,最近5年来中国人口的出生率已 经大大下降。
【写作指导】高中英语图表型作文写作步骤+写作模板+优秀范文!
高中英语图表型作文写作步骤+写作模板+优秀范文!图表型作文通常用图片、表格的方式反映出某一问题、现象或观点,该类作文要求考生首先对图表进行简单表述,然后点题并加以论证说明。
这几年高考英语作文通常以书信类应用文为载体,而不常考的图表型作文反而容易被大家忽略,一旦考到,措手不及,今天小编就为大家分享高中英语图表型作文的写作步骤和写作模板,希望大家仔细阅读记忆。
写作步骤:1.点明图表所反映的主题。
常用词汇:table, chart, figure, graph, describe, tell,show, represent等2.分析数据差异及趋势或者描写数据代表内容。
注意层次。
常用词汇:rise,increase, drop, reduce, decrease, fall, but, on the contrary, however, the same as, be similar to, be different from 等3.归纳总结或发表自己看法。
常用词汇:in a word, in short, to sum up, We candraw the conclusion that ...等。
重点句子:一、引入话题1.It can be seen from the table that….2.As is indicated in the chart,….3.From the sharp rise (上升n.) / decline (下降n.) in the chart, it goes without sayingthat….(不用说……)4.It has gone up(上升) / fallen / dropped(下降) considerably in recent years.二、描述变化或原因1.表示递进what’s more, besides, in addition, furthermore, to make matters worse,what’s worse (更糟糕的是)2.表示解释account for , that is to say, mean, in other words3.表示变化---快速上升rise (increase / go up ) sharply (quickly, rapidly)eg: The number sharply went up.—缓慢下降decrease (reduce/ come down/ decline/ drop/ fall) slowly—表示对比compare with , contrary to, on the contrary4.描述多重原因—There are several reasons behind the situation reflected in the above table.First of all, ……; More importantly,…….; Most importantly,……..;—There are at least two good reasons accounting for this phenomenon. On one hand,…….; On the other hand,………; In addition,…. is responsible for….三、总结或评论1.Personally speaking, in a word, in conclusion,2.It can be concluded that….(可以得出结论)3.From the above discussion, we have enough reasons to predict what will happenin the near future.4.The trend described in the table will continue for quite a long time if necessarymeasures are not taken.5.As far as I’m concerned, I hold the view that…6.I’m sure my opinion is both sound and well-grounded. (既合理又理由充分)写作模版:1.分析图表数字代表内容Ascan be seen from the chart, _____________________(话题).Different people hold different opinions on this matter.Obviously, the majority of the people believe that ______________. However, others (20%) consider that_______________. Besides, another 5% hold the view that_______________.As far as I am concerned, we should pay more attention to __________. On one hand, ________________. On the other hand, __________________.2.分析数字反映的原因As can be seen from the chart, ____________________(话题). Different people hold different opinions. About 60% of the people ____________, while 25% of the people ______________.The least people, accounting for 15%, _______________.Various reasons are responsible for their different choices. To begin with, ___________. What’s more, ______________.Besides, _____________.As far as I am concerned, I am in favor of the view that_____________. I believe that ___________________.或As far as I am concerned, despite such problems, I hold the view that we should ________________. Only in this way can we _______________.图表类作文实战1:下面的图表显示了你们学校高三学生周末放假的学习生活情况。
英语作文图表类 范文
英语作文图表类范文Here is an essay on the given topic of "English Essay Sample with Graphs and Tables" with more than 1000 words, written entirely in English without any additional punctuation marks.Effective Communication through Graphical RepresentationsIn the realm of academic and professional writing, the seamless integration of textual information and graphical elements has become an essential skill. Graphical representations, such as charts, tables, and diagrams, possess the remarkable ability to convey complex data and ideas in a concise and visually appealing manner. By strategically incorporating these visual aids, writers can enhance the clarity, comprehension, and overall impact of their written work.One of the primary advantages of using graphical representations is their ability to organize and present data in a structured and readily understandable format. Tables, for instance, excel at displaying numerical information or categorical data in a clear and systematic manner. They allow readers to quickly compare and contrast different values or characteristics, enabling them to identify patterns, trends, and relationships that may not be immediately apparent in apurely textual format.Similarly, charts and graphs offer a powerful means of visualizing quantitative data. Bar graphs, line charts, and scatter plots can effectively illustrate trends, distributions, and correlations, making complex information more accessible and digestible for the reader. These visual tools can often convey the essence of a dataset more effectively than a dense paragraph of text, allowing the audience to grasp the key insights at a glance.Beyond numerical data, graphical representations can also be employed to simplify and clarify conceptual information. Flowcharts, for example, can be used to map out step-by-step processes or decision-making frameworks, providing a clear and logical flow of information. Venn diagrams, on the other hand, can be instrumental in demonstrating the relationships and overlaps between different concepts or categories.The strategic placement of graphical elements within a written work can also serve to enhance the overall organization and readability of the text. By positioning relevant charts, tables, or diagrams alongside the corresponding textual explanations, writers can create a seamless integration of visual and verbal content, guiding the reader through the information in a logical and intuitive manner.Moreover, the use of graphical representations can help to break up the monotony of dense textual passages, making the written work more visually appealing and engaging for the reader. Carefully selected and well-integrated graphics can serve as visual anchors, directing the reader's attention and aiding in the retention of key information.However, the effective incorporation of graphical elements in writing is not without its challenges. Writers must ensure that the chosen graphics are truly relevant and add value to the content, rather than serving as mere decorative elements. Additionally, it is crucial to maintain consistency in the style, formatting, and labeling of the graphical representations, as this can significantly impact the overall coherence and professionalism of the written work.Furthermore, writers must be mindful of the accessibility considerations when incorporating graphical elements. Ensuring that the graphics are legible, appropriately sized, and accompanied by clear captions or textual descriptions can make the information accessible to a wider range of readers, including those with visual impairments or other accessibility needs.In conclusion, the strategic use of graphical representations in writing can be a powerful tool for enhancing communication and comprehension. By skillfully integrating charts, tables, and othervisual aids, writers can effectively convey complex information, highlight key insights, and engage their audience in a more meaningful and impactful way. As the demand for clear and visually appealing communication continues to grow, the ability to effectively leverage graphical elements in written work will become an increasingly valuable and sought-after skill.。
图表描述类英语作文(4篇)
图表描述类英语作文(4篇)图表描述类英语作文篇一The above bar chart informs us of the phenomenon that there exist some differences in additional working hours among diverse careers, especially between self-employed businessmen and civil servants. Self-employed businessmen spend nearly 2 hours per day in working overtime. On the contrary, civil servants’ additional working hours is the shortest, only less than 50 minutes per day. The overtime of scientific researchers, cultural and sports workers and teachers is 80 minutes, 70 minutes and 55 minutes respectively.Ample reasons can account for this phenomenon. Firstly, to make more profits, self-employed businessmen have to spend more time in manufacturing products, attracting customers, providing after-sale services and managing staff. Moreover, with the competition becoming fiercer, they have no alternative but to work overtime to avoid being eliminated by the market and their rivals. When it comes to civil servants, things have gone otherwise. Confronted with less risks as well as pressures and leading a steady and routine life, they don’t have to work overtime frequently.Working overtime is a two-bladed sword. Surely, it will generate considerable benefits. However, it will give rise to some damages, especially to our health. We should balance our work, life and health or we will eventually become a machine and salve of work.四级英语作文图表类篇二图片模板:It seems to me that the cartoon / drawing issending a message about ____________(图画内容),which reveals ____________(稍作评价).In myperspective of view, ____________ (表明个人观点)。
图表类英语作文范文
图表类英语作文范文图表类型的英语写作如果不擅于观察漫画的话,作文写出来可能会偏题。
下面是小编给大家带来图表类英语作文,供大家参阅!图表类英语作文范文篇 1 第一段:说明图表开篇句:As the bar chart shows, ____ during the years of ____to____.扩展句:1、As early as _____.2、Then _____ years later, ____.3、And arriving in the year ____, ____.第二段:解释图表变化原因主题句:Several factors contribute to _____.扩展句:1、______. 原(因1)2、And ______.(原因2)3、Furthermore, ______ ( 原因3)4、All these result in ____.第三段:提出解决办法结尾句:However, ____ is faced with some problems.扩展句:1、With _____, ____, the effect of which is not only discouraging, but also challenging.2、So my principle is to pay due attention to ___, but notjustto____.示范第一段:说明图表开篇句:As the bar chart shows, the number of people below the poverty line decreased dramatically during the years of 1978 to1997.扩展句:1、As early as 1978, about 250 million people were under the poverty line.2、Then seven years later, the number became three fifthsthatof1978.3、And arriving in the year 1997, the number was reducedto50millions.第二段:解释图表变化原因主题句:Several factors contribute to the sharp decrease ofthe below-poverty population.扩展句:1、The reform and opening following 1978 enabledthe peasants to become much better off. ( 原因1)2、And with the development of Chinese economy, that policy also improved city dwellers lives greatly. ( 原因2)3、Furthermore, the high-tech introduced made it possiblefor the countrys economy as a whole to take off. ( 原因3)4 、All these result in the great fall of theChinesepopulationbelow the poverty line.第三段:提出解决办法结尾句:However, a further decrease in the number of poverty-stricken people is faced with some problems.扩展句:1、With quite few employees being laid off, the effect of which is not only discouraging, but also challenging.2 、So my principle is to pay due attention to the newcomers, but not just to care for the poor, say, in remote mountain areas.范文As the bar chart shows, the number of people below thepoverty line decreased dramatically during the years of 1978to 1997. Asearly as 1978, about 250 million people were underthe poverty line.Then seven years later, the number became three fifths that of 1978.And arriving in the year 1997, the number was reduced to 50 millions.Several factors contribute to the sharp decrease of the below-poverty population. The reform and opening following1978 enabled the peasants to become much better off. And with the development of Chinese economy, that policy also improved city dwellers lives greatly. Furthermore, the high-tech introduced made it possible for the countryseconomy as a whole to take off. All these result in the great fallof the Chinese population below the poverty line.However, a further decrease in the number of poverty-stricken people is faced with some problems. With quite few employees being laid off, the effect of which is notonly discouraging, but also challenging. So my principle is topay due attention to the newcomers, but not just to care forthe poor, say, in remote mountain areas.图表类英语作文范文篇2The past years have witnessed a mounting number of Chinese scholars returning from overseas. As is lively illustrated by the column chart, the number of returnees climbed from a mere 69.3 thousand in 2008 to over 272.9 thousand in 2012, at an annual increase rate of around 50%.A multitude of factors may have led to the tendency revealed by the chart, but the following are the critical ones from my perspective. First and foremost, along with the development of Chinese economy and society, the number ofChinese studying abroad has been soaring in the past years,which has provided an expanding base for the number of returnees. In the second place, the government has enacted aseries of preferential policies to attract overseas Chinesescholars back home. Last but not least, the booming economy, science and technology in this country have generated moreattative job opportunites for scholars returning from overseas.The waves of returnees will definitely contribute to this nation’s development, since they have brought back not only advanced science and technology but also pioneering concepts of education and management. With more scholarscoming back from overseas, and with the concerted efforts ofthe whole nation, we have reasons to expect a faster rejuvenation of this country.图表类英语作文范文篇 3 一、图表类型基本单词图表类型:table( 表格)、chart( 图表)、diagram( 图标)、graph( 多指曲线图) 、column chart( 柱状图) 、pie graph( 饼图) 、tree diagram( 树形图)、饼图:pie chart 、直方图或柱形图:bar chart/histogram 、趋势曲线图:line chart/curve diagram 、表格图:table 、流程图或过程图:flow chart/sequence diagram 、程序图:processing/procedures diagram二、图表描述基本词语1、描述:show 、describe 、illustrate 、can be seen from 、clear 、apparent 、reveal 、represent2、内容:figure 、statistic 、number 、percentage 、proportion三、常用的描述句型The table/chart diagram/graph shows (that)According to the table/chart diagram/graphAs (is) shown in the table/chart diagram/graphAs can be seen from the table/chart/diagram/graph/figures ,figures/statistics shows (that)……It can be seen from the figures/statisticsWe can see from the figures/statisticsIt is clear from the figures/statisticsIt is apparent from the figures/statisticstable/chart/diagram/graph figures (that) ……table/chart/diagram/graph shows/describes/illustrates看过图表类英语范文的人还。
- 1、下载文档前请自行甄别文档内容的完整性,平台不提供额外的编辑、内容补充、找答案等附加服务。
- 2、"仅部分预览"的文档,不可在线预览部分如存在完整性等问题,可反馈申请退款(可完整预览的文档不适用该条件!)。
- 3、如文档侵犯您的权益,请联系客服反馈,我们会尽快为您处理(人工客服工作时间:9:00-18:30)。
从曲线图可以得出结论,最近5年来中国人口的出生率已 经大大下降。
It can be concluded from the graph that there has been a great decline in birth rates in China in the past five years. / …birth rates in China have declined greatly …
图表作文的写作
根据所给图表,简要述 某城市近年每百人手机 用户的增长情况,并试 分析其增长的原因. (2002年上海春考)
图表型作文写作
第一部分:图表描述;
概要描述图表所揭示的某种社会现象的变化发展情况, 注意尽可能少的直接引用图表数据,要将图表数据进行 分析,归纳后进行概括性综述。
பைடு நூலகம்
第二部分:原因或根源;
In addition, since people paid much attention to the efficiency of work, the computer, as a good helper, was in great need. What's more, with science and technology improved, the quality of computers became better while the price of it became lower, this attracted more people to buy the computers. The future for the computer is very promising. Maybe some day it will truly be the personal computer.
in the table, graph picture pie chart significantly dramatically steadily
第二段(分析原因)
There are at least two good reasons accounting for __. On the one hand, __ is due to the fact that __. On the other hand, __ is responsible for __.
阐述导致该现象发展变化的深层次原因。
第三部分:结论或评述。
对该现象发展变化进行理性预测或利弊评述, 也可阐述本人的看法或观点。
The chart above indicates that the number of mobile phones has increased in the city in recent years. Between 1995 and 1999 the number of mobile phone users increased by 10 percent each year. In 2001, the number almost doubled. The reasons for the increase can be various. First, a mobile phone is convenient for people especially business people. Because of its small size, light weight and portability, you needn’t go to a phone booth to make a telephone call. One user says, “With a mobile phone, I can make a phone call to do business without worrying about time and space. This saves me time and trouble.
第一段(描述图表,得出结论 )
As is shown by the figures percentage indicated numbers illustrated
___ has been increasing on the rise rising decreasing going up dropping decreasing from__ in __ to __ in __. From the sharp decline/ rise in the chart, it goes without saying that __. it can be concluded that
参加者的人数增加到30万。
The number of the participants grew up to 300000 persons / increased , reaching 300000 persons).
这个工厂生产的彩电已由1986年的5000台增加到 1990年的21000台。
The number of colour TV sets produced by the factory increased (rose , grew , climbed) from 5000 in 1986 to 21000 in 1990.
从表中所给的统计数字可以看出,从1985年到1990年中 国的人均收入迅速提高。 From the statistics given in the table it can be seen that the of average personal income the Chinese people increased (grew 、rose) rapidly from 1985 to 1990.
第三段(个人观点)
As far as I am concerned/ I hold the point of view that __. For one thing, ___.For the other, ___.
这个学校的教师人数已减少到700人。 The number of teaching staff members in this school has decreased to 700 persons.
Write an English composition in about 150 words, according to the topic given in Chinese. 根据所给图表,简要描述某城市家庭电脑的增长情况, 并试分析其增长原因。
According to the chart, the number of American households owning a personal computer has increased tremendously. In 1980, only 0.2 percent of American households owned a personal computer; however, during the later years of the decade, the proportion of the owners have dramatically increased. A number of facts might contribute to this phenomenon. One of the most important reasons can be the development of national economy and the rise of people's living standard, which made it possible for Americans to buy their personal computers.
Besides, mobile phones are finding their way into ordinary families. Mobile phone lovers talk with their friends, family members whenever they like. Of course, there are some other people buying mobile phones merely to follow the fashion or show their position in society. Whatever reason it may be, I think the increase will continue into the future because they can make our life convenient and the world smaller.