2011白糖市场走势分析
分析白糖短期趋势的方法

分析白糖短期趋势的方法分析白糖短期趋势的方法可以从基本面和技术面两个方面来进行。
首先是基本面分析。
基本面包括供需关系、季节因素、政策因素、国际市场等多方面因素的综合分析。
对于白糖市场来说,以下几个因素需要特别关注:1. 供需关系:供需关系是决定商品价格的重要因素之一。
关注白糖的产量、进口量、消费量等数据,分析供求关系的平衡程度,以及未来的走势。
如白糖产量增加但需求下滑,则价格可能会受到压制。
2. 季节因素:白糖市场受到季节因素的影响较为明显。
例如,在中国北方,春节前的购糖需求往往十分旺盛,而农历七月是胡同鼓锣月,有特别购买糖的风俗,这些因素都可能对短期的白糖价格产生影响。
3. 政策因素:政府的市场政策和税收政策也会对白糖价格产生重要影响。
政策的变化可能导致市场供求关系出现调整,从而影响到短期价格的变化。
4. 国际市场:白糖是一种国际化的商品,在国际市场上的走势也会对短期价格产生影响。
关注国际市场上主要原产地的糖价走势、糖料价格的变化以及国际贸易限制等因素,可以为短期趋势的分析提供线索。
其次是技术面分析。
技术面分析主要基于市场历史数据进行,通过图表和指标等分析方法,来识别价格走势和市场情绪的转变。
以下是一些常用的技术指标和方法:1. K线图分析:通过绘制K线图,观察开盘价、收盘价、最高价和最低价之间的关系,分析价格走势的趋势和周期。
例如,如果一段时间内连续出现阳线,可能意味着价格上升的趋势。
2. 成交量分析:成交量是市场活动的重要指标,也是技术分析中的关键因素之一。
观察成交量的大小和变化,可以判断市场参与者的意愿和力量,进而预测未来价格的走势。
3. 移动平均线:移动平均线是一种平滑价格曲线的指标,通过计算一段时间内的均价来削除噪声信号。
观察短期和长期移动平均线的交叉情况,可以判断价格的转折点和趋势的变化。
4. 相对强弱指标(RSI):RSI指标可以帮助分析价格的超买和超卖情况,判断市场情绪和价格走势的可能转折点。
《白糖市场分析》
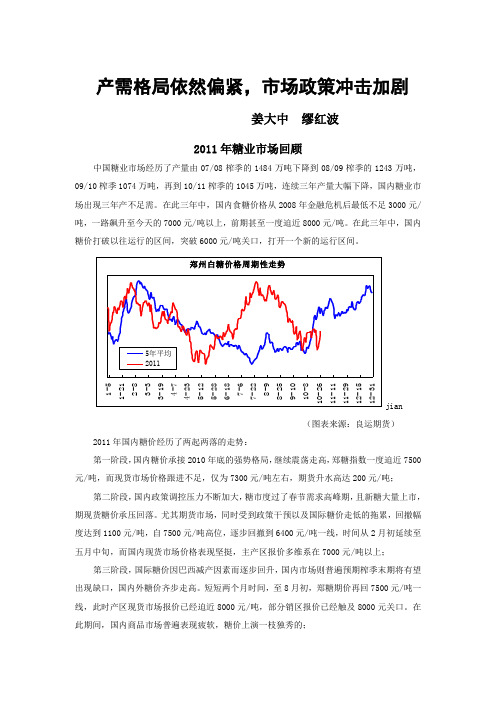
产需格局依然偏紧,市场政策冲击加剧姜大中缪红波2011年糖业市场回顾中国糖业市场经历了产量由07/08榨季的1484万吨下降到08/09榨季的1243万吨,09/10榨季1074万吨,再到10/11榨季的1045万吨,连续三年产量大幅下降,国内糖业市场出现三年产不足需。
在此三年中,国内食糖价格从2008年金融危机后最低不足3000元/吨,一路飙升至今天的7000元/吨以上,前期甚至一度迫近8000元/吨。
在此三年中,国内糖价打破以往运行的区间,突破6000元/吨关口,打开一个新的运行区间。
jian(图表来源:良运期货)2011年国内糖价经历了两起两落的走势:第一阶段,国内糖价承接2010年底的强势格局,继续震荡走高,郑糖指数一度迫近7500元/吨,而现货市场价格跟进不足,仅为7300元/吨左右,期货升水高达200元/吨;第二阶段,国内政策调控压力不断加大,糖市度过了春节需求高峰期,且新糖大量上市,期现货糖价承压回落。
尤其期货市场,同时受到政策干预以及国际糖价走低的拖累,回撤幅度达到1100元/吨,自7500元/吨高位,逐步回撤到6400元/吨一线,时间从2月初延续至五月中旬,而国内现货市场价格表现坚挺,主产区报价多维系在7000元/吨以上;第三阶段,国际糖价因巴西减产因素而逐步回升,国内市场则普遍预期榨季末期将有望出现缺口,国内外糖价齐步走高。
短短两个月时间,至8月初,郑糖期价再回7500元/吨一线,此时产区现货市场报价已经迫近8000元/吨,部分销区报价已经触及8000元关口。
在此期间,国内商品市场普遍表现疲软,糖价上演一枝独秀的;第四阶段,国内政策调控压力不断增大,欧元区债务危机反复迸发,拖累商品市场整体走低,同时国储糖抛售频率加快,国内糖价再度承压回落。
至10月初,郑糖期价回落至6500元/吨附近,回撤1000元/吨,现货市场则回落至7300元/吨附近。
2011年初至今,国内糖价延续了高位的宽幅震荡,反复确认对历史区间的突破。
2011年度白糖投资策略

2011年度白糖投资策略--把握两次波段机会2010年,国内外糖市大幅上涨,创出历史新高。
展望2011年,这种趋势究竟是继续延续,还是会转势向下?2011年是产量周期的临界点,同时面临整体通货膨胀走势的不确定性,影响因素错综复杂,本文就此对2011年的走势展开深入分析。
一、成本提高推升价格重心上移,白糖价值面临重估伴随着国家经济的发展,物价上涨已经成为难以扭转的趋势,通货膨胀不再只是预期,而是既成的事实。
尽管国家极力出台控制物价上涨的政策,并且短期内对物价的上涨形成一定的抑制,但是放眼长远,商品价格的螺旋式上涨明显加速,价格重心上移的速度加快,白糖价格同样如此。
而整体物价的上涨又导致白糖成本增加,如此循环导致糖价进一步上行,白糖价值面临重估。
甘蔗收购价作为白糖成本中最重要的一块,对糖价的走势影响较大。
新榨季广西甘蔗收购价出现了大幅提高,并且联动的糖价也相对提高,将2010/2011榨季普通糖料蔗收购首付价由上榨季的260元/吨提高到350元/吨。
每吨普通糖料蔗收购价格350元与每吨一级白砂糖平均含税销售价格4800元挂钩联动,挂钩联动价系数值维持6%不变。
本次大幅提高收购价近90元/吨,则吨糖成本大致提高650元/吨左右。
假如上榨季均价在5000,如果新榨季均价维持在7000,则二次结算的吨糖成本又将提高450元/吨,最终吨糖成本提高约1100元/吨。
成本有望提高到5000附近,将成为糖价的强力支撑。
随着甘蔗收购价再上一个新台阶,新榨季糖价价格重心大幅提高已成难以扭转的事实。
2010年以来CPI持续上升,物价上涨呈现加速的迹象。
随着工业化、城镇化进程加速,农产品生产三大“基础成本”——生产资料、劳动力和土地价格刚性上涨渐成常态,长期被低估的农产品面临价值重估,需要通过涨价回归价值。
在这种趋势下,前期被严重低估的白糖价格近两年来大幅上涨,2010年更是创出历史新高,但是面对生产资料和劳动力成本的大幅上涨,以及周边商品价格的汹涌涨价浪潮,白糖的相对价格反而降低,造成低估。
白糖市场分析报告综述

白糖市场分析报告综述
白糖是发展日益成熟的一种农业产品,受到全球各地消费者的青睐。
以下是对白糖市场的分析报告,以及白糖业内人士在市场发展上的共同建议。
在全球市场上,白糖是一种非常受欢迎的农产品。
通过对全球白糖市
场的调研发现,世界各国白糖的需求量不断增加,主要消费国为美国、加
拿大、欧洲等地,总体需求量仍然保持着持续上升态势。
究其原因,白糖所具备的高营养价值、短期贮藏性以及灵活使用性是
其受欢迎的主要原因。
另外,人们正在开始关注健康和美容,白糖的使用
也被广泛应用到人们日常的饮食、美容等领域,更加提升了其使用价值。
值得一提的是,由于白糖的营养价值随着需求的增加而日益凸显,其价格
也在逐步上涨,预计在未来几年会有非常大的提高。
在分析市场发展情况的基础上,业内专家分析了当前白糖市场的几个
重点领域,并提出了几条具体建议:
首先,应优化白糖生产管理,提升白糖的高品质、绿色、免污染、可
持续发展等性能,以满足现代消费者的需求。
其次,要加强白糖生产管理、提升产品质量,开发新糖种,增强竞争力。
另外,要建立合理的销售模式,根据不同消费者的需求推出多种糖品。
2011上半年食糖市场分析
2011上半年食糖市场分析徐雪【摘要】对2011上半年国内外食糖生产、供求走势进行了回顾,对糖料生产成本和食糖价格走势的成因进行了剖析,并对下半年食糖供求和价格形势进行了预测.【期刊名称】《中国糖料》【年(卷),期】2011(000)004【总页数】2页(P59-60)【关键词】食糖;供求走势;分析【作者】徐雪【作者单位】农业部农村经济研究中心,北京100810【正文语种】中文【中图分类】S566.3截止到2010/2011榨季,我国已连续3年食糖减产,供给形势日益严峻。
2011上半年我国食糖价格基本在7000元/t上下窄幅波动。
预计下榨季食糖产量基本持平或小幅增长,在供求矛盾不断凸显的背景下,预计后期糖价还有继续攀升的可能性。
1 食糖连续三年减产,供求缺口不断加大2010/2011榨季的制糖工作已于2011年5月30日全部结束,至此本榨季进入食糖纯销售期。
2010/2011榨季食糖总产量1045.42万t,比上一榨季减产28.41万t。
其中,甘蔗糖产量966.04万t(上榨季1013.83万t);甜菜糖产量79.38万t(上榨季60万t)。
总体来看,我国甘蔗产区普遍减产,甜菜产区均出现小幅增长。
2010/2011榨季已是我国第三个年头食糖产量连续下滑,接近2003/2004榨季的食糖产量。
在不断攀升的食糖消费下,我国食糖产需缺口持续拉大,缺口量上升到300万t左右。
食糖产量下降主要受到去年异常天气影响,特别是冬季广西出现持续低温阴雨寡照天气,影响甘蔗糖分积累,加上较为严重的霜冻,甘蔗出糖率下降,食糖产量低于预期。
为了保障供应,2010/2011榨季国家已分5次投放国储糖101.98万t。
截止到4月底,我国净进口食糖59.3万t。
如此计算,目前我国食糖市场仍存在140万t左右的缺口,需要在榨季后期继续通过进口和抛售国储糖来弥补供求缺口。
2 榨季初国内糖价大幅上扬,后期在高位平稳运行受不断加大的供求缺口以及通胀因素的推动,近3个榨季我国食糖价格连续上涨(图1),尤其是2009/2010榨季和2010/2011榨季上涨迅猛,这在我国历史上尚属首次。
2011年白糖基本面(时时更新)

2011年白糖基本面(时时更新)国内方面1-5月份全国制糖行业累计产销率67% 。
1-5月,全国制糖行业累计产销率为67.3%,高于去年同期近1个百分点。
其中几大主产区累计产销率:广东100%,云南51.4%,两省产销率均高于去年同期;广西57.8%,低于去年同期近6个百分点;海南43.8%,低于去年同期近19个百分点;北方主产区:新疆、黑龙江、内蒙古等产销率分别为286.5% 、143.6%和 110.8%。
商务部,财政部公告将于7月6日,投放第六批国储糖,数量25万吨。
国内6月销量即将公布,数据预期利多,且目前乃消费旺季之初,后市需求更令人期待,郑糖短期走势料将震荡向上。
从福建省糖业协会了解到,6月福建食糖无销售,截至6月底累计销糖率约27.52%。
目前福建省食糖价格在7200元/吨左右。
国际方面巴西:巴西Williams船务公司称,截至6月29日当周,巴西港口待装糖船数量由上周的52艘大幅增至75艘,计划未来一个月内装运出口的食糖数量由上周的185万吨增至271万吨。
中主要港口桑特斯港的待装糖船由上周的38艘增至59艘,待装运的食糖数量由上周的中143万吨增至227万吨;南部的Paranagua港口糖船数量由上周的14艘增至15艘,等发运量由上周的41.78万吨增至42.46万吨。
Maceio港等装运量为1万吨。
据巴西甘蔗行业协会(UNICA)统计,今年6月下半月中南部地区的糖产量总计为199万吨,较上年同期减少14%。
数据进一步强化市场预期,即2011/2012年度中南部甘蔗压榨量低于官方预估的5.685万吨基本已成定局。
美国:美国2011年产糖作物(甘蔗和甜菜)的播种面积预期为123.75万英亩,高于3月预估的118.71万英亩。
美国2010年产糖作物的播种面积为117.14万英亩。
印度:食品部官员K.V. Thomas表示,如果后期价格维持稳定,印度或考虑出口更多的食糖。
道琼斯报道,印度农业部官员称,如果国内糖价维持稳定,政府或将考虑继续增加食糖出口配额。
白糖基本面分析

一、国际糖市与进出口1、国际糖价:国际原糖糖价维持在22-23美分,进口到国内市场销售的成本目前为6000-6200元/吨左右。
2、进口方面:据中国海关统计机构提供的数据显示,中国11月份进口食糖418,392吨,较10月份增加8.14万吨,同比2010年11月份大幅增加39.54万吨,同比增17倍之多。
11月份我国食糖平均进口价格为634.57美元/吨(上月为652.7美元/吨)。
1-11月我国累计进口食糖达242.49万吨。
下半年国际糖价30-22美分,中国一直保持30-40万吨的进口,进口量巨大。
11月份我国食糖进口数量排行前五的国家分别是巴西(390,244吨)、韩国(20,840吨)、马来西亚(3,448吨)、泰国(2,096吨)、澳大利亚(1,412吨)。
3、出口方面:据海关数据统计,2011年11月我国出口食糖4,294吨(其中主要出口至香港2,618吨),平均出口价格866.79美元/吨(上月为945.96美元/吨),2011年1~11月,我国累计出口食糖55,400吨,较去年同期下降37.71%。
4、美元回流、欧债危机不断加重,导致全球商品价格下跌以及全球食糖阶段性的供应压力,对于糖价下跌发挥了重要的作用。
虽然市场曾寄希望于7000元/吨的联动价格支撑,但是在进口价格进一步下跌的带动下,旧糖的压价销售最终导致了期货价格的下跌。
进口糖价不断下滑,目前已跌至6100元/吨左右。
在进口糖价大幅度偏离7000元/吨的市场心理防线之后,进口量不断加大,使得市场买方变得越来越谨慎。
市场原本以为2010/11榨季末市场可能只有50万吨以下的商业性库存,但实际数据明显超出预期;而9月下旬以来进口糖价格持续低于6500元/吨,特别是11月下旬进口价格下滑至5700元/吨以下。
目前,南宁市场旧糖报价下跌至6700元/吨左右、新糖价格甚至有跌破6600元/吨的情况存在,在制糖企业依然存在18%左右的利润空间背景下,市场看空的气氛还在持续增加。
白糖行业分析

• 2010年下半年以来,糖价与淀粉糖价差拉 开,远远超过替代价格边界 • 目前以果糖为代表的淀粉糖替代品开始盛 行,果糖产能在年底将超过300万吨,加上 葡萄糖粉,麦芽糖浆等的替代,2010/11年 度淀粉糖抢占的市场份额预期有230万吨 • 虽然2010/11年度整个甜味剂市场规模预计 将达到1500万吨,但食糖的消费量预期只 有1270万吨
另一个使我国大量进口白糖的原 因
下表为2011/12年度巴西、泰国及澳大利亚制糖成本不国内制糖成本的对比,可 以很明显的看出,在原料成本及国内政策支持方面,我国制糖行业处于明显的劣 势。 分项 巴西 泰国 2080-2310 1680-1810 100-500 标准流通糖, 品质不如澳大 利亚鱼巴西 澳大利亚 1900-2100 1600-1700 300-400 以品质优良馨 称,为日本韩 国等对品质要 求较高的国家 所含钟爱 中国境内 4380-4690 3920-4160 400-550 一级白砂糖, 与国际耕地质 量标准相当。 多用硫化法生 产,含硫高 生产成本(元/ 1963-2244 顿) 其中:原料成 本 其中:加工成 本 产品质量 1513-1894 350-450 标准流通糖, 原糖制造工艺 领先
国内政策支持 (补贴)
糖醇联动能力 强,有效对冲 价格风险,但 基本无政府直 接补贴。
生产配额管理, 生产配额管理, 蔗区甘蔗指导 高额进口关税, 严格控制内销 价,糖料直补 甘蔗和食糖基 和外销比例, 政策酝酿中, 金必要时出手 基本无补贴 但基本无政府 扶持蔗农。 补贴。进口关 税+配额控制 外糖冲击
以上原因导致白糖库存消费比反 转,远期糖价承压
到此为止,谢谢!
- 1、下载文档前请自行甄别文档内容的完整性,平台不提供额外的编辑、内容补充、找答案等附加服务。
- 2、"仅部分预览"的文档,不可在线预览部分如存在完整性等问题,可反馈申请退款(可完整预览的文档不适用该条件!)。
- 3、如文档侵犯您的权益,请联系客服反馈,我们会尽快为您处理(人工客服工作时间:9:00-18:30)。
Sugar BulletinInsideSugar crop plantings for 2011/12 and their implications for the marketJune 2011White Premium Rockets UpwardsAfter falling sharply in April, raw sugar prices stabilised during May and are now trading in a range of 20-23 cents/lb. While the slow pace of the Brazilian harvest, combined with the growing line up of vessels at Centre/South ports, is supporting prices nearby, the prospect of a large surplus in 2011/12 is beginning to loom over the market. However, this surplus is still some way off and it remains to be seen if the weather will intervene as it did in 2010. As a result, the market structure remains broadly flat, with little difference between nearby prices and those 18 months out. Nearby raw sugar prices are currently trading at 22-23 cents/lb, around the same level as one month ago (Diagram 1). Meanwhile, the white premium has finally rocketed upwards, reaching close to $170/mt basis July/August futures (Diagram 2 and 3). Until recently, the white premium had been trading at very low levels for most of 2011. A powerful combination of high raw sugar prices, a steeply inverted market and weak demand for whites resulted in the white premium falling into negative territory on a pol-adjusted basis during some periods. Many refiners responded to this situation by cutting their losses and ceasing operations for much of the last few months. Of course, this situation could not be sustained forever, and it was widely anticipated that the white premium would recover in the second quarter. However, the premium has risen in spectacular fashion, making destination refining not only viable but extremely attractive in the near term.The white premium has been supported by improved demand, with many northern hemisphere countries having finished harvesting their domestic crops and now turning to imports, in some cases in anticipation of the Ramadan festival. However, near term prospects are supported not only by the re-emergence of demand, but also by the realisation that Thailand, a major origin producer of whites, will concentrate on raw sugar this year.The huge size of the Thai crop this year has increased significantly the country’s export availability, with around 7.0 mn mt rv available for export from the 2010/11 crop. However, the market conditions that prevailed during theDiagram 1: Raw sugar futures prices20.020.521.021.522.022.523.023.524.0Jul-11Oct-11Mar-12U S c e n t s /l b Current1 month ago6 months agoFuturesNote: Current prices are an average of the five trading days priorto publication. Other prices are for the corresponding period one month and six months ago.Table 1: Supply/demand balance (million tonnes, centrifugal sugar, raw value)2007 2008 2009 2010 2010 2011 2011 12 monthsTotal Total Total Oct-Dec Total Jan-Mar Apr-Jun to Jun 2011 World Production 164.7 162.6 152.5 56.8 158.3 51.4 24.1 164.6 World Consumption 156.7 159.2 160.7 41.2 163.1 40.2 41.3 163.0 Apparent Change in Stocks 8.1 3.4 -8.2 15.7 -4.8 11.2 -17.2 1.6 Statistical Adjustment -1.5 -3.2 -1.9 -0.1 -0.4 -0.9 -0.9 -2.1 Actual Change in Stocks 6.6 0.2 -10.1 15.5 -5.2 10.3 -18.1 -0.5 Total Stocks at End-Period 79.8 80.0 70.0 64.8 64.7 75.0 56.9 56.9 LMC Index of World Sugar Stocks 1.44 1.43 1.16 1.04 1.04 0.93 1.01 1.01 (Seasonally Adjusted)New York No 11 (in $/mt) 218.2 266.7 396.4 639.5 491.1 672.5 520.2 572.8 London No 5 (in $/mt) 309.4 351.5 486.2 728.3 616.2 751.0 644.1 679.1'True' White Premium (in $/mt) 66.4 56.6 50.9 30.5 75.8 18.4 72.4 52.0Notes: 1: The LMC Index of World Sugar Stocks takes the value 1.00 at end-September 1980. LMC has calculated the seasonal adjustment that is required to bring each month's index of the stock:consumption ratio to the same base.2: The 'True' White Premium is derived by deducting the value of the pol adjustment in refining.3: The prices cover the period up to the last completed month prior to publication.Sources: ISO Statistical Bulletin; US Dept of Agriculture; FIRS; F O Licht; LMC estimates.Table 2: Sugar production (million tonnes, centrifugal sugar, raw value)2007 2008 2009 2010 2010 2011 2011 12 monthsTotal Total Total Oct-Dec Total Jan-Mar Apr-Jun to Jun 2011 Total Africa 9.9 9.7 10.0 2.8 10.4 1.4 2.6 10.4 Cuba 1.2 1.4 1.4 0.0 1.1 0.8 0.3 1.1 Total C. America 12.2 12.1 11.7 1.9 11.6 6.8 3.1 11.8 USA 7.6 7.2 7.0 2.9 7.3 2.9 0.8 7.3 Total N. America 7.7 7.2 7.1 2.9 7.3 2.9 0.8 7.3 Brazil 33.1 33.6 35.7 9.8 41.2 2.0 10.0 38.6 Total S. America 40.9 41.2 43.8 11.4 48.4 3.1 11.4 46.0 India 29.1 25.9 15.7 8.3 22.2 14.8 2.6 26.2 Total Asia 63.4 63.0 49.2 16.9 52.2 36.2 5.9 60.8 Total Oceania 4.9 4.9 4.7 1.2 3.8 0.0 0.2 3.8 EU 16.8 15.3 16.9 12.5 15.7 0.6 0.1 15.6 Total Europe 25.8 24.5 26.1 19.8 24.7 1.0 0.1 24.4 World Total 164.7 162.6 152.5 56.8 158.3 51.4 24.1 164.6Sources: ISO Statistical Bulletin; US Dept. of Agriculture: FIRS; F.O. Licht; LMC estimates.Page 2 © LMC International Ltd, 2011 Sugar Bulletin: June 2011Sugar Bulletin: June 2011 © LMC International Ltd, 2011 Page 3Table 3: Sugar consumption (million tonnes, centrifugal sugar, raw value)2007 2008 2009 201020102011 2011 12 monthsTotal Total Total Oct-Dec Total Jan-MarApr-Jun to Jun 2011Total Africa 15.1 15.8 16.0 4.2 16.2 3.9 4.0 16.3 Total C. America 8.8 8.7 8.6 1.9 8.1 2.0 2.1 8.1 USA9.3 9.7 9.7 2.5 10.1 2.4 2.5 10.1 Total N. America 10.7 11.0 11.2 2.8 11.5 2.7 2.9 11.5 Brazil11.5 11.8 12.6 3.0 12.1 3.1 3.4 12.5 Total S. America 19.0 19.4 20.3 5.0 19.8 4.8 5.4 20.4 India 23.0 23.6 24.6 5.6 24.6 5.9 6.1 23.8 Total Asia 69.9 71.5 72.7 17.8 74.0 19.3 18.9 73.3 Total Oceania 1.4 1.4 1.4 0.4 1.4 0.3 0.4 1.5 EU18.6 18.8 18.6 5.2 18.7 4.2 4.8 18.7 Total Europe 31.6 31.4 30.5 9.0 32.0 7.1 7.8 32.0 World Total156.7159.2160.741.2163.140.241.3163.0Sources: ISO Statistical Bulletin; US Dept. of Agriculture: FIRS; F.O. Licht; LMC estimates.Diagram 2: World white premium 708090100110120130140150160170Mar-11Apr-11May-11Jun-11U S $/t o n n e (t e l q u e l )May/May 2011August/July 2011October/October 2011Diagram 3: World raw and white sugar futuresprices450500550600650700750800Mar-11Apr-11May-11Jun-11U S $/t o n n eNo. 5 May-11No. 5 Aug-11No. 11 May-11No. 11 July-11peak harvest period (i.e., high raw sugar pricesand low white premium), as well as the desire among millers to produce sugar as quickly as possible to take advantage of high prices, means that this year’s output has been heavily biased towards raw sugar. At the end of May, milling statistics indicate that only around 43% of the crop has been produced as white or refined sugar, compared to 55-60% in normal years. Moreover, the re-melt programme, while underway, is expected to be unspectacular, despite the very favourable market signals, because Thai millers have already contracted large quantities of raw sugar for export.One of the reasons for the strong demand for Thai raws has been the slow start to the Brazilian harvest. This has limited the availability of raw sugar for export. It also means that white sugar produced in the early part of the season has been directed to the domestic market, where, until recently, returns have been more favourable (Diagram 5). This has added further to nearby tightness in the whites market.Page 4 © LMC International Ltd, 2011 Sugar Bulletin: June 2011Diagram 4: Indian domestic price vs. the No.5550600650700750800Mar-11Apr-11May-11Jun-11U S $/t o n n eDomestic Price (Delhi warehouse)No.5 nearby futuresDiagram 5: Ex-mill returns from bulk/baggedsugar exports and domestic sugar in Brazil 400450500550600650700750800Mar-11Apr-11May-11Jun-11U S $/t o n n eBulk exportsBagged exportsDomesticDiagram 6: Brazil: Ex-mill returns fromdomestic sugar, export sugar and ethanol350400450500550600650700750800Mar-11Apr-11May-11Jun-11U S $/t o n n e Domestic sugar Export sugar (bulk)Hydrous ethanol (VHP equivalent)By May 16th , Centre/South Brazil had only crushed 56.6 mn mt of cane, 40% down on lastyear, while sugar and ethanol production were approximately half the levels produced last year.The slow start to the season was widely anticipated and has already been priced into themarket. Nevertheless, it has still resulted in a build up of vessels at Brazilian ports, with the situation looking very similar to last year. However, the reason for the line-up this year is that ships are waiting for sugar to arrive at the ports. The current line-up totals over 50 vessels. Constraints at Brazilian ports, together with any negative news about the progress of this year’s harvest, should continue to support sugar prices in the near term. However, the prospect of alarge global surplus in 2011/12 (Oct/Sept) is starting to loom over the market, with news ofplantings, which take place in the first quarter in most countries, beginning to emerge. In Russia, despite a slow start to the planting season, the Russian Sugar Producer’s Association has announced that plantings have surpassed the target of 1.2 mn hectares. By the end of May, a total of 1.23 mn hectares had been planted and, assuming normal weather conditions and yields, a record beet crop is certainly on the cards. Other beet producing countries, most notably the EU, have also been expanding planted area.In India, initial industry estimates point to an increase in cane area of between 7-10%, increasing national area to around 5.3-5.4 mn hectares. Furthermore, latest meteorological reports point towards a normal monsoon this year, which should mean improved yields over2010/11, when recovery rates where hit by laterains. This means that sugar output in the region of 27 mn mt wv could be achievable. With the cassava crop still badly affected by pestproblems, Thai farmers are expected to stick with cane for another season. Reports suggest that, given good weather conditions, the cane crop could even exceed this year, reaching as much as 100 mn mt. In theory, these increases in beet and cane areashould translate into much greater global sugarproduction in 2011/12. Indeed, our forecasts indicate a significant surplus of as much as eight million tonnes. While many other analysts haveproduced similar forecasts, for the moment, this is not being reflected in forward futures prices,which have continued to trade at a similar level to nearby values over the last month. This reflects the uncertainty about what the weatherSugar Bulletin: June 2011 © LMC International Ltd, 2011 Page 5Sugar by-products and ethanolDiagram 7: No. 11 commitments of tradersvs. nearby sugar pricesJul-10Sep-10Nov-10Jan-11Mar-11May-1112141618202224262830323436World sugar price (US cents/lb)Net speculative position No 11 nearby futures priceN e t s p e c u l a t i v e p o s i t i o n (000 c o n t r a c t s )will hold over the next few months. The experience of 2010/11 is still fresh in many people’s minds, when expectations of a large surplus were gradually eroded as weather events around the world took their toll on sugar crops. These problems only began in the summer months, when news emerged about the drought in Russia. Indeed, while the current drought in E urope is not thought to have affected the beet crop so far, if it continues it will undoubtedly have an adverse effect. This suggests that the prospect of a surplus may only be reflected in prices in later in the year when the Brazilian crop is in full flow and there is greater confidence about the prospect of a production surplus next season.If a large surplus is realised, this will take the pressure off Brazil to continue maximising its sugar output. This is good news for consumers, particularly given that the dramatic slowdown in the expansion of cane area in Brazil means that any increase in production would have to come at the expense of ethanol. The arrival of new crop ethanol onto the market has pushed ethanol prices down to 20-21 cents/lb, ICE No.11 equivalent, which is around the level we expect them to average over the course of the season. If a large surplus looks likely, it should mean that sugar prices could be pushed below this level later in the year. However, any problems with the progress of Brazil’s harvest will make it harder for prices to be pushed below this support level.MolassesThe US Gulf Blackstrap molasses price rose slightly over the last month reaching $176/mt in May. Meanwhile, EU cane molasses prices fell by $2/mt to $229/mt, while South Korean cane molasses prices also declined marginally to $187/mt (Diagram 8). Rising corn prices mean that molasses continues to look cheap as an input for animal feed. This is illustrated by Diagram 9, which compares corn and molasses prices. On a molasses equivalent basis, corn is now almost 20% more expensive than molasses. Corn prices have been supported by unfavourable weather, which has delayed US corn sowing. The USDA’s acreage report, which will provide clearer details on corn area, is due at the end of June. This will provide the next signal for the future direction of corn prices. EthanolIn the US, gasoline prices dipped in May and now stand at US$0.80/lt. This is in contrast to ethanol prices, which have remained steady ataround $0.70/lt narrowing blenders margins. In the international market, high prices in Brazil have resulted in a diversion of surplus US ethanol from the E U to Brazil. However, this trade is likely to be short-lived as Brazilian prices are falling quickly. Moreover, although US output has rebounded after the decline in production during April, tight corn stocks remain a threat to producers’ margins.Diagram 8: Molasses prices in key markets100125150175200225250Apr-09Sep-09Feb-10Jul-10Dec-10May-11U S $/t o n n eUS Blackstrap f.o.b. Gulf EU Cane c.i.f. Amsterdam EU Beet c.i.f. AmsterdamSouth Korea (Cane) c.i.f.Page 6 © LMC International Ltd, 2011 Sugar Bulletin: June 2011Table 4: Sugar by-products and ethanol prices2007 2008 2009 2010 2010 20102011 2011Average Average Average Jul-Sep Oct-Dec Average Jan-Mar Apr-Jun US Cane Molasses, Gulf ($/mt) 122.7 147.5 174.7 167.3 168.7 169.9 169.8 174.8 US Molasses:Maize Price Ratio 0.85 0.78 1.18 1.05 0.78 1.07 0.66 0.62 EU Molasses, Amsterdam ($/mt) 147.1 194.1 206.4 196.0 210.4 202.0 217.2 223.7 EU Molasses:Barley Price Ratio 0.60 0.82 1.37 0.90 0.80 1.13 0.77 0.80 EU Cane Molasses Import Levy/Tariff 0.00 0.00 0.00 0.00 0.00 0.000.000.0 (Euro/mt)US Beet Pulp, Los Angeles ($/mt) 140.1 185.4 129.7 126.8 139.3 128.6 173.0 215.3 EU Beet Pulp, Rotterdam ($/mt) 269.6 286.2 148.7 202.1 263.2 190.1 323.9 224.7 US Ethanol Spot Price ($/lt) 0.58 0.63 0.48 0.52 0.65 0.54 0.69 0.75 US Gasoline Spot Price ($/lt) 0.54 0.65 0.43 0.51 0.57 0.54 0.68 0.81 Brent Crude Oil Price ($/barrel)72.4 99.0 60.9 77.3 86.8 79.9104.2119.6Sources: USDA; LEI; LMC estimates.Political pressure to scale down the US$0.45 per gallon (US$0.12/lt) tax credit from which ethanol blenders benefit continues to grow. A bill has been introduced that would instead tie subsidies to movements in the oil price.In Brazil, after record prices in the past two months, the start of the 2011/12 cane crushing campaign has helped ease prices, which averaged US$0.62/lt and US$0.88/lt in May for hydrous and anhydrous ethanol, respectively. This means that prices are starting to become competitive against gasoline again.In the U, ethanol trading has been very subdued of late and prices averaged US$0.84/lt (spot FOB Rotterdam) during May. Motorists in Germany have been reluctant to use recently introduced E 10 principally out of concern that the higher ethanol blend could damage their engines. Concerns regarding the environmental benefits of ethanol and using food for fuel have also been cited.While delays by the Commission in announcing which voluntary sustainability schemes will be approved have resulted in lacklustre demand, the industry continues to be hit by the high price of wheat and cash margins have been negative over the past two months. A number of plants have already ceased operations and others are considering suspending operations.Diagram 9: Corn vs. molasses prices on amolasses equivalent basis4060801001201401601802002202005200620072008200920102011C o s t o n a m o l a s s e s e q u i v a l e n t b a s i s ($/t o n n e )Corn US Gulf Blackstrap MolassesDiagram 10: Brazilian, EU and US ethanolprices0.20.40.60.81.01.21.41.61.8May-09Sep-09Jan-10May-10Sep-10Jan-11May-11U S $/l i t r e Brazil Anhydrous US (CBOT 1st Position)EU Anhydrous (Rotterdam)Sugar Bulletin: June 2011© LMC International Ltd, 2011Page 7Alternative sweetenersDiagram 11: Ratio of wholesale HFCS prices towhite sugar prices in the US3040506070809010011012019971999200120032005200720092011R a t i o o f w h o l e s a l e p r i c e t o t h a t o f r e f i n e d s u g a r (%)(42) HFCS(55) HFCSE ncouraging developments have been taking place in the beverage sector with a number of surveys pointing to an improved outlook in some of the key markets around the world. In April, Beverage World’s “State of the Industry” 2011 report revealed that the US market, which had a difficult period in 2009, is now starting to see better performance in nearly all of the drink categories. E ven the carbonated soft drinks sector, which had a particularly difficult five years, seems slowly to be picking up, capturing some market share from higher end energy drinks.The diet segment of the market has also had a relatively good year, although it is still said to be underperforming. This is despite the push with natural sweeteners, which include stevia-based sweeteners. However, key market drivers for the sector, in terms of a health and weight management are still proving to be very much evident in the US market.The findings are consistent with E uromonitor’s survey of the soft drinks sector carried out earlier in the year. In addition to better performance in the mature markets, Asia is predicted to overtake North America as the largest region in terms of overall soft drinks sales, in value terms, by the end of 2011. Health considerations are also driving consumption choices in this market. WOW! Nutrition, a pioneer and leading sweetener manufacturer in Brazil, launched 100% Stevia in May. This new line of sweeteners under the Doce Menor brand comes under a joint venture with PureCircle. Wow! Nutrition is the second largest sweetener manufacturer in Brazil and specializes in diet foods and healthy beverages. 100% stevia is their latest product line to be naturally sweetened with stevia. In other sweetener news, Tate & Lyle have made plans to reopen their mothballed US sucralose factory, expected to take place in the first half of the 2013 financial year. The plant, located in Alabama, had been closed in 2009 following Tate’s decision to integrate all their sucralose (Splenda) production in Singapore. Up until now, the company had indicated this had been sufficient to meet demand. Sucralose has been an extremely profitable business for Tate & Lyleand the company has just reported a good year in terms of sales volumes. The sales growth has been helped by reduced selling prices, reflecting a strategy of securing long-term volume contracts with customers. In its 2011 end year results, the value share of sucralose in the high intensity sweeteners market rose from 27% to 28% in the last year, with Splenda’s share of the global market for sucralose still around 90%. Tate & Lyle foresees even rosier prospects in 2012, justifying its decision to utilise capacity at two global sites. Rising obesity levels in emerging markets has rapidly expanded the market for healthier low-calorie products. Several food manufacturers are also seeking to use a higher proportion of sweeteners in blends, given high sugar prices, to keep their costs down. This has helped the fortunes of sucralose which is stable under varying heat conditions and hence is attractive for use in warmer climates.GLG Life Tech Corporation released information on its joint venture with China Agriculture and Healthy Foods Company Limited (CAHFC). The new venture will be called Dr. Zhang’s All Natural and Zero Calorie Beverage and Foods Company (ANOC). GLG announced that ANOC’s first line of six zero/low calorie teas will be the first to be sweetened with stevia, sourced from GLG. Most of the leading brands in China are sweetened with sugar. The new products are aimed at the ready-to-drink (RTD) teas which has been one of the fastest growing beverage categories in the country since 2000.© LMC International Ltd. 2011. All rights reserved.No material may be reproduced or transmitted, in whole or in part, in any manner, without written consent.E ditors: Martin Todd, Gareth Forber, Nikki Powell, Owen Wagner, Tara Nutt, Feifei Lu., Marsha Ribeiro, Rachel Cook, Suhrid Patel.Table 5: Wholesale prices for alternative sweeteners200720082009201020102010 2011 2011Average Average Average Jul-Sep Oct-Dec Average Jan-Mar Apr-Jun USA Prices (in $/mt, dry basis, Midwest)Bulk dry beet sugar 552.6717.6838.21,241.4 1,234.6 1165.9 1,219.3 1,228.3 Dextrose 620.5683.9746.3636.0 636.0 649.4 636.0 636.0 HFCS (42% fructose) 515.8607.0694.8539.5 654.2 587.0 663.7 663.7 HFCS (55% fructose) 561.5645.6726.5583.4 702.3 630.4 712.2 712.2 Glucose Corn Syrup 483.5564.1641.8559.4 667.1 590.3 676.1 676.1 Cost of Corn Wet Milling Inputs (in $/mt of Corn Sweetener, dry basis, ex-Chicago)No. 2 Yellow Maize 245.0337.5249.0271.6 362.3 276.0 432.5 474.5 By-product credits 116.3163.7116.9120.5 159.5 128.2 181.3 191.9 Net cost of maize inputs 128.9173.1131.8151.7 203.2 147.9 253.0 281.7 Japanese Prices (in Yen/kg, dry basis)Refined white soft sugar 154.5159.5167.2176.7 182.3 179.2 189.5HFCS (42% fructose) 136.8157.0159.2149.6 151.3 150.6 160.1HFCS (55% fructose) 145.0165.0167.2157.6 159.3 158.6 168.1Index of Intense Sweetener Prices, World Market(1987=100)World Raw Sugar Price 143.0174.9259.9291.5 419.2 321.9 440.9 341.1 Saccharin 64.1169.488.2103.3 109.3 71.2 117.7 38.3 Cyclamate (non-US markets) 216.0328.8351.2337.5 322.6 346.7 326.6 332.3 Aspartame (non-US markets) 15.315.815.615.0 15.2 15.2 15.1Notes: 1: Figures in italics are based upon incomplete coverage of the period in question.2: These corn sweetener prices are list prices, which are frequently very much higher than actual traded values for USdeliveries. US sugar prices, however, are actual traded values; thus the discounts for corn sweeteners shown in this table and Diagram 9 are understated.Sources: Milling and Baking News; Feedstuffs; Mitsui; LMC estimates.Summary●World production rose by 4.8% to 164.6 mnmt in the 12 months ending June 2011.●World consumption grew by 0.5% to 163.0mn mt during the same period.●World stocks fell slightly by 0.9% to 56.9 mnmt for the 12 months ending June 2011.●Raw sugar prices stabilised during Maytrading in a 20-23 cents/lb range. Meanwhile the white premium rocketed upwards to around $170/mt basis July/August futures. ●The slow pace of the Brazilian harvest andthe growing line up of vessels at Centre/South ports are supporting pricesnearby, however, the prospect of a largesurplus in 2011/12 is beginning to loomover the market.●Brazilian ethanol prices have fallen sharplyover the last few weeks as new crop ethanolhas become available.●Recent survey’s of the global beveragesector point to positive developments forlow calorie sweeteners.LMC InternationalNew York 1841 Broadway New York, NY 10023USAT +1 (212) 586-2427 F +1 (212) 397-4756 info@Oxford14-16 George StreetOxford OX1 2AFUKT +44 1865 791737F +44 1865 791739info@Kuala LumpurB-03-19, Empire SohoEmpire SubangJalan SS16/1, SS1647500 Subang JayaSelangor Darul EhsanMalaysiaT +603 5611 9337info@ 。