雅思小作文---TASK1图表题
雅思写作Task1-地图完美版
雅思写作-地图第一段:改写题目主要句式:图表名称+动词+描述主题+时间图表名称:The diagram/map/picture动词:show/illustrate/give information about/indicate描述主题:1. The development/change of 某地方。
2. How +某个地方+changed/developed. 3. The development/the change that has taken place +某个地方。
举例子:1.The maps show the development of Stokeford village over an 80 years period from 1930 to 2010.2.The diagrams illustrate some changes to a small island which has been developed for tourism.3.The two pictures compare the layout of a school as it was in the year 2004 with a proposed/planned/projected/expected site design for the year 2024.4.The diagrams show West Park Secondary School at three different stages in its development: 1950, 1980 and 2010.第二段:总结主要特征。
一般来说选取一两个最重大的变化特征。
或者从全局来看,描述最显著的变化。
同时还可以从地图功能的变化阐述其主要变化,比如说可以容纳更多学生,转变成居民区了,或者是旅游/娱乐设施完善了。
主要句式:1. It is clear that +某地方+has changed considerably with the construction of some new facilities.It is clear that the island has changed considerably with the introduction of tourism.2.数量+new features can be seen in the second diagram.Six new features can be seen in the second diagram.3. The main developments are that + 句子(描述一个或两个重大变化)The main developments are that the island is accessible and visitors have somewhere to stay.4. It is clear that the main change for+ 时间It is clear that the main change for 2024 involves the addition of a new school building.It is apparent from the pictures that the village has become increasingly populated over this time frame第三,四段细节描述(动词enlarge, widen, divide, replace, move, convert, relocate, demolish, renovate, extend , develop, modify)主要句式(下列句式中A,B 为建筑物)1. 位于be located/situated/sitedChorleywood Park and Golf Course is now located next to this original village area.A 位于B (城镇)的东方/西方/南方/北方A is/ lies/ is located/ is sited to/in the east/west/south/north part of B方位的表达和介词的搭配A be built/located to the east/north/south/west(southeast, southwest, northeast, northwest) of BA be built/located in the west/north/south/west part of BA be built/located to the left/right (hand side) of BA be built/located beside/next to/adjacent to/behind/in front of/ in the front of/ opposite to B2. 被建造be constructed/builtA motorway was built to the east of the villageA second car park will be built on the site of the original sports field3. 被改建成be turned to/converted toA large area behind the school was turned into a playgroundThe farmland has been converted to residential building.类似句式:The area+ 方位描述+be +建筑物The area behind the houses was farmland.4. 被拆除be demolished / dismantled / removedThe house had been demolished in order to make way for(腾出空间,让路)a small car park and an additional school building,5. 连接connect/linkThere is also a short road linking the pier with the reception and restaurant.类似表达Footpaths connect the huts6. 被分离be separated/divided1.The two school buildings were separated by a path running from the main entrance to the sports field.2.The original playground was divided into two.7. 保持不变No changes be made=remain unchanged1.No changes will be made to the main entrance and original car park.2. The school building remained unchanged8. 被扩大be extended/enlarged=increase in size1.The primary school opposite(opposite 做介词而非动词)the post office has been extended to include two new buildings2.The school has increased in size9. 被缩小be reduced in size/shrink(shrank, shrunk)9. 分叉split off/branch off1.Two new roads split off from the main road2. A new road to the south-west of the school braches off from the main road and extends out to the river.10. 道路两边的建筑描述1. Both new roads are accompanied by a small number of new houses on either side.2. A number of new properties were attached to the road heading south.11.道路的描述A railway line was built crossing this area from west to east.12.表现有建筑和规划建筑的改变(Proposed, current, future, existing, planned, it is expected that, at present, it is anticipated that, prospective)1.The current entrance to the gallery is on the right hand side of the building and visitors pass through a large lobby before entering the gallery itself. One of the proposed changes is to allow entrance on to the main exhibition area, where an existing entrance will be widened.2.At present, the exhibition rooms are divided into three separate areas. According to the plans, the dividing walls will be removed and one large exhibition space will be created.3. In addition, the gallery will gain an education center. This area will replace the existing lobby, which will also be enlarged to create a more functional space with large table and seating.4. To replace the current straight staircase, a new set of winding stairs will be installed in the corner of the living room.5. By 2024, it is expected that there will be 1000 pupils, and a third building will have been constructed.12. with 的用法(适用于高分学员)1.Two footpaths split off from the main road, with the eastern-facing road replacing old farmland. (先描述一个变化,用with接名词+现在分词(主动)或过去分词(被动)描述这一变化的详细内容)2. The farmland was converted to residential purpose, with a number of new houses attached to the road heading south.上课案例讲述和练习OG test3 Task1第一段:改写题目第二段:总结学校扩大了,停车场被建造和扩大了。
剑桥雅思写作11task1

剑桥雅思写作11task1
剑桥雅思写作11书中的Task 1是关于饼状图的描述和分析。
这个任务要求我们根据提供的饼状图数据,进行描述和分析,并写一篇150字的报告。
首先,让我们来看一下饼状图的内容和数据。
根据图中所示,这个饼状图展示了2010年某国家的能源消耗情况。
图中将能源消耗分为四个部分,煤炭、天然气、石油和可再生能源。
每个部分的能源消耗量用百分比表示。
根据饼状图的数据,煤炭是该国家2010年最主要的能源来源,占总能源消耗的40%。
其次是石油,占总能源消耗的35%。
天然气的能源消耗量为20%,而可再生能源的能源消耗量最低,仅占总能源消耗的5%。
从这个饼状图可以得出一些结论。
首先,煤炭和石油是该国家主要的能源来源,这可能是因为这两种能源在该国家更为丰富和容易获取。
其次,可再生能源的能源消耗量相对较低,这可能是因为该国家在可再生能源开发方面还有较大的发展空间。
最后,天然气的能源消耗量相对较高,这可能是因为天然气在该国家的能源结构
中具有一定的重要性。
除了描述饼状图的数据和得出结论,我们还可以从其他角度进行分析。
例如,我们可以比较2010年和之前几年的能源消耗情况,以了解能源消耗的趋势和变化。
我们还可以将该国家的能源消耗与其他国家进行比较,以了解该国家在能源利用方面的优势和劣势。
总的来说,剑桥雅思写作11书中的Task 1要求我们根据提供的饼状图数据进行描述和分析。
通过分析饼状图,我们可以得出关于能源消耗情况的结论,并从其他角度进行进一步的分析。
这个任务旨在考察我们对图表数据的理解和分析能力,以及我们的写作能力。
雅思写作Task1饼状图考官范文(4)

雅思写作Task1饼状图考官范文(4)The table below shows CO2 emissions for different forms of transport in the European Union. The Pie Chart shows the percentage of European Union funds being spent on different forms of transport.Write a report for a university lecturer describing the information in the graph below.Sample Answer:The given graphs provide information on the amount of Carbon dioxide emission per person from different vehicles in the European Union and also show the expenditures on different modes of transportations. As is observed from the given illustration, the highest amount of CO2 per person is emitted by the Air transports and European Union spends highest percentage of funds for the road transportation system.According to the bar graph, a single passenger of a personal cars emit around 130 gm of CO2 per kilometer while a passenger in a bus contribute to 65 gm of emission per kilometer. Coaches, maritime and rail passengers emit the lowest amount of CO2which is about 50 grams per passenger in a kilometer. Finally a single passenger of airplane contributes to 370 km of CO2 per kilo which is the highest amount of CO2 emission among the given transportations.Based on the pie chart, the European Union spent the highest amount (52%) on the road transportation system while spent only 1% or 2% on ports, waterway airport intermodal and other transport systems. They spent 31% on rail system and 10% on public transportation system. This indicates the European Union spent the majority of the budget on public transportations.In summary, Airplanes and personal car using passengers per person cause more CO2 emission than other mode of public transportation and European Union spend more on road and railways than other mode of transports.(Approximately 238 words)( This model answer can be followed as an example of a very good answer. However, please note that this is just one example out of many possible approaches.)。
剑桥雅思9真题+解析-Test1写作

剑桥雅思9真题+解析-Test1写作task1雅思写作名师点题:地图题以及一些工程图表题是雅思考试中比较“另类”的话题。
考生接触较少,因此会产生一定的恐惧心理。
在总结这类地图和表格题的信息时,考生可遵循以下两个步骤:首先要弄清楚地图的方位顺序,其次要对比必要的信息,此外,考生还需要持别注意时态的应用。
雅思写作高分范文:The two drawings illustrate the changes of the same island before and after the construction ofsome transport and service buildings.It is clear that before development, the horizontal island which is about 260 meters long has a Few trees on both east and west sides. Furthermore, on the west edge, a small beach is located for tourism in the future.The layout changes tremendously after buildings are constructed in almost the whole island. The trees on the east side are kept for the natural view.However, the west trees are surrounded by some accommodation houses, with a footpath linked to the beach where a swimming zone is closely connected, Next to the western accommodation, there is a reception building around which a vehicle track road heading to the south pier for tourist sailing is just paved. Onthe opposite side of the pier, a restaurant stands at the north side near the seashore. The center of, the island is also designed to supply housing for tourists. In sum, comparing the two drawings,tremendous developments have been evident.These developments make the whole island crowded with modern facilities, which may cause damages to the environment.作文结构分析:范文由四段组成:第一段为引言段,主要介绍该图表展示的是什么方面的信息;第二段对改建之前的岛屿进行描述;第三段对改建之后岛屿的设施和交通进行描述:最后一段对两个图表体现出来的总体特点(overview)进行归纳,同时也表达了对岛屿环境的担忧。
2天解决雅思小作文图表题
Task one (小作文) requirements:(1)Describe the main features of the charts.What is the main feature?(2)Perspective﹥clarityTrend vs. Proportion (time sequence and space concept)(3)Don’t cite the data directly and try to make comparisons.(4) A relatively wide range of vocabulary and varied sentence patterns.(5)Linkers are always important in writing.(6)Try to avoid grammatical mistakes and misspellings.(7)Try to make your paper tidy and paragraphing acceptable.How to read the charts.(Examples)表示趋势的句型(核心句型+衍生句型)(1) A increased from 1 to 2 + time.In the past 2 decades, the population in Japan increased from 1 million to 2 million.(2) A witnessed an increase + data + timeTime witnessed an increase in A.The past 2 decades witnessed an increase in the population of Japan.Witness – experience- see – undergo – go through(3) There was an increase in A + time + dataThere was in increasing tendency/trend in A + time +data(4) Time + A increased + data before decreasing to + data.Time + A increased + data before it decreased to + data.Variation: after.(5) 高分句(1) /(2) /(3), + rising +data. / which clause.Population in Japan increased, rising from 1 to 2 million.The production of cotton declined, falling from 20 tones to 15 tones in the surveyed years.The number of private cars witnessed an increase, which rose from 1 million to 2 in the period.(6) and 句型A increased in the first 20 years from 10 to 35 and continued to rise in the following decade.(8) A increased in a steady way from 1995 to 2000, arriving at the peak of 1 billion. / reaching the peak of/ reaching the lowpoint of + data.表示增减的动词:Increase / rise / climb / go up / grow / soar / rocket.Decrease / fall / decline / go down / drop / reduce / plummet.表示增减幅度的词:Steadily , slightly, stably, slowly.Dramatically, substantially, considerably, remarkably, significantly.表示波动且增减:It increased with some fluctuation.It fluctuated in an upward trend. / in a downward trend.表示持平(无变化):There was almost no change in the number of private cars with the figure of 20 million.The number of private cars remained unchanged.AndHow to cite the statistics:(1) A increased from 10 to 20.(2) A increased by a margin of 10.(3) A witnessed an increased, arriving at 20.(4) A is larger than B, 30 and 20 respectively.(5) A is the largest of all items, accounting for/ constituting / representing 70%.A accounted for / constituted 70%, the largest part of all items.(6) A took up the smallest of the chart with the figure of 20%.The figure of A is 20, the lowest in the surveyed 10 years.(7) A, which accounted for 30% / which was 50 million, was the largest of all items. / was much larger than B.(8) A is larger than B (20 and 15).How to achieve clarity:【清晰结构】先总后分—分门别类+合并同类(根据趋势和反差分类) —主要特征—句型,段落,用词,连接。
雅思写作Task1柱状图考官范文(20)
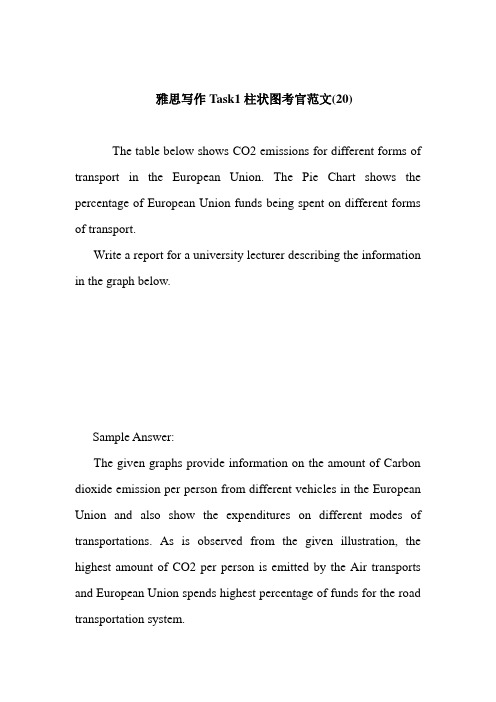
雅思写作Task1柱状图考官范文(20)The table below shows CO2 emissions for different forms of transport in the European Union. The Pie Chart shows the percentage of European Union funds being spent on different forms of transport.Write a report for a university lecturer describing the information in the graph below.Sample Answer:The given graphs provide information on the amount of Carbon dioxide emission per person from different vehicles in the European Union and also show the expenditures on different modes of transportations. As is observed from the given illustration, the highest amount of CO2 per person is emitted by the Air transports and European Union spends highest percentage of funds for the road transportation system.According to the bar graph, a single passenger of a personal cars emit around 130 gm of CO2 per kilometer while a passenger in a bus contribute to 65 gm of emission per kilometer. Coaches, maritime and rail passengers emit the lowest amount of CO2which is about 50 grams per passenger in a kilometer. Finally a single passenger of airplane contributes to 370 km of CO2 per kilo which is the highest amount of CO2 emission among the given transportations.Based on the pie chart, the European Union spent the highest amount (52%) on the road transportation system while spent only 1% or 2% on ports, waterway airport intermodal and other transport systems. They spent 31% on rail system and 10% on public transportation system. This indicates the European Union spent the majority of the budget on public transportations.In summary, Airplanes and personal car using passengers per person cause more CO2 emission than other mode of public transportation and European Union spend more on road and railways than other mode of transports.(Approximately 238 words)( This model answer can be followed as an example of a very good answer. However, please note that this is just one example out of many possible approaches.)。
雅思英语图表作文模板

雅思英语图表作文模板Title: A Comprehensive IELTS Writing Task 1 Templatefor Graphs and Charts。
Introduction:The given graph/chart illustrates/depicts/presents... (briefly describe the main subject of the graph/chart). The data spans from [start date] to [end date] and represents [specific topic or theme].Overview:To provide a general perspective, it is evident that... (summarize the main trends or patterns observed in the data). Furthermore, it is noticeable that... (highlight any significant changes or noteworthy points).Detailed Analysis:1. Introduction of the graph/chart:Begin by stating what the graph/chart is about and what it represents.Example: The bar chart provides information about the annual revenue generated by different sectors in a certain country over a ten-year period.2. Overview of the data:Summarize the main trends or patterns observed in the data.Example: Overall, the data shows a steady increase in revenue for the manufacturing sector, while the service sector experienced fluctuating growth.3. Detailed Description:Provide specific details about the data presented in the graph/chart.Example: In 20XX, the manufacturing sector accounted for the highest revenue, surpassing the service sector by $X million. However, by 20XX, the service sector experienced a significant surge in revenue, outperforming the manufacturing sector by $Y million.4. Comparisons and Contrasts:Compare different elements or categories within the data.Example: The agricultural sector consistently lagged behind both manufacturing and services throughout theentire period. Additionally, while manufacturing showed steady growth, the technology sector experienced rapid fluctuations, reaching its peak in 20XX before sharply declining in subsequent years.5. Additional Insights:Offer any additional insights or observations basedon the data.Example: It is worth noting that government policies introduced in 20XX had a significant impact on the energy sector, leading to a notable increase in revenue from renewable sources.Conclusion:In conclusion, the data presented in the graph/chart highlights... (restate the main findings or observations). Overall, it provides valuable insights into... (summarize the significance of the data in relation to the topic).Word Count: XXX words。
最新雅思Task1写作满分范文
最新雅思Task1写作满分范文,今天小编就给大家带来了雅思Task1写作满分范文,希望能够帮助到大家,下面小编就和大家分享,来欣赏一下吧。
最新线图之座机与手机开支The line graph shows the average annual expenditures on cell phone and residential phone services between 2001 and 2010.该线图展示美国2001-2010年间年均花在手机和座机上的开支。
请作答。
雅思图表小作文线图9分范文:The line graph compares average yearly spending by Americans on mobile and landline phone services from 2001 to 2010.It is clear that spending on landline phones fell steadily over the 10-year period, while mobile phone expenditure rose quickly. The year 2006 marks the point at which expenditure on mobile services overtook that for residential phone services.In 2001, US consumers spent an average of nearly $700 on residential phone services, compared to only around $200 on cell phone services. Over the following five years, average yearly spending on landlines dropped by nearly $200. By contrast, expenditure on mobiles rose by approximately $300.In the year 2006, the average American paid out the same amount of money on both types of phone service, spending just over $500 on each. By 2010, expenditure on mobile phones had reached around $750, while the figure for spending on residential services had fallen to just over half this amount.(162 words, band 9)附雅思小作文考官范文基本套路段一:话题重述段二:概括话题数据的主要特征或规律段三:详述特征规律一段四:详述特征规律二注意:simon考官主张雅思小作文无须总结!大家可留心这一点。
- 1、下载文档前请自行甄别文档内容的完整性,平台不提供额外的编辑、内容补充、找答案等附加服务。
- 2、"仅部分预览"的文档,不可在线预览部分如存在完整性等问题,可反馈申请退款(可完整预览的文档不适用该条件!)。
- 3、如文档侵犯您的权益,请联系客服反馈,我们会尽快为您处理(人工客服工作时间:9:00-18:30)。
雅思小作文TASK1图表题规律
注意事项:
1.Task1就是客观写作,要求客观真实。
2.客观性:不应该有任何图里没有而靠自己主观想象加入得成分。
结尾段针对图形做出得总结性结论也应该就是根据图表得实际内容做出得符合逻辑得总结。
准确性:图表里面得数据介绍要力求精确,不能抄错数字。
但当一个特征点没有落在一个准确得坐标值上时,允许进行合理得目测或估计一个大概数值。
详尽性:要有层次感,并不需要把所有得数字都推到文章里。
3.类型
Table表格题
LineGraph线图
BarChart柱状图
PieChart饼状图
ProcessChart流程图
4.瞧图要注意单位,标题与图例。
5.对于多数小作文题,题中给出了几个图就对应得写出几个主体段。
题目里只给出一个图,根据图中包含几类图形元素写几个主体段。
图中只给了一个图,但图中所含图形元素很多,则分类。
题目中出现多线多柱多饼,用“对应提取法“,把每组里得对应元素提出来组织主体段。
6.时态与发生时间意义对应。
陈述永恒事实得句型,其主句得谓语动词必定用一般现在时。
若题目里没有出现时间,则全文都使用一般现在时。
7.结构
开头段(1~2句)改写原题
主体段1总体概括
具体介绍数字
主体段N总体概括
具体介绍数字
结尾段(1~2句)介绍总数(若图里并没有明确得给出总数,则省略)
结论(根据图里得数据得出有一定合理性得结论)
8.开头段得改写
题目中改写成
Show illustrate /compare
Proportion percentage
Information data
The number/amount of the figure for
Family household
Males men
Female women
Influence affect/effect
Categories kinds/types
Subway system underground railway/train system
Store shop
9.介绍数据或描述变化趋势得常用词。
动词:
表示上升:go up ; rise ; increase : grow ; experience a upward trend
表示急剧上升:jump ; shoot up ; surge ; soar (高涨)
表示下降: decline ; drop ; decrease : fall ; experience a downward trend;fall back 表示急剧下降:plummet; plunge
强调上升或下降得起点数值,重点数值:from…to…
强调上升或下降得幅度:by
表示由…组成:consist of ; be made up of ; be composed of ; be comprise of 表示波动:fluctuate/fluctuation (fluctuate between…and…)
表示稳定在一个水平上:remain stable at ; level off at ; hover at
表示经历了某种变化:see ;witness ; experience
表示达到最高点:peak at ; reach its peak at ; reach the highest level at
表示达到最低点:reach its lowest point/ level at
表示数量:reach ; stand at
表示所占份额(百分比/份额)account for ; represent ; make up ; constitute
表示对将来数字得预测:expect ; predict; project
表示变成原来数字得二倍/三倍:(almost/more than) double/triple ; increase twofold/tree fold
表示就是另一事物得二倍/三倍:be twice/three times as high/long/fast/popular as
表示原有得差距缩小/扩大:The gap between…and…narrows/widens
表示原本少于但后来超过:exceed ; overtake
形容词
表示急剧:sharp ; dramatic; rapid; deep
表示持续:gradual ; consistent; steady ; continuous; slow
表示显著地,大幅度得: significant ; considerable; marked ; substantial; noticeable
表示幅度很小: slight ; minimal (语气很强,表示“极少得”)
表示大约:about ; around; approximately; just over/ under
表示分别:respectively(置于二组或多组数字后)
10.主体段写法
第1句话:概括该图得总体变化趋势(图中存在时间推移)/概括该图包含几个部分(图中不存在时间推移)
第X 句:具体介绍数据
(1)尽可能地按照有规则得顺序来介绍数据:
常规得线图:按从左到右得自然顺序介绍
常规得柱状图:若横轴有时间变化,按从左到右得自然顺序介绍
若横轴没有时间变化,则把各柱对应得数值从大到小排序介绍
常规得饼图:按所占份额从大到小排序来介绍
表格题:按行或按列得顺序依次介绍(把每行或每列得数值从大到小介绍)
(2)并非要覆盖所有数字,不可省略关键数字(起始点,终止点,文化趋势,转折点,极值,交点,百分点)
11、修饰作文
合理得分段,有持续得描述,尽量相识得特征数字介绍
(1)比较意识:强调极值,对非极值进行适当对比
在第一句话得前半部分先定性地进行对比或类比,然后在该剧得后半部分用with+独立主格结构(在句子得后部附加另一事物得趋势或信息)/现在分词短语(句子后部仍然介绍句子前部主语得趋势或信息)/在括号里补充介绍数字来说明具体数字。
要能够清晰介绍趋势与数字
(2)表示时间得介词
In, from ,to , by (+一个具体得时间点,用于面熟某种变化趋势截止某一时间,过去完成时),during(强调发生在该期间),over (表示某种变化从某时期得开始至结束)
(3)It is clear/particularly noticeable that …(不宜在作文里过早出现)
(4)Interestingly,…/It is interesting to note that …(用于描述对比其她图并不就是很明显得一个特点)
流程图
(出现频率:全年50场考试大概出现2-3次)
1.瞧图时必须仔细,不能漏掉任何一个细节。
2.可将流程图中得生词直接抄到文章。
3.多用表示顺序得单词,短语。
At the first stage of the process,…/First of all,…/ The process begins with
At the second/third /fourth stage , …
After that / Next / At the following stage /Subsequently / Afterwards
Then (不出现在句首,出现在被动语态里得be动词与过去分词之间)
At this stage /point ,…
Finally / Eventually(全过程很曲折)/At the final stage
4、若流程图特别复杂,则合并成几个大步来写(题目会有细节暗示)
举例:
60%= three-fifths// three out of five
= a/the majority of
= a large/striking/ominant/leading portion/part/share/proportion/percentage/margin of
>80% (93%)= a lion’s share
5%= a minority of, a marginal/micro/slim/tiny/small-scaled/meagre portion
37、8%= maximum/comparatively a majority of (<50%得最大值)comparatively a minority of WRONG
7、3%
87%/76%/53%。