超声波测距外文翻译文献
超声测距相关毕业设计外文资料翻译

毕业设计(论文)外文资料翻译系(院):电子与电气工程学院专业:电气工程及其自动化姓名:学号:外文出处:United States Patent 5442592(用外文写)附件: 1.外文资料翻译译文;2.外文原文。
指导教师评语:签名:(手写签名)年月日注:请将该封面与附件装订成册。
外文资料翻译译文超声波测距仪文件类型和数目:美国专利5442592摘要:提出了一种可以抵消温度的影响和湿度的变化的新型超声波测距仪,包括测量单元和参考资料。
在每一个单位,重复的一系列脉冲的产生,每有一个重复率,直接关系到各自之间的距离,发射机和接收机。
该脉冲序列提供给各自的计数器,计数器的产出的比率,是用来确定被测量的距离。
出版日期:1995年8月15日主审查员:罗保.伊恩j.一、背景发明本发明涉及到仪器的测量距离,最主要的是,这种仪器,其中两点之间传输超声波。
精密机床必须校准。
在过去,这已经利用机械设备来完成,如卡钳,微米尺等。
不过,使用这种装置并不利于本身的自动化技术发展。
据了解,两点之间的距离可以通过测量两点之间的行波传播时间的决定。
这样的一个波浪型是一种超声波,或声波。
当超声波在两点之间通过时,两点之间的距离可以由波的速度乘以测量得到的在分离的两点中波中转的时间。
因此,本发明提供仪器利用超声波来精确测量两点之间的距离对象。
当任意两点之间的介质是空气时,声音的速度取决于温度和空气的相对湿度。
因此,它是进一步的研究对象,本次的发明,提供的是独立于温度和湿度的变化的新型仪器。
二、综述发明这项距离测量仪器发明是根据上述的一些条件和额外的一些基础原则完成的,其中包括一个参考单位和测量单位。
参考和测量单位是相同的,每个包括一个超声波发射机和一个接收机。
间隔发射器和接收器的参考值是一个固定的参考距离,而间距之间的发射机和接收机的测量单位是有最小距离来衡量的。
在每一个单位,发射器和接收器耦合的一个反馈回路,它会导致发射器产生超声脉冲,这是由接收器和接收到一个电脉冲然后被反馈到发射机转换,从而使重复系列脉冲的结果。
毕业设计论文 外文文献翻译 超声波测距 中英文对照
毕业设计论文外文文献翻译超声波测距中英文对照The Circuit Design of UltrasonicRanging System超声波测距系统的电路设计Ultrasonic Distance Meter超声波测距仪姓名:专业: 测控技术与仪器学号: 2007071071指导教师姓名,职称,:The Circuit Design of Ultrasonic Ranging SystemThis article described the three directions (before, left, right) ultrasonic ranging system is to understand the front of the robot, left and right environment to provide a movement away from the information. (Similar to GPS Positioning System)A principle of ultrasonic distance measurement1, the principle of piezoelectric ultrasonic generatorPiezoelectric ultrasonic generator is the use of piezoelectriccrystal resonators to work. Ultrasonic generator, the internal structure as shown in Figure 1, it has two piezoelectric chip and a resonance plate. When it's two plus pulse signal, the frequency equal to the intrinsic piezoelectric oscillation frequency chip, the chip will happen piezoelectric resonance, and promote the development of plate vibrationresonance, ultrasound is generated. Conversely, if the two are notinter-electrode voltage, when the board received ultrasonic resonance,it will be for vibration suppression of piezoelectric chip, the mechanical energy is converted to electrical signals, then it becomes the ultrasonic receiver.2, the principle of ultrasonic distance measurementUltrasonic transmitter in a direction to launch ultrasound, in the moment to launch the beginning of time at the same time, the spread of ultrasound in the air, obstacles on his way to return immediately, the ultrasonic reflected wave received by the receiver immediately stop the clock. Ultrasound in the air as the propagation velocity of 340m / s, according to the timer records the time t, we can calculate the distance between the launch distance barrier (s), that is: s = 340t / 2 Ultrasonic Ranging System for the Second Circuit DesignSystem is characterized by single-chip microcomputer to control the use of ultrasonic transmitter and ultrasonic receiver since the launch from time to time, single-chip selection of 8751, economic-to-use, and the chip has 4K of ROM, to facilitate programming. Circuit schematic diagram shown in Figure 2. Draw only the front range of the circuit wiring diagram, left and right in front of Ranging circuits and the same circuit, it is omitted.1,40 kHz ultrasonic pulse generated with the launchRanging system using the ultrasonic sensor of piezoelectric ceramic sensors UCM40, its operating voltage of the pulse signal is 40kHz, whichby the single-chip implementation of the following procedures to generate.puzel: mov 14h, # 12h; ultrasonic firing continued 200mshere: cpl p1.0; output 40kHz square wavenop;nop;nop;djnz 14h, here;retRanging in front of single-chip termination circuit P1.0 input port, single chip implementation of the above procedure, the P1.0 port in a40kHz pulse output signal, after amplification transistor T, the drive to launch the first ultrasonic UCM40T, issued 40kHz ultrasonic pulse, and the continued launch of 200ms. Ranging the right and the left side of the circuit, respectively, then input port P1.1 and P1.2, the working principle and circuit in front of the same location.2, reception and processing of ultrasonicUsed to receive the first launch of the first pair UCM40R, the ultrasonic pulse modulation signal into an alternating voltage, the op-amp amplification IC1A and after polarization IC1B to IC2. IC2 is locked loop with audio decoder chip LM567, internal voltage-controlledoscillator center frequency of f0 = 1/1.1R8C3, capacitor C4 determine their target bandwidth. R8-conditioning in the launch of the carrier frequency on the LM567 input signal is greater than 25mV, the outputfrom the high jump 8 feet into a low-level, as interrupt request signals to the single-chip processing.Ranging in front of single-chip termination circuit output port INT0 interrupt the highest priority, right or left location of the output circuit with output gate IC3A access INT1 port single-chip, whilesingle-chip P1.3 and P1. 4 received input IC3A, interrupted by the process to identify the source of inquiry to deal with, interruptpriority level for the first left right after. Part of the source codeis as follows:receive1: push pswpush accclr ex1; related external interrupt 1jnb p1.1, right; P1.1 pin to 0, ranging from right to interrupt service routine circuitjnb p1.2, left; P1.2 pin to 0, to the left ranging circuit interrupt service routinereturn: SETB EX1; open external interrupt 1pop accpop pswretiright: ...; right location entrance circuit interrupt serviceroutineAjmp Returnleft: ...; left Ranging entrance circuit interrupt service routineAjmp Return4, the calculation of ultrasonic propagation timeWhen you start firing at the same time start the single-chipcircuitry within the timer T0, the use of timer counting function records the time and the launch of ultrasonic reflected wave received time. When you receive the ultrasonic reflected wave, the receivercircuit outputs a negative jump in the end of INT0 or INT1 interrupt request generates a signal, single-chip microcomputer in response to external interrupt request, the implementation of the external interrupt service subroutine, read the time difference, calculating the distance . Some of its source code is as follows:RECEIVE0: PUSH PSWPUSH ACCCLR EX0; related external interrupt 0MOV R7, TH0; read the time valueMOV R6, TL0?CLR CMOV A, R6SUBB A, # 0BBH; calculate the time differenceMOV 31H, A; storage resultsMOV A, R7SUBB A, # 3CHMOV 30H, ASETB EX0; open external interrupt 0POP ACCPOP PSWRETIFourth, the ultrasonic ranging system software designSoftware is divided into two parts, the main program and interrupt service routine, shown in Figure 3 (a) (b) (c) below. Completion of the work of the main program is initialized, each sequence of ultrasonic transmitting and receiving control.Interrupt service routines from time to time to complete three ofthe rotation direction of ultrasonic launch, the main external interrupt service subroutine to read the value of completion time, distance calculation, the results of the output and so on.V. CONCLUSIONSRequired measuring range of 30cm ~ 200cm objects inside the plane to do a number of measurements found that the maximum error is 0.5cm, and good reproducibility. Single-chip design can be seen on the ultrasonic ranging system has a hardware structure is simple, reliable, small features such as measurement error. Therefore, it can be used not only for mobile robot can be used in other detection systems.Thoughts: As for why the receiver do not have the transistoramplifier circuit, because the magnification well, CX20106 integrated amplifier, but also with automatic gain control level, magnification to 76dB, the center frequency is 38k to 40k, is exactly resonant ultrasonic sensors frequency.超声波测距系统的电路设计本文所介绍的三方向(前、左、右)超声波测距系统,就是为机器人了解其前方、左侧和右侧的环境而提供一个运动距离信息。
超声波测距外文文献

International Journal of Computer science & Information Technology (IJCSIT), Vol 1, No 2, November 2009EFFECT OF VARIATION OF SEPARATION BETWEEN THE ULTRASONIC TRANSMITTER AND RECEIVER ON THE ACCURACY OF DISTANCE MEASUREMENTAjay Kumar Shrivastava1, Ashish Verma2 and S. P. Singh31Department of Computer Application, Krishna Institute of Engineering and Technology, Ghaziabad (U.P.), Indiaajay@2Department of Physics and Electronics, Dr H S Gour University, Sagar (M.P.), Indiavermaashish31@3Department of Electronics and Communication, Noida Institute of Engineering and Technology, Ghaziabad (U.P.), Indiasahdeopsingh@ABSTRACTAccuracy of distance measurement of an object from an observation point such as a stationary or moving vehicle, equipment or person is most important in large number of present day applications. Ultrasonic sensors are most commonly used due to its simplicity and low cost. The accuracy of the measured distance is dependent on the separation between the ultrasonic transmitter and receiver. This dependency has been studied and reported in this paper. The result shows that the accuracy of distance measured is dependent on the separation between the transmitter and the receiver.KEYWORDSAccuracy of distance measurement, Ultrasonic sensor, distance measurement, microcontroller, sewer pipeline inspection, sewer pipeline maintenance, robotics.1. INTRODUCTIONDistance measurement of an object in front or by the side of a moving or stationary entity is required in a large number of devices and gadgets. These devices may be small or large and also quite simple or complicated. Distance measurement systems for such applications are available. These use various kinds of sensors and systems. Low cost and accuracy as well as speed are important in most of the applications. Hence ultrasonic sensors are most commonly used. To maintain the accuracy of measured distance the separation between transmitter and receiver is very important. In this paper, we describe the results of a study on the variation of error of measurement of distance of an object by varying the separation between the transmitter and receiver of the ultrasonic sensors by using microcontroller P89C51RD2. Ultrasound sensors are very versatile in distance measurement. They are also providing the cheapest solutions. Ultrasound waves are suitable both for air and underwater use [1].19International Journal of Computer science & Information Technology (IJCSIT), Vol 1, No 2, November 2009Ultrasonic sensors are also quite fast for most of the common applications. In simpler system a low cost version of 8- bit microcontroller can be used to implement the system to lower the cost. We are applying this system for sewer inspection system. Sewer blockages have become quite common. The blockages have become more frequent due to the dumping of polythene bags, hair and solid materials into the sewer system [2], [3]. There has been no work done in this direction. This is a new study which is useful to find out the optimal separation between ultrasonic transmitter and receiver to measure small distances.2. PRINCIPLEUltrasonic transducer uses the physical characteristics and various other effects of ultrasound of a specific frequency. It may transmit or receive the ultrasonic signal of a particular strength. These are available in piezoelectric or electromagnetic versions. The piezoelectric type is generally preferred due to its lower cost and simplicity to use [5]. The transmitter and receiver are available either as single unit or as separate units. The Ultrasonic wave propagation velocity in the air is approximately 340 m/s, the same as sonic velocity. To be precise, the ultrasound velocity is governed by the medium, and the velocity in the air is calculated using the formula given below (1). V= 340+0.6(t-15) m/s t:temperature, °C (1)In this study, we assumed the temperature to be 20°C, so the velocity of ultrasound in the air is 343 m/s. Because the travel distance is very short, the travel time is little affected by temperature. It takes approximately 29.15µsec for the ultrasound to propagate through 1cm, so it is possible to have 1cm resolution in the system [6].3. EXPERIMENTAL SETUPThe system consists of a transmitter and a receiver module controlled by a microcontroller P89C51RD2. We have used a microcontroller development kit for testing of the system. We are using 40Khz ultrasound sensors for our experiments. The Simplified block diagram of the system is shown in Fig.1. In Fig. 1, the interrupt1 signal initiates the system. When the interrupt1 signal is generated, MCU starts the timer1 to measure time and simultaneously generates the controlled 40Khz pulses having a train of specific number of pulses. These pulses are applied to the amplifier circuit and after amplification the ultrasound transmitter transmits the pulse train in the direction of the object. These ultrasonic pulses are reflected from the object and travels back in different directions. These reflected waves arrive at receiver. After amplification and processing it generates signal interrupt. This is applied as interrupt2 to the MCU. Interrupt2 stops the timer1, and MCU calculates the time elapsed between the generation of the wave and reception of the wave. This time is proportional to the distance travelled by the waves. Using the formula, MCU calculates the distance of the obstacle and display it or transfer it to the part of the total system where it is used for further control. Using this elapsed time, we calculate the distance of the object from the ultrasonic sensors.20International Journal of Computer science & Information Technology (IJCSIT), Vol 1, No 2, November 2009INT1 MCU Ultrasound Transmitter CircuitTINT2 Receiver Amplifier Display RFig 1: Block Diagram of the System4. EXPERIMENTAL RESULTSThe waveforms of the transmitted and received waveforms of the ultrasonic signal is stored in Digital Storage Oscilloscope. We have taken the readings for various separation between tranmitter and reciever. We have measured the distance in the interval of 5cm. For every measured distance three reading have been taken. The table shows the average of the three readings. The maesured distance is calculated on the basis of travelled time. The formula to calculate the distance is given below: Dist. (cm) = (Travelled Time*10-6 * 34300) / 2 (2)The ultrasonic waves travelled from the transmitter to the object and from the object back to the receiver hence the whole distance is divided by two. Values of %Error have also been calculated and shown. The error result shows that there is some error in recording the start and finish times in the system. When the distance increases the error is distributed in a larger distance and hence the %error decreases. We have taken the measurements for various separations of transmitter and receiver renging from 2cm to 15cm. The Table 1 shows the results when separation between tranmitter and reciever is 2cm. Table 1: Experimental Results (For 2cm Separation between Transmitter and Reciever) S.No . 1 2 3 4 5 6 7 8 9 10 Actual Distance(cm) 5 10 15 20 25 30 35 40 45 50 Travelled Time (µSec) 400 690 1050 1250 1650 1930 2180 2400 2700 3000 Measured Distance (cm) 6.86 11.83 18.01 21.44 28.30 33.10 37.39 41.16 46.31 51.45 % Error 37.20 18.34 20.05 7.19 13.19 10.33 6.82 2.90 2.90 2.90The result shows that the acuracy of measured distance is increses for longer distances. The %error becomes constant for measured distances above 40cm. The highest %error is occured in small distance of 5cm. It is also shown by Fig.2.21International Journal of Computer science & Information Technology (IJCSIT), Vol 1, No 2, November 2009Fig. 2: Graph of Actual Distance versus Measured Distance for 2cm Separation between Transmitter and Reciever. The Table 2 shows the result when separation between transmitter a reciever is 5cm. Table 2: Experimental Results for 5cm Separation between Transmitter and reciever) S.No. 1 2 3 4 5 6 7 8 9 10 Actual Distance(cm) 5 10 15 20 25 30 35 40 45 50 Travelled Time (µSec) 410 700 1000 1300 1600 1870 2220 2500 2780 3120 Measured Distance (cm) 7.03 12.01 17.15 22.30 27.44 32.07 38.07 42.88 47.68 53.51 % Error 40.63 20.05 14.33 11.48 9.76 6.90 8.78 7.19 5.95 7.02The resluts shows that the accuracy is incresed in camparison to the previous results. This is also shown by the Fig. 3.Fig. 3: Graph of Actual Distance versus Measured Distance when Separation between Transmitter and Reciever is 5 cm.22International Journal of Computer science & Information Technology (IJCSIT), Vol 1, No 2, November 2009The Table 3 shows the results when separation between transmitter and reciever is 10 cm. These results indicates that when we increase the separation between transmitter and receiver the %error increses for small measured distances. Table 3: Experimental Results for Separation of 10cm between Transmitter and reciever)S.No. 1 2 3 4 5 6 7 8 9 10Actual Distance(cm) 5 10 15 20 25 30 35 40 45 50Travelled Time (µSec) 620 750 1010 1310 1600 1870 2200 2400 2680 3000Measured Distance (cm) 10.63 12.86 17.32 22.47 27.44 32.07 37.73 41.16 45.96 51.45% Error 112.66 28.63 15.48 12.33 9.76 6.90 7.80 2.90 2.14 2.90Again the accuracy increases with the distance but the small distances are not so accurate. The error is high for small distances. It is also shown by the Fig. 4.Fig. 4: Graph of Actual Distance versus Measured Distance when Separation between Transmitter and Reciever is 10 cm. The Table 4 is showing the result of measured distance when 15cm separation between transmitter and reciever. These results shows that when we increase the separation between transmitter and receiver the %error increses. This increase is very high in small measured distances like 5cm in our experiment. The lowest %error observed for the measured distance of 45cm and again it is increasing for the measured distance of 50cm. The results shows that we have to stop the increament of seaparation between transmitter and receiver in our experiment.23International Journal of Computer science & Information Technology (IJCSIT), Vol 1, No 2, November 2009Table 4: Experimental Results for 15cm Separation between Transmitter and Reciever) S.No. 1 2 3 4 5 6 7 8 9 10 Actual Distance(cm) 5 10 15 20 25 30 35 40 45 50 Travelled Time (µSec) 1300 930 1180 1350 1620 1900 2200 2420 2700 3200 Measured Distance (cm) 22.30 15.95 20.24 23.15 27.78 32.59 37.73 41.50 46.31 54.88 % Error 345.90 59.50 34.91 15.76 11.13 8.62 7.80 3.76 2.90 9.76Again the error for the small distance say 5cm is very high. It is also showing that the graph between actual distance versus measured distance is not a straight line. This graph is shown in Fig. 5.Fig. 5: Graph of Actual Distance versus Measured Distance for 15cm Separation between Transmitter and Reciever. The graph between the measured distance the actual distance indicates that the measured distance is proportional to the actual distance.5. ANALYSIS OF THE RESULTSThe experimental results shows that the distance measured for different separations between transmitter and receiver are accurate for long distances e.g. more than 20cm. For small actual distances say 5cm, the small transmitter and receiver distances are better in comparison to the long distances between transmitter and receiver. If we place the transmitter and receiver at 15cm separation than the small distance like 5cm are not going to be measured correctly. Result shows the error of 345%. Hence we have to place the transmitter and receiver at proper distance like 5-10cm. For long distances the distance between transmitter and receiver has very low impact on the accuracy. We have compared the all measured distances for different separations between transmitter and receiver and the results are shown in the Table 5.24International Journal of Computer science & Information Technology (IJCSIT), Vol 1, No 2, November 2009Table 5: Comparison of Measured Distances for different Separations between Transmitter and Reciever Actual Dist. (cm) 5 10 15 20 25 30 35 40 45 50 Measured Distance (in cm) when Separation between Transmitter and Reciever is = 2cm 6.86 11.83 18.01 21.44 28.30 33.10 37.39 41.16 46.31 51.45 5cm 7.03 12.01 17.15 22.30 27.44 32.07 38.07 42.88 47.68 53.51 10cm 10.63 12.86 17.32 22.47 27.44 32.07 37.73 41.16 45.96 51.45 15cm 22.30 15.95 20.24 23.15 27.78 32.59 37.73 41.50 46.31 54.88S. No. 1 2 3 4 5 6 7 8 9 10As we can see in the table that small measured distance like 5cm is measured accurately when 2cm separation between transmitter and receiver. It has the lowest error. When we increase the distance to be measured, the accuracy of measured distance are high and it the highest for 10cm separation between transmitter and receiver. Hence for the range of 5cm to 50cm, as we taken in our experiments, the separation between transmitter and receiver are 2cm to 10cm. If we increase this than the error percentage also increases. The Fig.6 shows the graph between actual distance and the different measured distances for various separations between transmitter and receiver.Fig. 6: Graph for Comparison of Measured Distances for different Separations between Transmitter and Reciever This graph is also showing that the graph plotting of measured distance when separation between transmitter and receiver is 2cm, 5cm and 10cm is almost on the same points. The graph plotting when 15cm separation between transmitter and receiver, is not very encouraging for this range of 5cm to 50cm.25International Journal of Computer science & Information Technology (IJCSIT), Vol 1, No 2, November 20096. CONCLUSIONSWe have done the experiments on our ultrasonic measurement system for the various separations between transmitter and receiver and the result shows that the measured distance is satisfactory for our study. When the distance increases the error becomes constant and very less. A correction may be applied to calculate the correct distance. Interrupt1 initiates the system and interrupt2 stops the timer and on the basis of the travelled time distance calculated. In future, the whole system will be mounted on the one PCB. This study shows that for small distances the separation between transmitter and receiver should be 5cm to 10cm. Hence this study will help in fixing the separation between transmitter and receiver in the robotic vehicle for blockage detection so we are able to calculate the more accurate distance of the blockage in the sewage filled sewer lines. Hence we can prevent human labour to go in the sewage filled sewer lines to detect the blockage which are very dangerous to the human as they contain the poisonous gases.ACKNOWLEDGMENTThis work is supported by MP Council of Science and Technology (MPCST), Bhopal, Project Code No. R&D/PHYSICS.23/08-09-1.REFERENCES[1] J. David and N cheeke “Fundamentals of Ultrasonic Waves” CRC Press, Florida, USA, 2002, ISBN 0-8493-0130-0. [2] Singh SP, Verma Ashish, Shrivastava AK “Design and Development of Robotic Sewer Inspection Equipment Controlled by Embedded Systems” Proceedings of the First IEEE International Conference on Emerging Trends in Engineering and Technology, July 16-18, 2008, Nagpur, India pp. 1317-1320. [3] Shrivastava AK, Verma Ashish, Singh SP “Partial Automation of the Current Sewer Cleaning System”, Invertis Journal of Science and Technology, Vol.1, No.4, 2008, pp 261-265. [4] O. Duran, K.Althoefer, and L Seneviratene, “State of the Art in Sensor Technologies for Sewer Inspection”, IEEE Sensors Journal, April 2002, Vol. 2, N.2, pp 63. [5] Hongjiang He, Jianyi Liu, “The Design of Ultrasonic Distance Measurement System Based on S3C2410” Proceedings of the 2008 IEEE International Conference on Intelligent Computation Technology and Automation, 20-22 Oct, 2008, pp. 44-47. [6] Yongwon Jang, Seungchul Shin, Jeong Won Lee, and Seunghwan Kim, “A Preliminary Study for Portable Walking Distance Measurement System Using Ultrasoinc Sensors” Proceedings of the 29th Annual International Conference of the IEEE EMBS Cité Internationale Lyon, France, Aug 23-26, 2007, pp. 5290-5293.26International Journal of Computer science & Information Technology (IJCSIT), Vol 1, No 2, November 2009AuthorsAjay Kumar Shrivastava was born at Guna (M.P.), India on 7th August, 1977. He had done his graduation in Electronics from Dr. H.S.Gour University, Sagar (M.P.), India in 1998. After that he had completed his MCA from the same university in 2002. He has more than seven years of teaching experience. He had worked as Lecturer in Technocrats Institute of Technology, Bhopal (M.P.), India for three years. Presently he is working as Associate Professor in Krishna Institute of Engineering and Technology, Ghaziabad (U.P.), India from Aug. 2005. His research interests include Embedded Systems and Data Mining. Mr. Shrivastava is the life member of Computer Society of India (CSI). He is also life member of Association of Computer, Electronics and Electrical Engineers (ACEEE) and International Association of Computer Science and Information Technology (IACSIT) and International Association of Engineers (IAENG). He is also the member of Computer Science Teachers Association (CSTA). He is also reviewer of various ACEEE organized conferences. He has published a paper in National Journal and published/presented four papers in conferences.Dr. Ashish Verma was born on 23rd March 1963. He received the M.Sc. degree in Physics with specialization in Electronics and solidstate physics in1984 and Ph.D. degree in Physics in 1991 from Dr. Hari Singh Gour Central University, Sagar, (M.P.), India. He has having 24 years of teaching (UG/PG) and research experience and is currently working as a Senior Lecturer in the department of Physics and Electronics, Dr. Hari Singh Gour Central University, Sagar. He has guided about 150 students (UG/PG) for their projects in the field of Electronics and Physics. He guided 4 Ph.D. students (One as Co-Supervisor). Presently, he is guiding 8 Ph.D. students for their innovative research. He is supervising 3 Ph.D. students in Physics and Electronics of M.P. BHOJ (Open) University, Bhopal, (M.P.), India. He had published a book entitled “Microprocessor”, Vishwavidyalaya Prakashan, Sagar (M.P.), India and written two chapters in “Bhotiki”, Madhya Pradesh Hindi Granth Academy, Bhopal (M.P.), India. Dr. Verma published / presented about 50 research papers in the National /International Journals / Conferences of high repute. He is the Executive Council (Government Nominee) in Government Girls Autonomous College, Sagar, (M.P.). He had worked in various committees of the university. Prof. S.P.Singh was born at village Manirampur in Nalanda district, Bihar, India on 10th June 1939. He did his schooling and intermediate studies at Patna. He completed his B.Sc.(Engg.) degree in Electrical Engineering from National Institute of Technology, Jamshedpur, India in the year 1964. He did M.Tech. in Electrical Engineering (Electronic Devices and Circuits) from Indian Institute of Technology, Kanpur, India in 1975. He obtained his Ph.D. degree from Ranchi University, Ranchi, India in the year 1993. His topic was microprocessor based speed control of induction motors.27International Journal of Computer science & Information Technology (IJCSIT), Vol 1, No 2, November 2009He joined N.I.T., Jamshedpur, India as Lecturer in Electrical Engineering in 1964 continued there as lecturer, AP and Professor till 1999. He started teaching electronic subjects and shifted to electronics engineering. After retirement from NIT in 1999, he continued to work as professor in institutes around Delhi. Currently, he is working as professor in Electronics & Communication Engineering at Noida Institute of Engineering and Technology, Greater Noida, U.P., India. Prof. Singh was a member of IEEE from 1974 to 1991. At present Dr. Singh is a fellow of I.E.T.E., India.28。
超声波测距系统外文文献翻译

=======大学本科生毕业设计外文文献及中文翻译文献题目: ULTRASONIC RANGING SYSTEM 文献出处: United States Patent译文题目:超声波测距系统学生:指导教师:专业班级:自动化11-4学号: 110601140416电气信息工程学院2014年5月1日超声波测距系统摘要超声波测距系统,是指选择性地激励一个变压器,使之产生换能器驱动信号。
超声换能器发射的超声波脉冲用于响应驱动信号然后接收到一个在超声波信号发出之后的回波信号。
分路开关接在变压器的绕组上,当超声波信号的传输在允许的近距离范围内达到一个稳定的等级,分路开关选择性的闭合来阻止蜂鸣器报警。
第1章发明背景像在宝丽来相机中应用的可用范围测试系统,它们都是准确而且可靠的,但都不适用于近距离测距,举个例子,2到3英寸的距离内就不适用,所以他们在9英寸甚至更远的距离测距是可靠的。
它们可以应用在很多的应用程序中,但不适用于可移动机器人领域内。
机器人通常必须通过门口只有两三英寸的间隙,如果当可移动机器人被操作于避障模式下通过狭小空间,可能机器人的规避路径过于狭窄,此外,规避动作应该使偏指定的路径距离最小化。
近距离测距不用于超声波系统的一个原因是,近距离输出脉冲输出太长以至于它重叠在回波脉冲上,即使输出脉冲缩短,输出脉冲仍然重叠回波脉冲,因为声音紧跟着输出脉冲。
备中产生的回波信号脉冲的范围为100毫伏,但设置传感器响应所必需的电路回声脉冲是大约150伏到300伏之间。
因此即使是最小的声波也会盖过回声信号。
事实上,dual-diode钳位电路用于将150伏降低到二极管的击穿电压,即0.7伏特。
但是这700毫伏足以盖过100毫伏的回波信号。
目前系统需要50毫秒将300伏特的峰值发射电压降到0.7伏特,且额外需要500到600毫秒的时间将它稳定在1毫伏范围。
第2章发明总结本发明可以提供一种改进的超声波测距系统。
本发明也可以提供一个改进的多通道超声波测距系统。
超声波测距外文翻译

超声波测距摘要:本演示处理了测量距离的超声波传感器在当前环境中的准确性。
作为一个测量传感器的选择SFR08型配备了允许寻址的I ²C 通信接口。
这一事实使得创建传感器阵列变得简单。
控制和可视化系统是基于PC PC。
NI USB 8451是作为通信卡使用的。
验证测量的目标是确定实际的传感器精度,特别是当测量较长的距离。
当评估传感器的精度时,不包括在所测量的数据的温度补偿。
关键词:超声波传感器,I ²C 通信接口,虚拟仪器1 1 简介简介超声波传感器通常用于自动化的任务来测量距离,位置变化,电平测量,如存在检测器或在特殊应用中,例如,当测量透明材料的纯度。
它们是基于测量超声波的传播时间的原则。
这一原则确保可靠的检测是独立的颜色渲染的对象或其表面的设计和类型。
它可以可靠地检测甚至液体,散装材料,透明物体,玻璃等材料。
他们使用的另一个参数是他们在侵略性的环境中使用,不是非常敏感的污垢和测量距离的可能性。
超声波传感器在许多机械设计中被制造。
对于实验室用途,用于发射器和接收器单独或在一个单一的简单的住房,对于工业用途,往往建造坚固的金属外壳。
有些类型允许您使用电位计或数字来调整灵敏度。
此外,输出可以在统一的版本中或直接以数字形式的模拟信号直接中。
就传感器来说,可以通过通信接口连接到PC ,它是可以设置所有传感器的工作范围和测量距离的详细参数。
2 2 超声测量超声测量超声对环境中的声音具有相似的传播特性。
这是机械振动的粒子环境。
超声波可以在气体、液体和固体中传播。
对于超声波通常被认为是一个频率高于20千赫的声音。
千赫的声音。
根据超声波的用途可以分为两类: 主动超声:当应用表现出物理或化学效应。
生成的输出达到更高的值。
超声波用于清洁,焊接,钻孔等。
被动超声;输出是在低得多(通常是小)值产生的对比度。
他的主要应用领域是测量距离,检测材料的缺陷和材料的厚度,测量液体和气体的流量,以及医疗保健的诊断。
超声测距外文-超声波距离和速度利用互相关方法对LPM信号测量
Ultrasonic distance and velocity measurement using a pair of LPM signals for cross-correlation method:Improvement of Doppler-shift compensation and examination of Doppler velocity estimation超声波距离和速度利用互相关方法对LPM信号测量:多普勒频移补偿和多普勒速度估计检测的改进数据来源Elsevier Journal Elsevier期刊刊物名Ultrasonics, 2012, Vol.52 (7), pp.873-879 超声波,2012,卷(7),pp.873-879 作者Shinnosuke Hirata, Minoru Kuribayashi Kurosawashinnosuke平田,稔栗林黑泽明单位机械工程与智能系统1,信息工程学院,电子通信,1-5-1 chofugaoka e4-329,,,布,东京182-8585大学,日本信息处理系,跨学科研究生科学与工程学院,东京工业大学,4259首席人事官g2-32,长津田,绿区,横滨,神奈川226-8502,日本AbstractReal-time distance measurement of a moving object with high accuracy and high resolution using an ultrasonic wave is difficult due to the influence of the Doppler effect or the limit of the calculation cost of signal processing. An over-sampling signal processing method using a pair of LPM signals has been proposed for ultrasonic distance and velocity measurement of moving objects with high accuracy and high resolution. The proposed method consists of cross correlation by single-bit signal processing, high-resolution Doppler velocity estimation with wide measurement range and low-calculation-cost Doppler-shift compensation. The over-sampling cross-correlation function is obtained from cross correlation by single-bit signal processing with low calculation cost. The Doppler velocity and distance of the object are determined from the peak interval and peak form in the cross-correlation function by the proposed method of Doppler velocity estimation and Doppler-shift compensation. In this paper, the proposed method of Doppler-shift compensation is improved. Accuracy of the determined distance was improved from approximately within ±140 μm in the previous method to approximately within ±10μm in computer simulations. Then, the proposed method of Doppler velocity estimation is evaluated. In computer simulations, accuracy of the determined Doppler velocity and摘要实时测量移动物体的高精度和高分辨率超声波存在的多普勒效应或信号处理的计算成本的限制的影响。
单片机-外文翻译-外文文献-英文文献-基于单片机的超声波测距系统的研究与设计
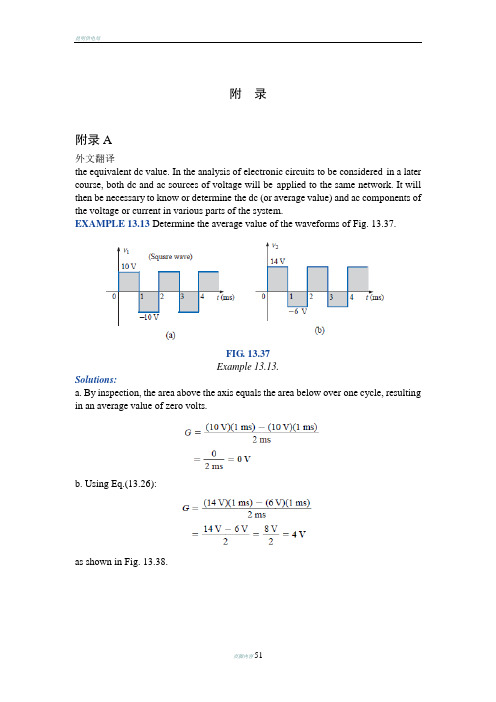
附录附录A外文翻译the equivalent dc value. In the analysis of electronic circuits to be considered in a later course, both dc and ac sources of voltage will be applied to the same network. It will then be necessary to know or determine the dc (or average value) and ac components of the voltage or current in various parts of the system.EXAMPLE 13.13 Determine the average value of the waveforms of Fig. 13.37.FIG. 13.37Example 13.13.Solutions:a. By inspection, the area above the axis equals the area below over one cycle, resulting in an average value of zero volts.b. Using Eq.(13.26):as shown in Fig. 13.38.In reality, the waveform of Fig. 13.37(b) is simply the square wave of Fig. 13.37(a) with a dc shift of 4 V; that is v2 =v1 + 4 VEXAMPLE 13.14 Find the average values of the following waveforms over one full cycle:a.Fig. 13.39.b. Fig. 13.40.Solutions:We found the areas under the curves in the preceding example by using a simple geometric formula. If we should encounter a sine wave or any other unusual shape, however, we must find the area by some other means. We can obtain a good approximation of the area by attempting to reproduce the original wave shape using a number of small rectangles or other familiar shapes, the area of which we already know through simple geometric formulas. For example,the area of the positive (or negative) pulse of a sine wave is 2Am.Approximating this waveform by two triangles (Fig. 13.43), we obtain(using area1/2 base height for the area of a triangle) a rough idea of the actual area:A closer approximation might be a rectangle with two similar triangles(Fig. 13.44):which is certainly close to the actual area. If an infinite number of forms were used, an exact answer of 2Am could be obtained. For irregular waveforms, this method can be especially useful if data such as the average value are desired. The procedure of calculus that gives the exact solution 2Am is known as integration. Integration is presented here only to make the method recognizable to the reader; it is not necessary to be proficient in its use to continue with this text. It is a useful mathematical tool, however,and should be learned. Finding the area under the positive pulse of a sine wave using integration, we havewhere ∫ is the sign of integration, 0 and p are the limits of integration, Am sin a is the function to be integrated, and d a indicates that we are integrating with respect to a. Integrating, we obtainSince we know the area under the positive (or negative) pulse, we can easily determine the average value of the positive (or negative) region of a sine wave pulse by applying Eq. (13.26):For the waveform of Fig. 13.45,EXAMPLE 13.15 Determine the average value of the sinusoidal waveform of Fig.13.46.Solution: By inspection it is fairly obvious thatthe average value of a pure sinusoidal waveform over one full cycle iszero.EXAMPLE 13.16 Determine the average value of the waveform of Fig. 13.47.Solution: The peak-to-peak value of the sinusoidal function is16 mV +2 mV =18 mV. The peak amplitude of the sinusoidal waveform is, therefore, 18 mV/2 =9 mV. Counting down 9 mV from 2 mV(or 9 mV up from -16 mV) results in an average or dc level of -7 mV,as noted by the dashed line of Fig. 13.47.EXAMPLE 13.17 Determine the average value of the waveform of Fig. 13.48.Solution:EXAMPLE 13.18 For the waveform of Fig. 13.49, determine whether the average value is positive or negative, and determine its approximate value.Solution: From the appearance of the waveform, the average value is positive and in the vicinity of 2 mV. Occasionally, judgments of this type will have to be made. InstrumentationThe dc level or average value of any waveform can be found using a digital multimeter (DMM) or an oscilloscope. For purely dc circuits,simply set the DMM on dc, and read the voltage or current levels.Oscilloscopes are limited to voltage levels using the sequence of steps listed below:1. First choose GND from the DC-GND-AC option list associated with each vertical channel. The GND option blocks any signal to which the oscilloscope probe may be connected from entering the oscilloscope and responds with just a horizontal line. Set the resulting line in the middle of the vertical axis on the horizontal axis, as shown in Fig. 13.50(a).2. Apply the oscilloscope probe to the voltage to be measured (if not already connected), and switch to the DC option. If a dc voltage is present, the horizontal line will shift up or down, as demonstrated in Fig. 13.50(b). Multiplying the shift by the vertical sensitivity will result in the dc voltage. An upward shift is a positive voltage (higherpotential at the red or positive lead of the oscilloscope), while a downward shift is a negative voltage (lower potential at the red or positive lead of the oscilloscope). In general,1. Using the GND option, reset the horizontal line to the middle of the screen.2. Switch to AC (all dc components of the signal to which the probe is connected will be blocked from entering the oscilloscope—only the alternating, or changing, components will be displayed).Note the location of some definitive point on the waveform, such as the bottom of the half-wave rectified waveform of Fig. 13.51(a); that is, note its position on the vertical scale. For the future, whenever you use the AC option, keep in mind that the computer will distribute the waveform above and below the horizontal axis such that the average value is zero; that is, the area above the axis will equal the area below.3. Then switch to DC (to permit both the dc and the ac components of the waveform to enter the oscilloscope), and note the shift in the chosen level of part 2, as shown in Fig.13.51(b). Equation(13.29) can then be used to determine the dc or average value of the waveform. For the waveform of Fig. 13.51(b), the average value is aboutThe procedure outlined above can be applied to any alternating waveform such as the one in Fig. 13.49. In some cases the average value may require moving the starting position of the waveform under the AC option to a different region of the screen or choosing a higher voltage scale. DMMs can read the average or dc level of any waveform by simply choosing the appropriate scale.13.7 EFFECTIVE (rms) V ALUESThis section will begin to relate dc and ac quantities with respect to the power delivered to a load. It will help us determine the amplitude of a sinusoidal ac current required to deliver the same power as a particular dc current. The question frequently arises, How is it possible for a sinusoidal ac quantity to deliver a net power if, over a full cycle, the net current in any one direction is zero (average value 0)? It would almost appear that the power delivered during the positive portion of the sinusoidal waveform is withdrawn during the negative portion, and since the two are equal in magnitude, the net power delivered is zero. However, understand that irrespective of direction, current of any magnitude through a resistor will deliver power to that resistor. In other words, during the positive or negative portions of a sinusoidal ac current, power is being delivered at eachinstant of time to the resistor. The power delivered at each instant will, of course, vary with the magnitude of the sinusoidal ac current, but there will be a net flow during either the positive or the negative pulses with a net flow over the full cycle. The net power flow will equal twice that delivered by either the positive or the negative regions of sinusoidal quantity. A fixed relationship between ac and dc voltages and currents can be derived from the experimental setup shown in Fig. 13.52. A resistor in a water bath is connected by switches to a dc and an ac supply. If switch 1 is closed, a dc current I, determined by the resistance R and battery voltage E, will be established through the resistor R. The temperature reached by the water is determined by the dc power dissipated in the form of heat by the resistor.If switch 2 is closed and switch 1 left open, the ac current through the resistor will have a peak value of Im. The temperature reached by the water is now determined by the ac power dissipated in the form of heat by the resistor. The ac input is varied until the temperature is the same as that reached with the dc input. When this is accomplished, the average electrical power delivered to the resistor R by the ac source is the same as that delivered by the dc source. The power delivered by the ac supply at any instant of time isThe average power delivered by the ac source is just the first term, since the average value of a cosine wave is zero even though the wave may have twice the frequency of the original input current waveform. Equating the average power delivered by the ac generator to that delivered by the dc source,which, in words, states thatthe equivalent dc value of a sinusoidal current or voltage is 1/2or 0.707 of its maximum value.The equivalent dc value is called the effective value of the sinusoidal quantity.In summary,As a simple numerical example, it would require an ac current with a peak value of 2 (10) 14.14 A to deliver the same power to the resistor in Fig. 13.52 as a dc current of 10 A. The effective value of any quantity plotted as a function of time can be found by using the following equation derived from the experiment just described:which, in words, states that to find the effective value, the function i(t) must first be squared. After i(t) is squared, the area under the curve isfound by integration. It is then divided by T, the length of the cycle or the period of the waveform, to obtain the average or mean value of thesquared waveform. The final step is to take the square root of the meanvalue. This procedure gives us another designation for the effectivevalue, the root-mean-square (rms) value. In fact, since the rms term isthe most commonly used in the educational and industrial communities,it will used throughout this text. EXAMPLE 13.19 Find the rms values of the sinusoidal waveform in each part of Fig.13.53.Solution: For part (a), I rms 0.707(12 10 3 A) 8.484 mA.For part (b), again I rms 8.484 mA. Note that frequency did notchange the effective value in (b) above compared to (a). For part (c),V rms 0.707(169.73 V) 120 V, the same as available from a home outlet. EXAMPLE 13.20 The 120-V dc source of Fig. 13.54(a) delivers 3.6 W to the load. Determine the peak value of the applied voltage (Em) and the current (Im) if the ac source [Fig. 13.54(b)] is to deliver the same power to the load.Solution:EXAMPLE 13.21 Find the effective or rms value of the waveform of Fig. 13.55.Solution:EXAMPLE 13.22 Calculate the rms value of the voltage of Fig. 13.57.Solution:EXAMPLE 13.23 Determine the average and rms values of the square wave of Fig.13.59.Solution: By inspection, the average value is zero.The waveforms appearing in these examples are the same as thoseused in the examples on the average value. It might prove interesting tocompare the rms and average values of these waveforms.The rms values of sinusoidal quantities such as voltage or currentwill be represented by E and I. These symbols are the same as thoseused for dc voltages and currents. To avoid confusion, the peak valueof a waveform will always have a subscript m associated with it: Im sin q t. Caution: When finding the rms value of the positive pulse of asine wave, note that the squared area is not simply (2Am)2 4A2m; itmust be found by a completely new integration. This will always bethe case for any waveform that is not rectangular.A unique situation arises if a waveform has both a dc and an ac componentthat may be due to a source such as the one in Fig. 13.61. Thecombination appears frequently in the analysis of electronic networkswhere both dc and ac levels are present in the same system.The question arises, What is the rms value of the voltage vT? Onemight be tempted to simply assume that it is the sum of the rms valuesof each component of the waveform; that is, VT rms 0.7071(1.5 V) 6 V 1.06 V 6 V 7.06 V. However, the rms value is actuallydetermined bywhich for the above example is直流值相等。
毕业论文外文文献翻译Ultrasonic-ranging-system-design超声测距系统设计

毕业设计(论文)外文文献翻译文献、资料中文题目:超声测距系统设计文献、资料英文题目:Ultrasonic ranging system design 文献、资料来源:文献、资料发表(出版)日期:院(部):专业:班级:姓名:学号:指导教师:翻译日期: 2017.02.14Ultrasonic ranging system designPublication title: Sensor Review. Bradford: 1993.Vol.ABSTRACT: Ultrasonic ranging technology has wide using worth in many fields, such as the industrial locale, vehicle navigation and sonar engineering. Now it has been used in level measurement, self-guided autonomous vehicles, fieldwork robots automotive navigation, air and underwater target detection, identification, location and so on. So there is an important practicing meaning to learn the ranging theory and ways deeply. To improve the precision of the ultrasonic ranging system in hand, satisfy the request of the engineering personnel for the ranging precision, the bound and the usage, a portable ultrasonic ranging system based on the single chip processor was developed.Keywords: Ultrasound, Ranging System, Single Chip Processor1. IntroductiveWith the development of science and techno logy, the improvement of people’s standard of living, speeding up the development and construction of the city. Urban drainage system have greatly developed their situation is construction improving. However, due to historical reasons many unpredictable factors in the synthesis of her time, the city drainage system. In particular drainage system often lags behind urban construction. Therefore, there are often good building excavation has been building facilities to upgrade the drainage system phenomenon. It brought to the city sewage, and it is clear to the city sewage and drainage culvert in the sewage treatment system. Comfort is very important to people’s lives. Mobile robots designed to clear the drainage culvert and the automatic control system Free sewage culvert clear guarantee robots, the robot is designed to clear the culvert sewage to the core. Control system is the core component of the development of ultrasonic range finder. Therefore, it is very important to design a good ultrasonic range finder.2. A principle of ultrasonic distance measurementThe application of AT89C51:SCM is a major piece of computer components are integrated into the chip micro-computer. It is a multi-interface and counting on the micro-controller integration, and intelligence products are widely used in industrial automation. and MCS-51 microcontroller is a typical and representative.Microcontrollers are used in a multitude of commercial applications such as modems, motor-control systems, air conditioner control systems, automotive engine and among others. The high processing speed and enhanced peripheral set of these microcontrollers make them suitable for such high-speed event-based applications. However, these critical application domains also require that these microcontrollers are highly reliable. The high reliability and low market risks can be ensured by a robust testing process and a proper tools environment for the validation of these microcontrollers both at the component and at the system level. Intel Plaform Engineering department developed an object-oriented multi-threaded test environment for the validation of its AT89C51 automotive microcontrollers. The goals of this environment was not only to provide a robust testing environment for the AT89C51 automotive microcontrollers, but to develop an environment which can be easily extended and reused for the validation of several other future microcontrollers. The environment was developed in conjunction with Microsoft Foundation Classes(AT89C51).1.1 Features* Compatible with MCS-51 Products* 2Kbytes of Reprogrammable Flash MemoryEndurance: 1,000Write/Erase Cycles* 2.7V to 6V Operating Range* Fully Static operation: 0Hz to 24MHz* Two-level program memory lock* 128x8-bit internal RAM* 15programmable I/O lines* Two 16-bit timer/counters* Six interrupt sources*Programmable serial UART channel* Direct LED drive output* On-chip analog comparator* Low power idle and power down modes1.2 DescriptionThe AT89C2051 is a low-voltage, high-performance CMOS 8-bit microcomputer with 2Kbytes of flash programmable and erasable read only memory (PEROM). The device is manufactured using Atmel’s high density nonvolatile memory technology and is compatible with the industry standard MCS-51 instruction set and pinout. By combining a versatile 8-bit CPU with flash on a monolithic chip, the Atmel AT89C2051 is a powerful microcomputer which provides a highly flexible and cost effective solution to many embedded control applications.The AT89C2051 provides the following standard features: 2Kbytes of flash,128bytes of RAM, 15 I/O lines, two 16-bit timer/counters, a five vector two-level interrupt architecture, a full duplex serial port, a precision analog comparator, on-chip oscillator and clock circuitry. In addition, the AT89C2051 is designed with static logicfor operation down to zero frequency and supports two software selectable power saving modes. The idle mode stops the CPU while allowing the RAM, timer/counters, serial port and interrupt system to continue functioning. The power down mode saves the RAM contents but freezer the oscillator disabling all other chip functions until the next hardware reset.1.3 Pin Configuration1.4 Pin DescriptionVCC Supply voltage.GND Ground.Prot 1Prot 1 is an 8-bit bidirectional I/O port. Port pins P1.2 to P1.7 provide internal pullups. P1.0 and P1.1 require external pullups. P1.0 and P1.1 also serve as the positive input (AIN0) and the negative input (AIN1), respectively, of the on-chip precision analog comparator. The port 1 output buffers can sink 20mA and can drive LED displays directly. When 1s are written to port 1 pins, they can be used as inputs. When pins P1.2 to P1.7 are used as input and are externally pulled low, they will source current (IIL) because of the internal pullups.Port 3Port 3 pins P3.0 to P3.5, P3.7 are seven bidirectional I/O pins with internal pullups. P3.6 is hard-wired as an input to the output of the on-chip comparator and is not accessible as a general purpose I/O pin. The port 3 output buffers can sink 20mA. When 1s are written to port 3 pins they are pulled high by the internal pullups and can be used as inputs. As inputs, port 3 pins that are externally being pulled low will source current (IIL) because of the pullups.Port 3 also serves the functions of various special features of the AT89C2051 as listed below.1.5 Programming the FlashThe AT89C2051 is shipped with the 2 Kbytes of on-chip PEROM code memory array in the erased state (i.e., contents=FFH) and ready to be programmed. The code memory array is programmed one byte at a time. Once the array is programmed, to re-program any non-blank byte, the entire memory array needs to be erased electrically.Internal address counter: the AT89C2051 contains an internal PEROM address counter which is always reset to 000H on the rising edge of RST and is advanced applying a positive going pulse to pin XTAL1.Programming algorithm: to program the AT89C2051, the following sequence is recommended.1. power-up sequence:Apply power between VCC and GND pins Set RST and XTAL1 to GNDWith all other pins floating , wait for greater than 10 milliseconds2. Set pin RST to ‘H’ set pin P3.2 to ‘H’3. Apply the appropriate combination of ‘H’ or ‘L’ logic to pins P3.3, P3.4, P3.5,P3.7 to select one of the programming operations shown in the PEROM programming modes table.To program and Verify the Array:4. Apply data for code byte at location 000H to P1.0 to P1.7.5.Raise RST to 12V to enable programming.5. Pulse P3.2 once to program a byte in the PEROM array or the lock bits. The byte-write cycle is self-timed and typically takes 1.2ms.6. To verify the programmed data, lower RST from 12V to logic ‘H’ level and set pins P3.3 to P3.7 to the appropriate levels. Output data can be read at the port P1 pins.7. To program a byte at the next address location, pulse XTAL1 pin once to advance the internal address counter. Apply new data to the port P1 pins.8. Repeat steps 5 through 8, changing data and advancing the address counter for the entire 2 Kbytes array or until the end of the object file is reached.9. Power-off sequence: set XTAL1 to ‘L’ set RST to ‘L’Float all other I/O pins Turn VCC power off2.1 The principle of piezoelectric ultrasonic generatorPiezoelectric ultrasonic generator is the use of piezoelectric crystal resonators to work. Ultrasonic generator, the internal structure as shown, it has two piezoelectric chip and a resonance plate. When it’s two plus pulse signal, the frequency equal to the intrinsic piezoelectric oscillation frequency chip, the chip will happen piezoelectric resonance, and promote the development of plate vibration resonance, ultrasound is generated. Conversely, it will be for vibration suppression of piezoelectric chip, the mechanical energy is converted to electrical signals, then it becomes the ultrasonic receiver.The traditio nal way to determine the moment of the echo’s arrival is based on thresholding the received signal with a fixed reference. The threshold is chosen well above the noise level, whereas the moment of arrival of an echo is defined as the first moment the echo signal surpasses that threshold. The intensity of an echo reflecting from an object strongly depends on the object’s nature, size and distance from the sensor. Further, the time interval from the echo’s starting point to the moment when it surpasses the threshold changes with the intensity of the echo. As a consequence, a considerable error may occur even two echoes with different intensities arriving exactly at the same time will surpass the threshold at different moments. The stronger one will surpass the threshold earlier than the weaker, so it will be considered as belonging to a nearer object.2.2 The principle of ultrasonic distance measurementUltrasonic transmitter in a direction to launch ultrasound, in the moment to launch the beginning of time at the same time, the spread of ultrasound in the air, obstacles on his way to return immediately, the ultrasonic reflected wave received by the receiverimmediately stop the clock. Ultrasound in the air as the propagation velocity of 340m/s, according to the timer records the time t, we can calculate the distance between the launch distance barrier(s), that is: s=340t / 23. Ultrasonic Ranging System for the Second Circuit DesignSystem is characterized by single-chip microcomputer to control the use of ultrasonic transmitter and ultrasonic receiver since the launch from time to time, single-chip selection of 875, economic-to-use, and the chip has 4K of ROM, to facilitate programming.3.1 40 kHz ultrasonic pulse generated with the launchRanging system using the ultrasonic sensor of piezoelectric ceramic sensorsUCM40, its operating voltage of the pulse signal is 40kHz, which by the single-chip implementation of the following procedures to generate.puzel: mov 14h, # 12h; ultrasonic firing continued 200msHere: cpl p1.0; output 40kHz square wavenop;nop;nop;djnz 14h, here;retRanging in front of single-chip termination circuit P1.0 input port, single chip implementation of the above procedure, the P1.0 port in a 40kHz pulse output signal, after amplification transistor T, the drive to launch the first ultrasonic UCM40T, issued 40kHz ultrasonic pulse, and the continued launch of 200ms. Ranging the right and the left side of the circuit, respectively, then input port P1.1 and P1.2, the working principle and circuit in front of the same location.3.2 Reception and processing of ultrasonicUsed to receive the first launch of the first pair UCM40R, the ultrasonic pulse modulation signal into an alternating voltage, the op-amp amplification IC1A and after polarization IC1B to IC2. IC2 is locked loop with audio decoder chip LM567, internal voltage-controlled oscillator center frequency of f0=1/1.1R8C3, capacitor C4 determinetheir target bandwidth. R8-conditioning in the launch of the high jump 8 feet into a low-level, as interrupt request signals to the single-chip processing.Ranging in front of single-chip termination circuit output port INT0 interrupt the highest priority, right or left location of the output circuit with output gate IC3A access INT1 port single-chip, while single-chip P1.3 and P1.4 received input IC3A, interrupted by the process to identify the source of inquiry to deal with, interrupt priority level for the first left right after. Part of the source code is as follows:Receivel: push pswpush accclr ex1; related external interrupt 1jnb p1.1, right; P1.1 pin to 0, ranging from right to interrupt service routine circuitjnb p1.2, left; P1.2 pin to 0, to the left ranging circuit interrupt service routinereturn: SETB EX1; open external interrupt 1pop accpop pswretiright: …; right location entrance circuit interrupt service routineAjmp Returnleft: …; left ranging entrance circuit interrupt service routineAjmp Return3.3 The calculation of ultrasonic propagation timeWhen you start firing at the same time start the single-chip circuitry within the timer T0, the use of timer counting function records the time and the launch of ultrasonic reflected wave received time. When you receive the ultrasonic reflected wave, the receiver circuit output a negative jump in the end of INT0 or INT1 interrupt request generates a signal, single-chip microcomputer in response to external interrupt request, the implementation of the external interrupt service subroutine, read the time difference, calculating the distance. Some of its source code is as follows:RECEIVE0: PUSH PSWPUSH ACCCLR EX0; related external interrupt 0MOV R7, TH0; read the time valueMOV R6, TL0CLR CMOV A, R6SUBB A, #0BBH; calculate the time differenceMOV 31H, A; storage resultsMOV A, R7SUBB A, # 3CHMOV 30H, ASETB EX0; open external interrupt 0\POP ACCPOP PSWRETIFor a flat target, a distance measurement consists of two phases: a coarse measurement and a fine measurement:Step 1: Transmission of one pulse train to produce a simple ultrasonic wave.Step 2: Changing the gain of both echo amplifiers according to equation, until the echo is detected.Step 3: Detection of the amplitudes and zero-crossing times of both echoes.Step 4: Setting the gains of both echo amplifiers to normalize the output at, say 3 volts. Setting the period of the next pulses according to the: period of echoes. Setting the time window according to the data of step 2.Step 5: Sending two pulse trains to produce an interfered wave. Testing the zero-crossing times and amplitudes of the echoes. If phase inversion occurs in the echo, determine to otherwise calculate to by interpolation using the amplitudes near the trough. Derive t sub m1 and t sub m2.Step 6: Calculation of the distance y using equation.4、The ultrasonic ranging system software designSoftware is divided into two parts, the main program and interrupt service routine. Completion of the work of the main program is initialized, each sequence of ultrasonic transmitting and receiving control.Interrupt service routines from time to time to complete three of the rotation direction of ultrasonic launch, the main external interrupt service subroutine to read the value of completion time, distance calculation, the results of the output and so on.5、ConclusionsRequired measuring range of 30cm-200cm objects inside the plane to do a number of measurements found that the maximum error is 0.5cm, and good reproducibility. Single-chip design can be seen on the ultrasonic ranging system has a hardware structure is simple, reliable, small features such as measurement error. Therefore, it can be used not only for mobile robot can be used in other detection system.Thoughts: As for why the receiver do not have the transistor amplifier circuit, because the magnification well, integrated amplifier, but also with automatic gain control level, magnification to 76dB, the center frequency is 38k to 40k, is exactly resonant ultrasonic sensors frequency.6、Parking sensor6.1 Parking sensor introductionReversing radar, full name is "reversing the anti-collision radar, also known as" parking assist device, car parking or reversing the safety of assistive devices, ultrasonic sensors(commonly known as probes), controls and displays (or buzzer)and other components. To inform the driver around the obstacle to the sound or a moreintuitive display to lift the driver parking, reversing and start the vehicle around tovisit the distress caused by, and to help the driver to remove the vision deadends and blurred vision defects and improve driving safety.6.2 Reversing radar detection principleReversing radar, according to high-speed flight of the bats in thenight, not collided with any obstacle principles of design anddevelopment. Probe mounted on the rear bumper, according to different price and brand, the probe only ranging from two, three, four, six, eight,respectively, pipe around. The probe radiation, 45-degree angle up and downabout the search target. The greatest advantage is to explore lower than the bumper of the driver from the rear window is difficult to see obstacles, and the police, suchas flower beds, children playing in the squatting on the car.Display parking sensor installed in the rear view mirror, it constantlyremind drivers to car distance behindthe object distance to the dangerous distance, the buzzer starts singing, allow the driver to stop. When the gear lever linked into reverse gear, reversing radar, auto-start the work, the working range of 0.3 to 2.0 meters, so stop when the driver was very practical. Reversing radar is equivalent to an ultrasound probe for ultrasonic probe can be divided into two categories: First, Electrical, ultrasonic, the second is to use mechanical means to produce ultrasound, in view of the more commonly used piezoelectric ultrasonic generator, it has two power chips and a soundingboard, plus apulse signal when the poles, its frequency equal to the intrinsic oscillation frequency of the piezoelectric pressure chip will be resonant and drivenby the vibration of the sounding board, the mechanical energy into electrical signal, which became the ultrasonic probe works. In order to better study Ultrasonic and use up, people have to design and manufacture of ultrasonic sound, the ultrasonic probe tobe used in the use of car parking sensor. With this principle in a non-contactdetection technology for distance measurement is simple, convenient and rapid, easyto do real-time control, distance accuracy of practical industrial requirements. Parking sensor for ranging send out ultrasonic signal at a givenmoment, and shot in the face of the measured object back to the signal wave, reversing radar receiver to use statistics in the ultrasonic signal from the transmitter to receive echo signals calculate the propagation velocity in the medium, which can calculate the distance of the probe and to detect objects.6.3 Reversing radar functionality and performanceParking sensor can be divided into the LCD distance display, audible alarm, and azimuth directions, voice prompts, automatic probe detection function is complete, reversing radar distance, audible alarm, position-indicating function. A good performance reversing radar, its main properties include: (1) sensitivity, whether theresponse fast enough when there is an obstacle. (2) the existence of blind spots. (3) detection distance range.6.4 Each part of the roleReversing radar has the following effects: (1) ultrasonic sensor: used tolaunch and receive ultrasonic signals, ultrasonic sensors canmeasure distance. (2) host: after the launch of the sine wave pulse to the ultrasonic sensors, and process the received signal, to calculate the distance value, the data and monitor communication. (3) display or abuzzer: the receivinghost from the data, and display the distance value and provide differentlevels according to the distance from the alarm sound.6.5 Cautions1, the installation height: general ground: car before the installation of 45 ~55: 50 ~ 65cmcar after installation. 2, regular cleaningof the probe to prevent the fill. 3, do not use the hardstuff the probe surface cover will produce false positives or ranging allowed toprobe surface coverage, such as mud. 4, winter to avoid freezing. 5, 6 / 8 probe reversing radar before and after the probe is not free to swap may cause the ChangMing false positive problem. 6, note that the probe mounting orientation, in accordance with UP installation upward. 7, the probe is not recommended to install sheetmetal, sheet metal vibration will cause the probe resonance, resulting in false positives.超声测距系统设计原文出处:传感器文摘布拉福德:1993年超声测距技术在工业现场、车辆导航、水声工程等领域具有广泛的应用价值,目前已应用于物位测量、机器人自动导航以及空气中与水下的目标探测、识别、定位等场合。
- 1、下载文档前请自行甄别文档内容的完整性,平台不提供额外的编辑、内容补充、找答案等附加服务。
- 2、"仅部分预览"的文档,不可在线预览部分如存在完整性等问题,可反馈申请退款(可完整预览的文档不适用该条件!)。
- 3、如文档侵犯您的权益,请联系客服反馈,我们会尽快为您处理(人工客服工作时间:9:00-18:30)。
超声波测距毕业论文中英文对照资料外文翻译文献超声测距技术在工业现场、车辆导航、水声工程等领域都具有广泛的应用价值,目前已应用于物位测量、机器人自动导航以及空气中与水下的目标探测、识别、定位等场合。
因此,深入研究超声的测距理论和方法具有重要的实践意义。
为了进一步提高测距的精确度,满足工程人员对测量精度、测距量程和测距仪使用的要求,本文研制了一套基于单片机的便携式超声测距系统。
1随着技术的发展,人们生活水平的提高,城市发展建设加快,城市给排水系统也有较大展,其状况不断改善。
但是,由于历史原因合成时间住的许多不可预见因素,城市给排水系统,特别是排水系统往往落后于城市建设。
因此,经常出现开挖已经建设好的建筑设施来改造排水系统的现象。
城市污水给人们带来了困扰,因此箱涵的排污疏通对大城市给排水系统污水处理,人们生活舒适显得非常重要。
而设计研制箱涵排水疏通移动机器人的自动控制系统,保证机器人在箱涵中自由排污疏通,是箱涵排污疏通机器人的设计研制的核心部分。
控制系统核心部分就是超声波测距仪的研制。
因此,设计好的超声波测距仪就显得非常重要了。
2 波测距原理2.1压电式超声波发生器原理压电式超声波发生器实际上是利用压电晶体的谐振来工作的。
超声波发生器内部结构,它有两个压电晶片和一个共振板。
当它的两极外加脉冲信号,其频率等于压电晶片的固有振荡频率时,压电晶片将会发生共振,并带动共振板振动,便产生超声波。
反之,如果两电极间未外加电压,当共振板接收到超声波时,将压迫压电晶片作振动,将机械能转换为电信号,这时它就成为超声波接收器了。
测量脉冲到达时间的传统方法是以拥有固定参数的接收信号开端为基础的。
这个界限恰恰选于噪音水平之上,然而脉冲到达时间被定义为脉冲信号刚好超过界限的第一时刻。
一个物体的脉冲强度很大程度上取决于这个物体的自然属性尺寸还有它与传感器的距离。
进一步说,从脉冲起始点到刚好超过界限之间的时间段随着脉冲的强度而改变。
结果,一种错误便出现了——两个拥有不同强度的脉冲在不同时间超过界限却在同一时间到达。
强度较强的脉冲会比强度较弱的脉冲超过界限的时间早点,因此我们会认为强度较强的脉冲属于较近的物体。
2.2 声波测距原理超声波发射器向某一方向发射超声波,在发射时刻的同时开始计时,超声波在空气中传播,途中碰到障碍物就立即返回来,超声波接收器收到反射波就立即停止计时。
超声波在空气中的传播速度为 340m/s,根据计时器记录的时间 t,就可以计算出发射点距障碍物的距离s,即:s340t/23 波测距系统的电路设计系统的特点是利用单片机控制超声波的发射和对超声波自发射至接收往返时间的计时,单片机选用 C51,经济易用,且片内有 4K 的 ROM,便于编程。
3.1 40kHz 脉冲的产生与超声波发射测距系统中的超声波传感器采用UCM40 的压电陶瓷传感器,它的工作电压是40kHz 的脉冲信号,这由单片机执行下面程序来产生。
puzel: mov 14h 12h;超声波发射持续 200mshere:cpl p1.0 ;输出 40kHz 方波 nop ; nop ; nop ; djnz 14h,here;ret 前方测距电路的输入端接单片机 P1.0 端口,单片机执行上面的程序后,在 P1.0端口输出一个 40kHz 的脉冲信号,经过三极管 T 放大,驱动超声波发射头 UCM40T,发出 40kHz 的脉冲超声波,且持续发射 200ms。
右侧和左侧测距电路的输入端分别接 P1.1 和 P1.2 端口,工作原理与前方测距电路相同。
3.2超声波的接收与处理接收头采用与发射头配对的 UCM40R,将超声波调制脉冲变为交变电压信号,经 IC2运算放大器 IC1A 和 IC1B 两极放大后加至 IC2。
是带有锁定环的音频译码集成块LM567,内部的压控振荡器的中心频率f01/1.1R8C3,电容 C4 决定其锁定带宽。
调节 R8 在发射的载频上,则LM567 输入信号大于 25mV,输出端 8 脚由高电平跃变为低电平,作为中断请求信号,送至单片机处理. 前方测距电路的输出端接单片机 INT0 端口,中断优先级最高,左、右测距电路的输出通过与门 IC3A 的输出接单片机 INT1 端口,同时单片机 P1.3 和 P1.4 接到 IC3A的输入端,中断源的识别由程序查询来处理,中断优先级为先右后左。
部分源程序如下:receive1:push psw push acc clr ex1;关外部中断 1 jnb p1.1right;P1.1 引脚为 0转至右测距电路中断服务程序 jnb p1.2left;P1.2 引脚为 0转至左测距电路中断服务程序return: SETB EX1;开外部中断 1 pop acc pop psw retiright: ... ;右测距电路中断服务程序入口 ajmp returnleft: ... ;左测距电路中断服务程序入口 ajmp return3.3计算超声波传播时间在启动发射电路的同时启动单片机内部的定时器T0,利用定时器的计数功能记录超声波发射的时间和收到反射波的时间。
当收到超声波反射波时,接收电路输出端产生一个负跳变,在INT0 或INT1 端产生一个中断请求信号,单片机响应外部中断请求,执行外部中断服务子程序,读取时间差,计算距离。
其部分源程序如下:RECEIVE0:PUSH PSW PUSH ACC CLR EX0 ;关外部中断0 MOV R7 TH0 ;读取时间值MOV R6 TL0 CLR C MOV A R6 SUBB A 0BBH;计算时间差MOV 31H A ;存储结果MOV A R7 SUBB A 3CH MOV 30H A SETB EX0 ;开外部中断0 POP ACC POP PSW RETI 对于一个平坦的目标,距离测量包括两个阶段:粗糙的测量和精细测量。
第一步:脉冲的传送产生一种简单的超声波。
第二步:根据公式改变回波放大器的获得量直到回拨被检测到。
第三步:检测两种回波的振幅与过零时间。
第四步:设置回波放大器的所得来规格输出,假定是3 伏。
通过脉冲的周期设置下一个脉冲。
根据第二部的数据设定时间窗。
第五步:发射两串脉冲产生干扰波。
测量过零时间与回波的振幅。
如果逆向发生在回波中,决定要不通过在低气压插入振幅。
第六步:通过公式计算距离y。
4 波测距系统的软件设计软件分为两部分,主程序和中断服务程序。
主程序完成初始化工作、各路超声波发射和接收顺序的控制。
定时中断服务子程序完成三方向超声波的轮流发射,外部中断服务子程序主要完成时间值的读取、距离计算、结果的输出等工作。
5 对所要求测量范围 30cm200cm 内的平面物体做了多次测量发现,其最大误差为0.5cm,且重复性好。
可见基于单片机设计的超声波测距系统具有硬件结构简单、工作可靠、测量误差小等特点。
因此,它不仅可用于移动机器人,还可用在其它检测系统中。
思考:至于为什么接收不用晶体管做放大电路呢,因为放大倍数搞不好,集成放大电路,还带自动电平增益控制,放大倍数为 76dB,中心频率是 38k 到 40k,刚好是超声波传感器的谐振频率。
原文出处:传感器文摘布拉福德:1993年第13页摘要Ultrasonic ranging technology has wide using worth in many fields,such asthe industriallocale,vehicle navigation and sonar engineering.Now it has been used in level measurement,self-guided autonomous vehicles fieldwork robots automotive navigation,air and underwater targetdetection,identification,location and so on.So there is an important practicing meaning to learn theranging theory and ways deeply. To improve the precision of the ultrasonic ranging system in hand,satisfy the request of the engineering personnel for the ranging precision,the bound and the usage,aportable ultrasonic ranging system based on the single chip processor was developed1.With the development of science and technology the improvement of peoplesstandard of living speeding up the development and construction of the city. urbandrainage system have greatly developed their situation is constantly improving. Howeverdue to historical reasons many unpredictable factors in the synthesis of her time the citydrainage system. In particular drainage system often lags behind urban construction.Therefore there are often good building excavation has been building facilities to upgradethe drainage system phenomenon. It brought to the city sewage and it is clear to the citysewage and drainage culvert in the sewage treatment system. comfort is very important topeoples lives. Mobile robots designed to clear the drainage culvert and the automaticcontrol system Free sewage culvert clear guarantee robot the robot is designed to clear theculvert sewage to the core. Control System is the core component of the development ofultrasonic range finder. Therefore it is very important to design a good ultrasonic rangefinder.2. A principle of ultrasonic distance measurement2.1 The principle of piezoelectric ultrasonic generator Piezoelectric ultrasonic generator is the use of piezoelectric crystal resonators to work.Ultrasonic generator the internal structure as shown it has two piezoelectric chip and aresonance plate. When its two plus pulse signal the frequency equal to the intrinsicpiezoelectric oscillation frequency chip the chip will happen piezoelectric resonance andpromote the development of plate vibration resonance ultrasound is generated. Converselyif the two are not inter-electrode voltage when the board received ultrasonic resonance itwill be for vibration suppression of piezoelectric chip the mechanical energy is convertedto electrical signals then it becomes the ultrasonic receiver. The traditional way to determine the moment of the echos arrival is based onthresholding the received signal with a fixed reference. The threshold is chosen well abovethe noise level whereas the moment of arrival of an echo is defined as the first moment theecho signal surpasses that threshold. The intensity of an echo reflecting from an objectstrongly depends on the objects nature size and distance from the sensor. Further the timeinterval from the echos starting point to the moment when it surpasses the thresholdchanges with the intensity of the echo. As a consequence a considerable error may occurEven two echoes with different intensities arriving exactly at the same time will surpass thethreshold at different moments. The stronger one will surpass the threshold earlier than theweaker so it will be considered as belonging to a nearer object.2.2The principle of ultrasonic distance measurement Ultrasonic transmitter in a direction to launch ultrasound in the moment to launch thebeginning of time at the same time the spread of ultrasound in the air obstacles on his wayto return immediately the ultrasonic reflected wave received by the receiver immediatelystop the clock. Ultrasound in the air as the propagation velocity of 340m / s according tothe timer records the time t we can calculate the distance between the launch distancebarrier s that is: s 340t / 23.Ultrasonic Ranging System for the Second Circuit Design System is characterized by single-chip microcomputer to control the use of ultrasonictransmitter and ultrasonic receiver since the launch from time to time single-chip selectionof 8751 economic-to-use and the chip has 4K of ROM to facilitate programming. Circuitschematic diagram shown in Figure 2. Figure 1 circuit principle diagram3.1 40 kHz ultrasonic pulse generated with the launch Ranging system using the ultrasonic sensor of piezoelectric ceramic sensors UCM40its operating voltage of the pulse signal is 40kHz which by the single-chip implementationof the following procedures to generate.puzel: mov 14h 12h ultrasonic firing continued 200mshere: cpl p1.0 output 40kHz square wave nop nop nop djnz 14h here ret Ranging in front of single-chip termination circuit P1.0 input port single chipimplementation of the above procedure the P1.0 port in a 40kHz pulse output signal afteramplification transistor T the drive to launch the first ultrasonic UCM40T issued 40kHzultrasonic pulse and the continued launch of200ms. Ranging the right and the left side ofthe circuit respectively then input port P1.1 and P1.2 the working principle and circuit infront of the same location.3.2 Reception and processing of ultrasonic Used to receive the first launch of the first pair UCM40R the ultrasonic pulsemodulation signal into an alternating voltage the op-amp amplification IC1A and afterpolarization IC1B to IC2. IC2 is locked loop with audio decoder chip LM567 internalvoltage-controlled oscillator center frequency of f0 1/1.1R8C3 capacitor C4 determinetheir target bandwidth. R8-conditioning in the launch of the carrier frequency on theLM567 input signal is greater than 25mV the output from the high jump 8 feet into alow-level as interrupt request signals to the single-chip processing. Ranging in front of single-chip termination circuit output port INT0 interrupt thehighest priority right or left location of the output circuit with output gate IC3A accessINT1 port single-chip while single-chip P1.3 and P1.4 received input IC3A interrupted by the process to identify the source of inquiry to deal with interrupt priority level for thefirst left right after. Part of the source code is as follows:receive1: push psw push acc clr ex1 related external interrupt 1 jnb p1.1 right P1.1 pin to 0 ranging from right to interrupt serviceroutine circuit jnb p1.2 left P1.2 pin to 0 to the left ranging circuit interruptservice routinereturn: SETB EX1 open external interrupt 1 pop acc pop psw retiright: ... right location entrance circuit interrupt service routine Ajmp Returnleft: ... left Ranging entrance circuit interrupt service routine Ajmp Return3.3 The calculation of ultrasonic propagation time When you start firi ng at the same time start the single-chip circuitry within the timerT0 the use of timer counting function records the time and the launch of ultraso nicreflected wave received time. When you receive the ultrasonic reflected wave the receivercircuit outputs a negative jump in the end of INT0 or I NT1 interrupt request generates asignal single-chip microcomputer in respo nse to external interrupt request theimplementation of the external interrupt service subroutine read the time differencecalculating the distance . Some of its source code is as follows:RECEIVE0: PUSH PSWPUSH ACCCLR EX0; related external interrupt 0MOV R7, TH0; read the time valueMOV R6, TL0CLR CMOV A, R6SUBB A, # 0BBH; calculate the time differenceMOV 31H, A; storage resultsMOV A, R7SUBB A, # 3CHMOV 30H, ASETB EX0; open external interrupt 0POP ACCPOP PSWRETIFor a flat target, a distance measurement consists of two phases: a co arse measurement and. a fine measurement:Step 1: Transmission of one pulse train to produce a simple ultrasonic wave.Step 2: Changing the gain of both echo amplifiers according to equati -on , until the echo is detected.Step 3: Detection of the amplitudes and zero-crossing times of both e choes.Step 4: Setting the gains of both echo amplifiers to normalize the out put at, say 3 volts.Setting the period of the next pulses according to the :period of echoes. Setting the time window according to the data of step 2.Step 5: Sending two pulse trains to produce an interfered wave. Testi ng the zero-crossing times and amplitudes of the echoes. If phase inversio n occurs in the echo, determine to otherwise calculate to by interpolation using the amplitudes near the trough. Derive t sub m1 and t sub m2 .Step 6: Calculation of the distance y using equation .4. The ultrasonic ranging system software designSoftware is divided into two parts, the main program and interrupt se rvice routine. Completion of the work of the main program is initialized, each sequence of ultrasonic transmitting and receiving control.Interrupt service routines from time to time to complete three of the r otation direction of ultrasonic launch, the main external interrupt service s ubroutine to read the value of completion time, distance calculation, the r esults of the output and so on..5. ConclusionsRequired measuring range of 30cm ~ 200cm objects inside the plane to do a number of measurements found that the maximum error is 0.5cm, and good reproducibility. Single-chip design can be seen on the ultrasonic ranging system has a hardware structure is simple, reliable, small featur es such as measurement error. Therefore, it can be used not only for mob ile robot can be used in other detection systems.Thoughts: As for why the receiver do not have the transistor amplifie r circuit, because the magnification well, integrated amplifier, but also wit h automatic gain control level, magnification to 76dB, the center frequenc y is 38k to 40k, is exactly resonant ultrasonic sensors frequency.Ultrasonic ranging system design Publication title: Sensor Review. Bra dford: 1993. V ol. 13。