2010-Wireless Sensor Networks for Monitoring the Environmental Activities
VLSI_Implementation_for_Low_Noise_Power_Efficiency

Wireless Sensor Network, 2010, 2, 18-30doi:10.4236/wsn.2010.21003anuary 2010 (/journal/wsn/).Published Online JVLSI Implementation for Low Noise Power EfficiencyCellular Communication SystemsRondia MACK, Maher RIZKALLA, Paul SALAMA, Mohamed EL-SHARKAWY Department of Electrical and Computer Engineering, Indiana University Purdue University Indianapolis,Indianapolis, USAEmail:{mrizkall, psalama}@Received October 24, 2009; revised November 16, 2009; accepted November 25, 2009AbstractA low power model for Code Division Multiple Access (CDMA) based cellular communication system is developed. The dynamic power is minimized by reducing the frequency of the Phase Lock Loop (PLL) after lock is established. The paper addresses the feasibility of lowering the clock frequency of the processing unit that models the PLL is addressed and modulator/demodulator functions of the system while maintaining synchronization with the memory unit and other peripherals. The system is simulated with Matlab consider-ing various Signal-to-Noise Ratios (SNR). For a given SNR, the minimum frequency required for the PLL to maintain lock is determined. The Matlab file is translated to VHDL code, simulated and synthesized with Mentor tools, and the layout then generated. Mach-Pa 5-V software system from Mentor tools is utilized to estimate the power consumed by the simulated device. A Xilinx file is also generated and downloaded for Field Programmable Gate Arrays (FPGA) implementation. A 50 MHz clock frequency of the processing unit was first considered and then lowered to 20 MHz for the low power study. Lowering the base and clock fre-quency resulted in near 30% reduction in power.Keywords:Cellular Communication, CDMA, PLL, Harware, Xilinx, Matlab, Low Power1. IntroductionCellular phone systems require a large number of base stations in each city regardless of the size. An average large city can have hundreds of towers. In addition, each carrier in each city also runs one central office called the Mobile Telephone Switching Office (MTSO). This office handles all of the cellular phone connections to the land- based phone system and controls all of the base stations in the region. An on-chip PLL (Phase Lock Loop) gener-ates the internal clock at one of 16 frequencies ranging from 88 to 287 MHz based on a fixed 3.68 MHz input clock [1]. It is a system requirement that the chip return quickly from the idle state to normal operation with no such constraint on returning from the sleep state. Based on this determination and the 20 mW power budget in Idle, it was concluded that when the PLL power is below 2 mW then the PLL can run in Idle and remove the re-quirements on the PLL lock time. Thus, there is need for a very low power PLL dictated by the power budget in Idle [2].The TDA8012M is a low power PLL FM demodulator for satellite TV receivers [3]. It supports low power be-cause it has a sensitive PLL FM demodulator, and is used for the second Intermediate Frequency (IF) filter in satel-lite receivers. It also provides Automatic Gain Control (AGC) and Automatic Frequency Control (AFC) outputs that can be used to optimize the level and frequency of the input signal. During the searching procedure, the AFC output provides a signal which is used for carrier detection, high input sensitivity, and balanced two-pin Voltage Controlled Oscillator (VCO) and Carrier detec-tor.Low power filtering was researched by the digit-serial implementation method of all pass filter structure [4]. Also the general-order lossless and discrete integrator/ differentiator methods were involved. In low-power- filter implementation, digit-serial computation showed to be advantageous compared to bit-serial and parallel arithmetic [5]. The digital-serial processing elements are obtained using unfolding techniques. The implementa-tion is compared to a corresponding wave digital (WD) all pass filter implementation [6]. For low power con-sumption, ASIC and FPGA design architectures wereR. MACK ET AL. 19implemented for modulation/demodulation, Chebyshev scheme was used for filtering, QPSK for transmission, and CDMA/TDMA for channelization.2. ApproachPower reduction techniques include pipelining, parallel-ism, reducing clock cycles, and lowering the frequency that will also raise the stability issue for several elec-tronic components. In this paper, the PLL is one of the main sources to reduce power in the cell phone system. The values of I (t) and Q (t) represent the binary digits in QPSK format. The S input values represent the modulated output signal from the base station. Two mixers are needed for the Q (t) and I (t) variables, where Q(t)=cos (2πft+ϕ)S input, I(t)= )=cos(2πft+ϕ)S input S input; and mixer= cos(2πft+ϕ)S input.Several functions, such as the mixers in the demodu-lator, will not need simulation through the whole cycle, because the program is communicating or in phase with the incoming signal close to 100%. The program is then allowed to reduce its frequency by half the cycle to re-ceive the full value of an incoming signal. The phase angle depends on the PLL that is controlled by an enable switch (when the S input is in phase). The Matlab algo-rithm and VHDL codes give details on how the PLL was implemented. The Matlab model for the demodulator and PLL function are shown in Figure 1, and the frequency lowering algorithm is given in Figure 2. The PLL will force the frequency to be lowered based on when the output signals of the demodulator can reach its maximum value. This will cause the simulator to skip several vari-ables when the demodulator reaches its value at a faster pace before the end of each period.Figure 1. Matlab implementation of the Demodulator.R. MACK ET AL.20Figure 2. The frequency lowering algorithm.Table 1. PC instruction commands.Data from PC Commands0001 ALU C= A – B1001 ALU C= A + B0010 ALU C= A AND B0011 ALU C= A OR B0101 ALU C= A0110 ALU C= A mult B0100 Jump back to Register value0101 writetomemory1000 A=mem(B)1001 mem(B) = A1010 If(Z/=0),PC=value1011 If(Z=0),PC=value1100 PC=value1101 0000 A = B1101 0010 A greater than BTable 2. Floating numbers.Significant bits 6 5 4 3 2 1 0 Decimals 1 .5 .25 .125 .0625 .03125 .0115625Components such as adders/subtracters and multiplier divider were added to perform the math functions for the DSP chip. The ALU components, PC instruction, and floating numbers are given in Tables 1–3.Table 3. Add or subtract input command.Add or Subtract Z = 1 if B > A ALU Operate most sign bitA +B Null A + B Pos-A + -B Null A + B NegA + -B 0 A – B PosA + -B 1 B – A Neg-A + B 0 A – B Neg-A + B 1 B – A PosA –B 0 A – B PosA –B 1 B – A NegA – -B NULL A + B Pos-A – B NULL A + B Neg-A – -B 0 A – B Neg-A – -B 1 B – A Pos3. DesignWith increasing pipelining by N sections, the voltage may be reduced by V/N. The total power will be reduced byN2. Quadratic reduction in power consumption is one advantage of increasing pipelining. Another advantage is overhead that is typically much less than that of parallel-ism. This means less hardware objects are needed for pipelining compared to parallelism. There are disadvan-tages when using pipelining. Not all algorithms or pro-grams are recommended for pipelining. Adding a pipe-line structure to a program usually increases the error inR. MACK ET AL. 21branching.Figure 3 displays a block for a Xilinx board that is ca-pable of handling small designs to perform the various functions. It can perform the same tasks compared to an ASIC design and can be developed at a quicker rate. This Xilinx board was used to prove that the waveforms in Matlab and VHDL are capable of simulating in real time. Xilinx uses a different format to synthesize VHDL codes compared to ASIC Implementation. There were RAM and ROM chips that contain the same data information as in VHDL codes that were used in the Xilinx dictionary. This will save memory space inside the FPGA because of the familiarity format of the memory design. Figure 4 displays a command file to synthesize some of the same VHDL files that were synthesize in the ASIC design. To simulate this command file a user needs to type in the following command: fc2_shell –f cell16_xilinx. This command will also assign the input and output pins to the variable inside the main VHDL code. There were no errors after the last command. The next was to simulate the next command file in Figure 5. This file will create a bit file to be downloaded into the FPGA unit. If no errors have occurred then it will simulate the same way as it has simulated in Mentor Graphics.Figure 3. Xilinx FPGA board - XCQS30-TQ144. Figure 5. Command file for FPGAs unit.Figure 4. Command file for synthesizes.R. MACK ET AL .22Figure 6. Xilinx input and output connect.Figure 7. Transmitted output (Sout) with input (I mod, Q mod) at 200 Hz.Figure 6 displays components for 8 switches, 8 LEDs, 4 buttons, and a seven-segment display. For this design switches, LEDs, and buttons was able use to verify the electronic components works. Switch(8) was used to reset the FPGA microchip in the same way as it was go-ing to be used in Mentor Graphics. Switch(1) and switch(2) were used to input data for the modulation function. They represented the signals digitalout (Qmod) and digitalout1(Imod) respectively. The 8 LEDs, but-ton(1), and switch(3) were used to represent the output of the demodulation function. When button (1) is equal to zero(not pressed) it represents the first eight binary numbers of the output signal. When it is equal to one it represents the last eight binary numbers and LED(7) in-dicate if Iout or Qout is positive or negative. Switch(3) was used to indicate if the LEDs represent Iout or Qout. If switch(3) is equal to one then it will represent Iout, otherwise it will represent Qout. Button(2) was used to display the output results from the LEDs at the end ofevery period. All the input and output signals from the Xilinx board match with the input and output waveforms from Mentor Graphics, while being tested for verifica-tion. This proves that the microchip design would have worked if it were processed on an ASIC design chip.4. Results and DiscussionsA modulator function was written in Matlab to support the transmitter component. The QPSK method was used to output the signal Sout(time). The Sout variable is an analog signal that communicates through any base sta-tion with other cell phones. Figures 7–9 display the in-puts of the message codes with the output of the Sout transmitter with a frequency of 200Hz. Notice how the phase shifts in Sout(signal) when the inputs, Q(t) and I(t), change with respect to time. In Figure 10, the Q(demod) and I(demod) represent signals from the demodulatorR. MACK ET AL. 23Figure 8. Transmitted output (Sout) with inputs (I mod, Q mod) at 20,000 Hz.Figure 9. Transmitted output (Sout) with inputs (I mod, Q mod) at 2,000,000 Hz.Figure 10. In phase demodulation function.R. MACK ET AL .24Figure 11. Out of phase demodulation function.Figure 12. Searching the phase with a Phase Lock Loop.Figure 13. Searching for the exact phase with the Phase Lock Loop.R. MACK ET AL. 25function or receiver component when all signals are in phase. They determine whether the value of the code messages is either a 1 or -1 by sloping to its maximum value before the clock period starts over. Figure 11 dis-plays the same waveforms when they are out of phase. The Q(demod) and I(demod) do not reach their maxi-mum value at the same time at the end of every clock cycle. When this occurs the receiver is not detecting any signal or the demodulation mixer is out of phase with the incoming single (Sout).There are several ways to implement the PLL function inside the demodulator, depending on the communication software requirement. For this design the PLL is one of the main sources to reduce power in the cell phone sys-tem. Figure 12 displays waveforms to show that once the PLL is locked then the correct message symbol will be decoded. Several times the mixer from the demodulator can have the same phase with different amplitudes. Fig-ure 13 displays that the Q(demod) and I(demod) reach their maximum value but one or both values have the wrong value as the message code (Imod, Qmod). Initially, the electronic component inside the cell phone needs to know what sequence of message code it is supposed to receive before it freezes the PLL. The initial sequence message codes vary, depending on the communication network and the base station that will be described in the next section.Several filter functions was able to be tested to filter out noise for modulation signals. Programs to generate noise, such as white noise and fading noise (Rayleigh and Rician noises), were written to create noise for out-put modulated signals. The programs for filter functions were proved effective, allowing that multiple cell phone users to still communicate through the noise disturbance in the incoming signal. There were several algorithms that were developed to handle the type of noise to mini-mize the error in the message codes. Figure 14 displays a transmitter signal with two types of noise. A band pass filter technique (Butterworth and Chebyshev) was used to filter out white noise. The signal to noise ratio is a major factor to filter out the unwanted magnitude of the transmitted signal. Based on simulation comparisons, if the noise amplitude is more than half the size of the transmitted signal then there is a higher probability that an error will occur compared to a lesser amplitude noise signal. Figure 15 compares both of the filter functions that were simulated in the compiler and in the program algorithm to filter out the two frequencies that were out of range for the band pass filter. The outputs from both of the filter contain the same results after comparing them. Figures 16 through 19 displays several filter results that vary based on the maximum amplitude of white noise. Notice that the lower SNR decrease the higher probability that the receiver will not decode the mes-sage’s incoming signals. Figure 20 shows that the mes-sage code from CDMA that is capable of being demodu-lated. (The Matlab implementation for this is given in Figure 24). Figure 21 shows lowering the frequency. Figure 22 gives the tested waveforms as simulated with Mentor tools.Another test sample was used to test the modulation and demodulation process when they were initially out of phase. This will cause the signal values of digitalout and digitalout1 to not reach the maximum value of 1 or -1 at the end of each period. In Figure 23 the maximum value of the output at the end of each period have increased or decreased because it tried to find the exact phase for the Phase Lock Loop.5. ConclusionsThe tested waveforms that were viewed in Mentor Graphics matches with all the waveforms in Matlab. This means that the microprocessor is capable of performing modulation and demodulation techniques with otherFigure 14. Noise waveforms. Figure 15. Comparison of filters’ performance.R. MACK ET AL .26Figure 16. White noise 25% of message signal.Figure 17. White noise 100% of message signal. Figure 18. White noise 200% of message signal.Figure 19. White noise 400% of message signal.R. MACK ET AL .27Figure 20. CDMA process in Matlab.(a)(b)Figure 21. (a) Lower the frequency; (b) Lower the frequency with noise.R. MACK ET AL .28(a)(b)Figure 22. (a) Tested waveforms for the first two periods; (b) Tested waveform while lowering the frequency.R. MACK ET AL.29Figure 23. Tested waveforms while out of phase.Figure 24. Matlab implementation of CDMA.communications systems. Also, since the LEDs outputs from Xilinx matches with the waveforms in Mentor Gra- phics indicate that the Xilinx can be implemented as cell phone microcontroller or a base station controller. TheR. MACK ET AL.30methods were the basic functions that all cellular phones use for communication with the base station. There were ideas that were created to adjust several algorithm func-tions inside the DSP chip to save power. Lowering the frequency is the main method that was developed to save power in DSP chips compared to pipelining, parallelism, and reducing several algorithms for several functions such as the cos(x) and sin(x). There are several adjust-ments that might not have been recognized to simulate with the functions inside the main microchip controller. This study proves that these functions work in three dif-ferent real time compilers, which are Matlab, Mentor Graphics, and Xilinx. This proves that these methods can be developed in any type of microchip fabrication fac-tory. The Mach-Pa compiler in Mentor Graphics proves that if the frequency was lowered, it would automatically save power compared to when it is higher. This has been an interesting and challenging project to promote a better understanding of how the communication process work- ed with the base station and cell phones. Other compo-nents to have a better internal knowledge of working with the main microchip are the push buttons, screen display, microphone, speaker, and antenna for every cell phone.6. References[1]Montanaro, R. T. Witek, K. Anne, A. J. Black, E. M.Cooper, D. W. Dobberpuhl, P. M. Donahue, J. Eno, W.Hoeppner, D. Kruckemyer, T. H. Lee, P. C. M. Lin, L.Madden, D. Murray, M. H. Pearce, S. Santhanam, K. J.Snyder, R. Stehpany, and S. C. Thierauf, “A 160-MHz, 32-b, 0.5-W CMOS RISC microprocessor,”IEEE Journalof Solid-State Circuits, Vol. 31, No. 11, pp. 1703–1714, November 1996.[2] F. M. Gardner, “Phaselock techniques,” 2nd Edition, JohnWiley and Sons, New York, NY, 1979.[3]R. Philips, “Low power PLL FM demodulator for satelliteTV receivers, integrated circuits,” Trenton, NJ, 1996. [4]M. Vesterbacka, “Digit-serial implementation of LDI/LDD allpass filters,” Scottsdale, AZ, 2001.[5]H. Ming, O. Vainio, and M. Renfors, “Digit-serial designof a wave digital filter,” Proceedings of IEEE Instrumen-tation and Measurement Technology Conference, Vol. 1, pp. 542–545, 1999.[6] A. Fettweis, H. Levin, and A. Sedlmeyer, “Wave digitallattice filters,” International Journal of Circuit Theory andApplications, Vol. 2, pp. 203–211, June 1974.。
XBee无线传感器网络温度控
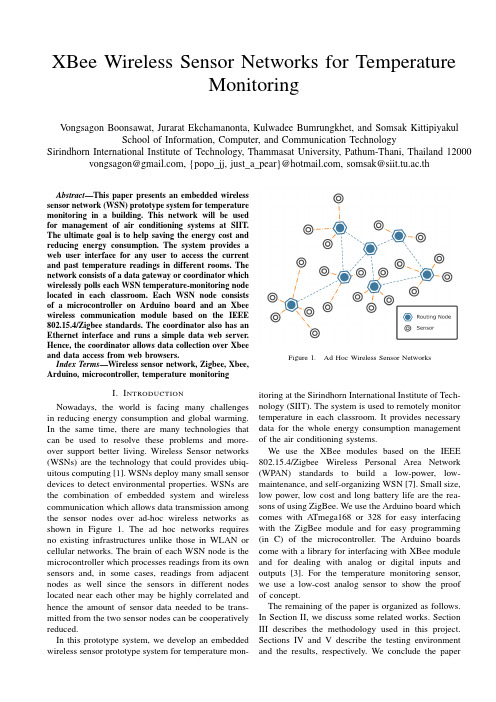
XBee Wireless Sensor Networks for TemperatureMonitoringV ongsagon Boonsawat,Jurarat Ekchamanonta,Kulwadee Bumrungkhet,and Somsak Kittipiyakul School of Information,Computer,and Communication TechnologySirindhorn International Institute of Technology,Thammasat University,Pathum-Thani,Thailand12000 vongsagon@,{popo_jj,just_a_pear}@,somsak@siit.tu.ac.thAbstract—This paper presents an embedded wireless sensor network(WSN)prototype system for temperature monitoring in a building.This network will be used for management of air conditioning systems at SIIT. The ultimate goal is to help saving the energy cost and reducing energy consumption.The system provides a web user interface for any user to access the current and past temperature readings in different rooms.The network consists of a data gateway or coordinator which wirelessly polls each WSN temperature-monitoring node located in each classroom.Each WSN node consists of a microcontroller on Arduino board and an Xbee wireless communication module based on the IEEE 802.15.4/Zigbee standards.The coordinator also has an Ethernet interface and runs a simple data web server. Hence,the coordinator allows data collection over Xbee and data access from web browsers.Index Terms—Wireless sensor network,Zigbee,Xbee, Arduino,microcontroller,temperature monitoringI.I NTRODUCTIONNowadays,the world is facing many challenges in reducing energy consumption and global warming. In the same time,there are many technologies that can be used to resolve these problems and more-over support better living.Wireless Sensor networks (WSNs)are the technology that could provides ubiq-uitous computing[1].WSNs deploy many small sensor devices to detect environmental properties.WSNs are the combination of embedded system and wireless communication which allows data transmission among the sensor nodes over ad-hoc wireless networks as shown in Figure 1.The ad hoc networks requires no existing infrastructures unlike those in WLAN or cellular networks.The brain of each WSN node is the microcontroller which processes readings from its own sensors and,in some cases,readings from adjacent nodes as well since the sensors in different nodes located near each other may be highly correlated and hence the amount of sensor data needed to be trans-mitted from the two sensor nodes can be cooperatively reduced.In this prototype system,we develop an embedded wireless sensor prototype system for temperaturemon-Figure1.Ad Hoc Wireless Sensor Networks itoring at the Sirindhorn International Institute of Tech-nology(SIIT).The system is used to remotely monitor temperature in each classroom.It provides necessary data for the whole energy consumption management of the air conditioning systems.We use the XBee modules based on the IEEE 802.15.4/Zigbee Wireless Personal Area Network (WPAN)standards to build a low-power,low-maintenance,and self-organizing WSN[7].Small size, low power,low cost and long battery life are the rea-sons of using ZigBee.We use the Arduino board which comes with ATmega168or328for easy interfacing with the ZigBee module and for easy programming (in C)of the microcontroller.The Arduino boards come with a library for interfacing with XBee module and for dealing with analog or digital inputs and outputs[3].For the temperature monitoring sensor, we use a low-cost analog sensor to show the proof of concept.The remaining of the paper is organized as follows. In Section II,we discuss some related works.Section III describes the methodology used in this project. Sections IV and V describe the testing environment and the results,respectively.We conclude the paperFigure2.System Diagramand discuss some future extensions of our current prototype in Section VI.II.R ELATED W ORKSThere are several WSN hardware platforms avail-able.In our prototype system,we chose our hardware platform to base on an Arduino board and an Xbee module.This was motivated by the SquidBee WSN platform developed by the Wireless Sensor Network Research Group[5].SquidBee is an open-source WSN platform,where each SquidBee Mote takes environ-mental parameters with its three sensors(humidity, temperature and lightness)and sends them wirelessly through the SquidBee network using ZigBee protocol. The hardware of each mote consists of an Arduino board,an Xbee shield that supports an Xbee module, and sensors.Although our prototype hardware plat-form is not optimized for WSN applications in term of cost,energy consumption,size,nor real-time appli-cation support,the platform allows easy development of a WSN due to the simplicity of programming an Arduino microcontroller board.Over the last decade,many WSN systems have been extensively developed and studied for numerous applications.An example of WSN systems is illus-trated in an automation in construction[6].The authors in[6]proposed a web-based building environmental monitoring system based on WSN.As in typical WSN systems,the proposed system in[6]consists of three main steps:data acquisition,data collection and data retrieval.Likewise,our prototype system also contains these three main steps.III.M ETHODOLOGYA.OverviewThe diagram of the system is shown in Figure2 and consists of a client computer which provides a web user interface to the system,a coordinator as a data collector and web server,and several end devices which provide sensor readings over Xbee communica-tion links.B.Design and DevelopmentThe system is divided into three main parts as following:1)User Interface:The User Interface communi-cates to the user via Ethernet and displays the result in a web browser.The User Interface is divided into two parts:∙Automatic display:In this part,it shows the data from every sensor via Web page in HTTP Response.Arduino duplicates itself as a Web-Server to generate HTTP Response in the format as shown in Figure3.∙Display according to an instruction:The user instructs from the webpage in HTTP Request,Figure3.HTTP Request and HTTP Response Messageswhose format is shown in Figure3.The HTTP request message is then sent to the Coordinator who is acting as the web server.The user can also request to read the temperature reading froma selected room(equivalently,a selected enddevice).2)Coordinator:The Coordinator is the center of system.It collects sensor readings from the sensors back to the user.The function of the collector is divided into two parts:Web-Server and Xbee Interface to the WSN.These two functions as implemented on the Arduino board.The hardware of the coordinator consists of an Arduino USB Board,Xbee Shield,and Ethernet Shield,as shown in Figure4.The Web-Server function uses the<Ethernet.h>library,while the Xbee Interface uses the<Xbee.h>library.Theflowchart of the coordinator is showing in Figure5.3)End Device:Each End Device has one or more temperature sensor inputs.The device waits for data reading request(i.e.,polling)from the Coordinator and then responses with the value from the sensor.The interfaces of End Device consists of two parts:Sensor Interface and Xbee Interface.These two parts work in Arduino USB Board,Xbee Shield and LM335A according to Figure5.The Sensor Interface receives data from the temperature sensor(LM335A),the tem-perature signal in V olts is read via an Arduino Analog Input pin(as A/D converted into digital value in the range0-1023,where0represents0V and1023 represents5V.We can convert the temperature value in V olt into degree Celsius according to the equation (1).The Xbee Interface uses<Xbee.h>library which communicates between Xbee module and the Arduino.C.System Specification1)Network Specification:a)Star Topology:Consists of a Coordinator as a center processing unit functions.It gathers sensor readings from all EndDevices.Figure4.Hardware Platforms of Coordinator and EndDeviceFigure5.Flowchart of Coordinator and End Deviceb)Polling:Polling is a method in which the Co-ordinator requests each End Device one by one to send sensor readings back to the Coordinator.The purpose of polling is to avoid interference from multiple nodes transmitting to the Coordinator simultaneously.2)Hardware Specification:A WSN node consists of a microcontroller,some sensors,and a communica-tion modulea)Microcontroller:We use Arduino USB Board which use the chip ATMEGA328as a processor, controlled by the computer via USB port.Arduino composed of5pins Analog I/O and13pins Digital I/O which can interface with the other devices such as I2C,SPI,digital and analog.b)Sensor:Temperature Sensor(LM335A)is a semiconductor[8]which measures temperature and displays the information in the voltage form.Theoutput from the temperature sensor is analog but is then sampled and quantized(A/D converted)by the Arduino.Hence,we can realize the temperature in degree Celsius by calibrating it by using the equation derived from an experiment if we use reference tem-perature is X degree Celsius and sampling value at reference temperature is Y as shown in equation(1). = +(( − )∗0.5))(1)c)Communication:We use Xbee Pro2.5ZNet[7]in our system.The XBee Pro module is compliant to the IEEE802.15.4standard.It is a series-2version which supports mesh networking,fixes the address to 64bits,and has20pins.In summary,the system consists of two types of nodes:Coordinator and End Device,as shown in Figure4.The Coordinator consists of Arduino,Xbee Pro,Xbee shield,and Ethernet Shield.On the other hand,End Device consists of Arduino,Xbee Pro,Xbee shield,and a temperature sensor.3)Software Specification:a)Microcontroller:We use Arduino IDE as a code editor and code burner.b)Web-Server:We use a simple HTML/AJAX running on Coordinator.c)Database:We use MySQL[11]to run on client computer.The client computer should has XAMPP Web-Server[10]for Query MySQL com-mand with PHP language accordingly.4)System Limitation:The distance between the Coordinator and End device should not exceed140 meters from the specification.On the other hand,if there are any blockages,the distance should not be greater than40meters.For the sensor,it can measure the temperature to the accuracy of only one decimal point,i.e.,the resolution is in0.5degree Celsius. MySQL and PHP code have to run on client computer in the same LAN network because Arduino cannot run MySQL by itself.IV.T ESTINGA.Sensor TestingEvery sensor is tested on the protoboard which connected to the Arduino analog input pin number0-3in as shown in Figure6.We observe the sampling values in range0-1023to check the sensors.The result is shown in Table I.B.Field-Test Temperature MeasurementLocation:We deployed the Coordinator and End Device within The Activities Center Building,Tham-masat University Rangsit Campus at1stfloor.Figure7 shows thefloor plan of the building.We deployed four sensor nodes far away from each other at about10-30meters.We monitorthe Figure6.Accuracy and Stability of Temperature sensorsTesting Figure7.The Activities Center Building infrastructure and nodes’locationstemperature readings from different nodes via a web browser,communicate to Coordinator which is Web-Server and receive the data from each sensor and then monitor via Webpage.a)Automatic Polling Experiment:The Coordina-tor automatically requests from each sensor in a round robin scheme and displays to the Webpage according to Figure8.The temperature readings are shown in Table II.b)Demand-Based Polling Experiment:The Co-ordinator requests from a sensor according to afixed address and displays to the Webpage as shown in Figure9.V.R ESULTSA.Field-Test Temperature MeasurementWe performed afield test for temperature monitoring between8am to4pm.The system collected the temper-ature readings every1hour and got the result as shown in Table II,got from Database as shown in Figure8. For the Demand Polling,we got the result as the value at that time of that sensor as shown in Figure9.From these results,we could say that the system is working in satisfaction in term of its functionality.Figure 8.Auto Round Polling viaWebpageFigure 9.Demand PollingExperimentFigure 10.End Device LocationTable IT ABLE OF A CCURACY AND S TABILITY TESTpin(0)pin(1)pin(2)pin(3)16196206186192619620619618361961961861846196206206195619620618619661962061961876196196186188619619618618961962061961910619620618618Table IIT ABLE OF F IELD -TESTTime Node A Node B Node C Node D 08.0026.5026.5027.5026.0009.0027.2526.7529.2527.0010.0027.0025.2533.0026.0011.0027.0025.0034.5027.0012.0027.5025.5034.2527.2513.0028.0025.5034.5028.5014.0028.5024.5032.5027.5015.0028.0024.2530.0026.0016.0027.5026.2530.2526.50B.Polling timeThe time required for each polling to a node can be measured by using the function millis();to realize the distance between Coordinator and End Device.This testing counts the 2-way transmission time.The delay times are shown in Table III.VI.S UMMARY AND F UTURE W ORKIn this paper,we built a prototype of an embedded wireless sensor network based on easy-to-use Arduino microcontroller board and Xbee module.We consider a temperature monitoring application to demonstrate the proof-of-concept of our system.The collected temper-ature data can be stored into the MySQL Database and retrieved later for analysis.Extensions of our current work include an extension from a star network to a mesh network which will be useful for deploying sensor networks in large areas like in buildings with multiple rooms and multiple floors.Table IIIR ESULT OF P OLLING TIME DELAY#Sensor Distance Delay 1Delay 2Delay 3Avg.Node A 8m 324ms 294ms 312ms 310ms Node B 15m 311ms 314ms 291ms 305.3ms Node C 17m 309ms 322ms 310ms 313.7ms Node D20m301ms311ms291ms301msThis mesh networking capability is being explored by our colleague[12].A cost reduction for each node can be achieved by removing the Arduino board.This takes advantage of the fact that each wireless sensor node can be equipped with an XBee module alone without a microcontroller. This can be done because the XBee module can automatically sample the sensor inputs and report back to the coordinator.It is called Zigbee I/O Sampling that is Xbee module can read sampling values on its pin by itself.So,if we can use only Xbee module,price per each node will decrease.R EFERENCES[1]Stefan Poslad,Ubiquitous Computing:Smart Devices,Envi-ronments and Interactions,Wiley,2009[2]IEEE802.15WPAN Task Group4(TG4),[3]Arduino,/.[4]SparkFun Electronics,Temperature Sensor-LM335A,[5]Wireless Sensor Network Research Group,http://www.sensor-[6]Won-Suk Jang,William M.Healy,Miroslaw J.Skibniewski,Wireless sensor networks as a part of a web-based building environmental monitoring system,Automation in Construction V olume17,Issue6,August2008,Pages729-736[7]Digi International Inc,XBee ZNet2.5/XBee-PRO ZNet2.5OEMRF Modules,Product Manual v1.x.4x-ZigBee Protocol For OEM RF Module Part Numbers:XB24-BxIT-00x,Digi Interna-tional Inc.11001Bren Road East Minnetonka,MN55343877 912-3444or952912-3444[8]Sabri.C,Mechatronic,1st-Edition,John Wiley&sons,Inc.,2007,ISBN978-0-471-47987-1[9]James F.Kurose,Keith W.Ross,Computer Networking:ATop-Down Approach:International Version,5/E,Pearson Higher Education[10]Kai Oswald Seidler,[11]Timothy Boronczyk,Martin E.Psinas,PHP and MySQL:Create Modify Reuse,Wrox(May5,2008)[12]V.Mayalarp,N.Limpaswadpaisarn,T.Poombansao,andS.Kittipiyakul,“Wireless mesh networking with XBee,”in2nd ECTI-Conference on Application Research and Development (ECTI-CARD2010),Pattaya,Chonburi,Thailand,10-12May 2010.。
无线传感器网络中虚拟骨干网构造算法研究的开题报告
无线传感器网络中虚拟骨干网构造算法研究的开题报告一、研究背景随着移动设备、物联网等技术的兴起,无线传感器网络(Wireless Sensor Network,WSN)已经成为了近年来研究的热点之一。
无线传感器网络一般由大量的小型传感器节点组成,这些节点可以感知环境中的不同物理量,并通过无线通信将数据传输到其他节点或基站。
由于传感器节点数量众多,而且节点一般质量较低、能量有限,因此如何优化网络性能是无线传感器网络研究的一个重要问题。
无线传感器网络中,虚拟骨干网(Virtual Backbone)是一种重要的网络构造方式。
通过建立虚拟骨干网,可以将传感器节点组织成一个更加紧凑、高效的网络结构,提高网络的可靠性、能耗等性能指标。
虚拟骨干网在无线传感器网络的多种应用场景中都发挥着重要作用,例如适应性采样、路由控制、数据聚集、区域覆盖、移动定位等。
二、研究内容目前,虚拟骨干网的构造算法在无线传感器网络研究中是一个重要的研究方向。
本文将从以下方面进行研究:1. 研究现有的虚拟骨干网构造算法,并进行分析比较。
对于不同的场景、网络拓扑结构、网络性质等,选择适当的算法进行比较分析。
2. 新建立无线传感器网络虚拟骨干网的构造问题,研究如何通过局部算法和全局算法构建虚拟骨干网。
提出一种能够减少虚拟骨干网节点数量的构造算法,合理地管理无线传感器网络。
3. 在现有虚拟骨干网构造算法的基础上,研究如何提高虚拟骨干网的质量和性能。
主要研究虚拟骨干网的构建和维护、路由、数据收集、数据处理等问题,为提高虚拟骨干网的应用贡献。
4. 建立无线传感器网络模型和性能指标,评估虚拟骨干网算法的性能和效率。
通过模拟实验和数学建模,验证算法的有效性和适用性。
三、研究意义本研究旨在提高虚拟骨干网的性能和效率,进一步完善无线传感器网络的技术体系,为无线传感器网络的在各个领域的应用提供重要支持。
具体意义如下:1. 研究虚拟骨干网的构造算法,可以降低无线传感器网络的能量消耗,提高网络的可靠性和稳定性。
无线传感器网络研究与应用资料

老年人健康状况监控
远程医疗 空间探索:
星球表面(biǎomiàn)大范围、长时期、近距离的监测和探索。 选定着陆场地 ▪ 其他应用: 紧急和临时场合应急通信:地震、水灾、强热带风暴灾害地区、边远或偏僻野外地区
交通流量监控 智能化房屋
结构健康监测
机械设备状态监测
定位方法为:利用少量已知位置节点(参考节点,采用GPS 定位或
者预先放置的节点),来获得其它节点的位置信息
提出的算法有:Niculescu,Bulusu等
第二十三页,共三十五页。
5、典型(diǎnxíng)应用
案例1 Senera的桥梁安全监控系统
Senera的系统,用于监测桥梁、高架桥、高速公路 等道路环境。对许多老旧的桥梁,桥墩长期受到 水流的冲刷,传感器能夠放置(fàngzhì)在桥墩底部、 用以感测桥墩结构; 也可放置在桥梁两侧或底部,搜集桥梁的温度、湿 度、震动幅度、桥墩被侵蚀程度等,能減少断桥 所造成生命财产的损失。
新兴的第四代传感器网络
▪ 第一代传感器网络:20世纪70年代。点对点传输,具有 简单信息获取能力。
▪ 第二代传感器网络:获取多种信息的综合能力,采用串 /并接口与传感控制器相联。
▪ 第三代传感器网络:20世纪90年代后期。智能传感器 采用现场总线(zǒnɡ xiàn)连接传感控制器构成局域网络。
▪ 第四代传感器网络:以无线传感器网络为标志,正处于
研究和开发阶段。
第三页,共三十五页。
以自组织形式构成多跳中继的分级(fēn jí)结构网络
普通节点和Sink节点:完成数据采集和多跳中继传输。 网关节点G:完成无线和有线信号转换,实现CERNET2的接入。 监控中心(zhōngxīn)CC:完成区域数据的综合处理。
无线传感器网络技术的应用与挑战
无线传感器网络技术的应用与挑战无线传感器网络(Wireless Sensor Network,WSN)技术是一项发展迅速的信息技术,它通过将许多小型、低功耗且具有自组织能力的传感器节点互联组成一个网络,实现了对目标区域进行全面、实时、准确的监测和控制。
WSN技术具有广泛的应用前景,但也面临着一些挑战。
一、无线传感器网络技术的应用1.环境监测:WSN技术可以用于环境监测领域,实时地收集环境参数(如温度、湿度、气压等)的数据,并进行分析和处理,为环境保护、灾害预警提供有力的支持。
2.农业领域:WSN技术可以应用于农业生产中,通过传感器节点对土壤湿度、光照强度等参数的监测,实现精确的农田灌溉和施肥,提高作物产量和质量。
3.工业控制:WSN技术可以用于工业自动化控制系统中,实时地监测设备状态、环境参数等信息,提供有效的管理和控制手段,提高工业生产的效率和安全性。
4.安防领域:WSN技术可以应用于安防领域,通过传感器节点实时监测周围环境的变化,如入侵者、火灾等,提供及时的报警和应对措施,保障人员和财产的安全。
5.健康医疗:WSN技术可以用于健康医疗领域,通过监测人体生理参数、体温、心率等,实时收集个体的健康状况,预测疾病的发生,提供个性化的医疗服务。
二、无线传感器网络技术面临的挑战1.能源问题:传感器节点通常由电池供电,能源问题是WSN技术的主要挑战之一。
传感器节点功耗低、寿命长的设计,以及能量收集和传输的技术研究是解决该问题的重点。
2.通信问题:WSN技术要求节点之间进行无线通信,网络中的节点数量通常很大,并且节点经常处于动态变化的环境中,这给通信带来了一定的困难。
如何保证数据传输的可靠性、低延迟和网络的稳定性是需要解决的问题。
3.网络安全问题:由于WSN应用的特殊性,传感器节点通常在无人区域或恶劣环境中部署。
这就给网络的安全性带来了挑战,如数据的保密性、完整性和抗攻击能力等问题需要解决。
4.节点定位问题:WSN技术要求对节点的位置进行准确的定位,以实现对目标区域的精确监测和控制。
Wireless sensor network
The Greenhouse Environment Monitoring System Based on Wireless Sensor Network TechnologyΙ..INTRODUCTIONПZIGBEE TECHNOLOGYWireless sensor network(WSN) integrates the sensor network techonology, information processing technology and network communication technology with the feature of small size, low cost and easy maintenance, which has a wide application in the area of environment data collection,security monitoring and target tracking.无线传感器网络(WSN)集成了传感器网络的技术,信息处理技术和网络通信技术,具有体积小,成本低,维护方便的特点,在环境数据采集,安全监控和跟踪目标领域具有广泛的应用。
It comprises a great many wireless sensor nodes deployed in the monitoring region, and through wireless communication a multi-hop self-organizing network system is formed.它包括许多部署在监测区域的无线传感器节点,并且通过无线通信一个多跳的自组织网络系统形成了。
Its role is to coordinate the perception , acquisition and process of the information of its perceptual objects within the area covered by the network, and returned data to the observer.At present, large amount of widely-distributed electronic detection devices and implementing facilities are greatly used in greenhouse production , resulting in intertwining cables(相互交织的电缆)in the greenhouse production .目前,大量分布广泛的电子检测设备和执行设备被广泛地运用在温室生产中,导致了温室生产中存在相互交织的电缆。
深度学习算法在无线传感器网络优化中的应用
深度学习算法在无线传感器网络优化中的应用无线传感器网络(Wireless Sensor Networks,WSN)是由大量分布式传感器节点组成的网络,每个节点都能够感知环境中的物理和环境参数,并将这些信息传输给基站或其他节点。
近年来,随着技术的快速发展,无线传感器网络在各个领域的应用越来越广泛。
在传感器网络中,如何优化网络性能以提高节点的感知和传输效率,成为了研究的热点之一。
而深度学习算法作为一种强大的人工智能技术,能够自动学习和提取数据中的有用特征,因此在无线传感器网络的优化中具有广阔的应用前景。
一、深度学习算法简介深度学习算法是一种基于人工神经网络模型的机器学习算法,广泛应用于图像识别、自然语言处理、语音识别等领域。
与传统的机器学习算法相比,深度学习算法具有更强的模式识别和抽象建模能力。
深度学习算法通过建立多层次的神经网络模型,实现从低层次特征到高层次抽象表示的转换过程。
在无线传感器网络优化中,深度学习算法的主要优势在于其能够从大量的传感器数据中自动学习和提取特征,减少了对人工特征工程的依赖。
二、深度学习在无线传感器网络中的应用1. 能量管理能量是无线传感器网络中节点的关键资源,如何合理利用和管理能量对于延长网络寿命至关重要。
深度学习算法可以通过对传感器节点的电量、工作负载、通信质量等数据进行学习和分析,建立能量管理模型,并制定相应的策略进行能量分配和节能控制。
例如,通过深度学习算法可以实现对节点工作状态的预测,从而减少不必要的能量消耗,提高节点的工作效率和能量利用率。
2. 数据处理与压缩无线传感器网络中的节点通常会采集到大量的数据,而传输和存储这些数据所需的能量和带宽开销较大。
深度学习算法可以通过对数据进行有效的处理和压缩,减小数据量和冗余,降低数据传输和存储的开销。
例如,可以利用深度学习算法进行数据压缩,提取关键特征,实现对传感器数据的有效表示和传输,从而减少网络拥塞和能量消耗。
3. 节点定位和路径规划无线传感器网络中的节点定位和路径规划是一个重要的问题,涉及到网络拓扑构建和数据传输的效率。
浅析无线传感器网络及其路由技术
Computer Knowledge and Technology 电脑知识与技术本栏目责任编辑:冯蕾网络通讯及安全第6卷第3期(2010年1月)浅析无线传感器网络及其路由技术王艳琴1,彭刚2,刘宇1(1.桂林电子科技大学计算机与控制学院,广西桂林541004;2.桂林空军学院教育技术中心,广西桂林541003)摘要:简要介绍了无线传感器网络的相关知识,包括体系结构、特点和应用领域。
在介绍无线传感器网络关键技术之后,着重分析和讨论了其组网的基础路由技术,并探讨了它所面临的问题和挑战。
关键词:无线传感器网络;关键技术;路由技术中图分类号:TP393文献标识码:A 文章编号:1009-3044(2010)03-552-03Analysis of Wireless Sensor Networks and Routing TechniquesWANG Yan-qin 1,PENG Gang 2,LIU Yu 1(1.Institute of Computer and Control,Guilin Uniersity of Electronic Technology,Guilin 541004,China;cational Technology Cen -ter,Guilin Air Force Academy,Guilin 541003,China)Abstract:Correlative knowledge of wireless sensor network is briefly introduced,including the architecture,the characteristics and the ap -plication fields.After key techniques of wireless sensor network are introduced,routing technique is analyzed emphatically,and then the problems and challenges of routing techniques are discussed.Key words:wireless sensor network;key techniques;routing technique随着无线通信和计算技术的发展,传感器不仅能感应和监测环境,还可以处理收集到的数据,将其处理后以无线的方式传送到基站。
无线传感器网络中的压缩感知算法研究与应用指南
无线传感器网络中的压缩感知算法研究与应用指南无线传感器网络(Wireless Sensor Network,WSN)已经成为了各类应用场景中的重要组成部分,如环境监测、智能交通系统、医疗健康等。
随着传感器节点数量的增加和数据传输量的增大,传感器网络中的数据压缩成为了一项重要的研究领域。
本文将介绍无线传感器网络中的压缩感知算法,并提供相应的应用指南。
一、压缩感知算法简介压缩感知算法是一种通过对信号进行稀疏表示,从而实现在保持一定的数据质量的同时,减少传感器节点之间的通信开销的方法。
通过对信号进行压缩表达,可以在从传感器节点中收集到的原始数据中快速提取出有用的信息,从而降低能源消耗和通信带宽的需求。
传感器节点通常通过采集信号的采样数据来获得信息,并将这些数据传输到网关节点或中心服务器进行处理和分析。
然而,由于传感器节点数量庞大且资源有限,直接传输原始数据往往会导致信号交叉和冗余,造成能耗过大、网络拥塞等问题。
因此,压缩感知算法的引入可以有效地解决这些问题。
二、常用的压缩感知算法1. 稀疏表示算法稀疏表示算法是压缩感知算法中最常用的方法之一。
该算法基于信号在某个稀疏基上的线性表示,利用稀疏性的特点将信号压缩到较低维度的空间中,从而实现数据压缩的目的。
常见的稀疏表示算法包括基于最小二乘法的OMP(Orthogonal Matching Pursuit)、BP(Basis Pursuit)等。
2. 矩阵分解算法矩阵分解算法是另一种常用的压缩感知算法。
该算法通过对信号进行矩阵分解,将信号分解成低秩的近似表示,从而实现数据的压缩。
通过引入矩阵分解,可以在一定程度上减少数据的冗余,提高压缩效率。
常见的矩阵分解算法包括主成分分析(PCA)、奇异值分解(SVD)等。
3. 信息论算法信息论算法是基于信息论原理设计的一种压缩感知算法。
该算法以信源熵为理论基础,通过降低信源熵来实现数据的压缩。
信息论算法可以充分利用信号的冗余性和统计特性,实现对信号的高效压缩。
WirelessSensorNetworksPPT课件
Traditional Sensing Method
Sensors do not have computation ability Sensors do not communicate
Current Sensing Method
the deployment of ZigBee Health Care based products in the market Kroger, one of the largest retail company in the US, joints ZigBee’s BoD ZigBee and SAE created a liaison to focus on solutions to address the
ZigBee Smart Energy is first open standard endorsed by ESMIG for Smart Metering across Europe ZigBee offers Smart Energy to IEC as basis for an IEC HAN & Smart Metering Standard ZigBee developing an IP stack for use with Smart Energy based on IETF RFCs. ZigBee Green Power enhancement being added to the ZigBee/ZigBee PRO stack ZigBee Alliance and Demand Response & Smart Grid Coalition (DRSG) establish a liaison ZigBee RF4CE specification & Technology Paper for public down load ZigBee and Continua Health Alliance signed liaison agreement to support
- 1、下载文档前请自行甄别文档内容的完整性,平台不提供额外的编辑、内容补充、找答案等附加服务。
- 2、"仅部分预览"的文档,不可在线预览部分如存在完整性等问题,可反馈申请退款(可完整预览的文档不适用该条件!)。
- 3、如文档侵犯您的权益,请联系客服反馈,我们会尽快为您处理(人工客服工作时间:9:00-18:30)。
-Abstract - The area of sensor network has a long history and man y kin d of sen sor devices are used in various real life application s. Here, we in troduce Wireless sen sor n etwork which when combin e with other areas then plays an important role in analyzing the data of forest temperature, bioi n formatics, water co n tami n atio n , traffic co ntrol, telecommunication etc. Due to the advancement in the area of wireless sensor network and their ability to generate large amount of spatial/temporal data, always attract researchers for applying data mining techniques and getting interesting results. Wireless se n sor n etworks i n mo n itori n g the en viron men tal activities grows an d this attract greater interest and challenge for finding out the patterns from large amoun t of spatial/temporal datasets. These datasets are gen erated by sen sor n odes which are deployed in some tropical regions or from some wearable sensor nodes which are attached with wild animals in wild life centuries. Sensor networks generate continuous stream of data over time. So, Data min in g techn iques always plays a vital role for extracting the knowledge form large wireless sensor networkdata. In this paper, we present the detection of sensor datairregularities, Sensor data clustering, Pattern matching and their in terestin g results an d with these results we can analyze the sensor node data in different ways. Keywords - wireless sen sor n etwork, clusterin g, patternmatching, mining, sensor node.I. INTRODUCTIONWireless sensor network grows and rapidly improves,this enable the new communication services. Sensor networks are the most useful way to collect the variousparameters and information needed by environments likeindustrial, home, shipboard, buildings, utilities, transportation systems automation etc. Recent various areas like terrorist and animal warfare countermeasures require distributed sensor networks that can be deployedeasily using aircraft, and have self-organizing capabilitiesetc. with the advancement in the recent technology development of small, battery-powered, wireless sensor nodes [2] [5] [6] is enabled. But, sensors have seriousresource constraints including battery lifetime,communication bandwidth, CPU capacity and storage[16].also, due to increase in mobility of the sensor node,may increase the complexity of sensor data because a sensor may be in a different neighborhood at any point oftime [17]. Whenever we need to install a sensor networkthen it must be fast, easy to install and maintain. Sensornetwork basically consist of large amount of sensor nodesthat are deployed to large physical area to monitor anddetect the real time environmental activities. These sensornodes works together to collect the data like temperature,humidity, acceleration etc from surroundings. As, wirelesssensor networks consisting of such sensors nodes those create exciting opportunities for large scale, data intensive measurement and surveillance applications. In such type of application, in order to take intelligent decision mine sensor data or readings for pattern. In this paper, we study the challenges, problems and the solution comes out to be from mining data from live sensor nodes. As sensor network is useful in application like in habitat monitoring, health monitoring, traffic, weather, pollution etc and in all such real life application sensor nodes generate large amount of data so mining data is really a fruitful task. Also, wild life habitat surveillance [11], battlefield troop coordination, and traffic monitoring are the initial application of data mining.Due to advancement in the wireless sensornetworks the networks have ability to generate a large amount of data, and to find out the useful knowledge regarding the sensor network we apply data mining techniques.Here we link up the wireless sensor network withenvironment monitoring and this link helps in various areas like in fire detection in forest areas, saving wild life,and in other tropical conditions by analyzing temperature, humidity etc.In this paper, we present the few important data mining techniques like data pre-processing, cluster analysis and pattern matching. These are the techniques which we applied to the senor data so that we got the appropriate result and we analyze the results.We organize this paper as follows. Section 2 reviews the related works in wireless sensor network field and briefly discusses the background knowledge related to sensor network and data mining techniques. Section 3 presents the dataset that we had taken for the experiment.Section 4 presents the implementation strategies of the data mining techniques which we applied to sensor data. Section 5 shows the results. Section 6 concludes this paper. Section 7 presents the future scope. II. LITRATURE SURVEY Area of sensor network is very wide and used in various applications. There has been much work done indata mining, sensor network, data stream etc. but very less work has been done at the combination of these areas. So we introduce the combination of wireless sensor network and data mining to get some interesting and fresh results. Research in WSNs area has focused on two separate aspects of such networks, namely networking issues, such as capacity, delay, and routing strategies; and application Wireless Sensor Networks for Monitoring the Environmental ActivitiesRuchi Mittal 1, M.P.S Bhatia 21Department of Computer Science and Engineering, Netaji Subhash Institute of Technology, New Delhi, India 2Department of Computer Science and Engineering, Netaji Subhash Institute of Technology, New Delhi, India(ruchi.mittal138@ ,bhatia.mps@ )978-1-4244-5967-4/10/$26.00 ©2010 IEEEissues [15]. The beauty of sensor networking protocols is that they attracted a tremendous amount of research effort [5]. For large sensor network the management of sensor database is itself a big task. Query processing techniques have been proposed for acquiring and managing sensor data [11]. One major research goal of this problem in the database community is to efficiently detect outliers in a large-scale database [12]. To collect the data we treat the Sensor networks as databases and SQL queries [13]. Clustering of sensor network [3] is related with network topology, not on the sensor data.In our study we are basically concentrating towards Spatial-Temporal data. Traditional data mining works on Association Rule [7], looking for patterns of the form: “Customers who buy bread, also buy milk, with probability x%.” There is significant literature [8]. The area of spatial-temporal data is limited and always looking for rules of the form “customers who buy cars now, will buy tires in 2 years.”[9], with such kind of rules we can extend our research area. We will use some of the matching algorithms to detect correlated sequence.There is much literature regarding irregularity detection [14]. But, none of these approaches are directly applicable to a wireless sensor network environment.In this paper, we are focusing towards the area of detection of irregular pattern. Either detect irregular sensory data of a single attribute with respect to time [10] and space or detect the irregular patterns of multiple sensory attributes.The main problem with detecting irregularities is to find those sensory values that deviate significantly from the norm [4]. This problem is very important because if we are getting irregular data continuously then we can detect weather the tropical condition around the sensor node are not well or we have faulty sensor node . So, Detection of irregularities in the data strongly related to modelling of sensor data.To find out the irregularities in the multi-attribute pattern detection problem we assume that that there are some normal patterns among multiple sensory attributes, which are true in some natural phenomena. H ence, whenever some of these normal patterns are broken somewhere, then the irregularity in the data is detected and reported. Similarly, in finding the irregularities in the single attribute sensor data problem, we examines the temporal and spatial characteristics of a sensor node and find out the irregularity in comparison with the node’s previous data or the data of the neighbor node.III. DATASETWe download the dataset for our work from /LBA/guides/CD04_Meteorology_Flu xes.html, this data is presented as value measured at 30 minute interval over 3.5 years and compiled at the km 83 tower site. This data includes the variables relate to meteorology, soil moisture, fluxes of momentum, heat, water vapor, and carbon dioxide beneath the flux sensors.III. IMPLEMENTATION STRATEGYThe goal of the work is the development of new data-mining techniques for knowledge discovery in monitoring environmental activity like detecting forest fire databases and a decision framework is used to inform the development and placement of the sensor networks. Thus, our goal is not restricted to one environmental problem, but it will produce a generalizable solution to the issue of interpreting and using environmental data. Hence we need huge amount of data for the well defined and accurate results.A.Sensor Data Pre-processingData Pre-processing involves cleaning the data by putting in missing values and removing uninteresting data. It may also include summarization and aggregation of the data. This step basically involves preparing the data for analysis [2].So, firstly we can detect the irregularities in the sensor data and apply pre-processing technique. Pre-processing involves cleaning the data by putting in missing values and removing uninteresting data. It may also include summarization and aggregation of the data. This step basically involves preparing the data for analysis [2].H ence with the help of weka's filtering tool we pre-process our dataset.B.Sensor data ClusteringThe term Data Clustering means the process of organizing or arranging a set of objects into groups or clusters in such a manner so that objects within a cluster have the most similarity to one another and the most dissimilarity to objects in other clusters.Clustering is a useful and basic task in data mining. We generally used it as initial step in data mining for future data analysis. So, here we purpose clustering of sensor data along with their sensor attributes. H ere, we use the simple of K-Means clustering algorithm for making clusters of sensor node data in a wireless sensor network.TABLE I.U SEFUL DATA FOR MININGAttribute DescriptionSolar_in mean daily downward flux of solar radiationSolar_out mean daily upward flux of solar radiationT64 mean daily air temperature at 64 m heightT40 mean daily air temperature at 40 m heightT10 mean daily air temperature at 10 m heightT2mean daily air temperature at 2 m heightPress mean daily air pressure measured at 64m height WS_64 mean daily wind speed measured on the sonicanemometer at 64 m heightWD_64 mean daily wind direction measured on the sonicanemometer at 64 m heightRain total daily rainfall measured at 64 m height using atipping bucket rain gaugeTsoil_10 mean daily soil temperature at 10 cm depth Tsoil_20 mean daily soil temperature at 20 cm depth Tsoil_50 mean daily soil temperature at 50 cm depth h2o_soil_10 mean daily soil moisture at 10 cm depth h2o_soil_20 mean daily soil moisture at 20 cm depth h2o_soil_40 mean daily soil moisture at 40 cm depthCo2_64 mean daily atmospheric CO2 concentration at 64 m heightFco2mean daily CO2 flux at 64 mThese are the attributes to which we are focusing and do our research work.IV. RESULTSH ere, we firstly show the result of the clustering by applying the k-mean algorithm, where we take the value of k=6 because with this value number of squared errors within the cluster is reduced. Also, when we apply the k-mean algorithm to our dataset then it creates 1354 instances and missing values were replaced with mean/mode. Now, for each cluster number of instances was divided as shown in table :TABLE II. CLUSTER INSTANCES Cluster ID ClustersCluster Instance0303( 22%) 1256 ( 19%)2 79 ( 6%)3154(11%) 4 359 ( 27%) 5203 ( 15%)The cluster centroids for all the clusters and for each attribute can be given as follow:TABLE IIII. CLUSTERING RESULTS OF THE SELECTEDATTRIBUTESThe above results have more accuracy because as we increase the value of k then the squared error decrease and we get more valuable result. Now when we want to figure out the different climate attributes for different aspects these results really help. For example let we want to determine the forest fire in a particular region then using the above clustering result we will easily figure out the area.H ere, we plot the graph for some attributes. The analysis graphs are done by using weka tool. In these graphs the x-axis denotes the time slice and the y-axis denotes the various attributes.x Wind AnalysisFig 1. Graph soil moisture at 40 cmx Temperature (64 m) AnalysisFig 2. Graph Temperature at 64 mxTemperature (2 m) AnalysisFig 3. Graph temperature at 2 meterx Downward flux of solar radiation AnalysisFig 4. Graph for downward flux of solar radiationx Upward flux of solar radiation A nalysis Fig 5. Graph upward solar fluxxRain AnalysisFig 6. Graph for rainxCO2 Flux AnalysisFig 7. Graph for CO2 FluxxSoil Moisture(40 cm) Analysis Fig 8. Graph for soil moisture at 10 cmIn the above graphs, blue denotes for small values and orange denotes higher values. Now, these graphs shows the variation in values of different attributes with respect to time and whenever we want to match these pattern according to time then these graphs are really helpful.So, whenever we require pattern matching to analyse the environment activities at different time and in different weather conditions then we use the above graphs. For this we define the reference frame for normal pattern for different attributes then discover reference frame that results the patterns with multiple irregularities and finally if there is change in data values then automatically adjust for normal patterns and discover irregularities. For example in winters, from each sensor node we calculate the minimum and maximum temperature and plot the graphs to analyse the data. If there is fire in forest then to detect this we introduce the concept of pattern matching strategy and match the graphs of different nodes. This results the graph which shows irregular points and different from the graphs of other node then from this we quickly find the fire area.IV. DISCUSSIONAs future work, we will consider more about fault-tolerance, power consumption, scalability, inter sensor node communication and most important is security. We use the sensor network and data mining concept in other application areas like detecting tsunami, detecting heart attack etc. We also try to introduce the concepts of machine learning for further analysis and try to find out more interesting and correct results.V. CONCLUSIONAs, the sensor network is used at large scale in various applications. These sensor networks produce large datasets, which will require sophisticated data mining techniques and also, modeling to enable optimal decision-making. In this paper, we identify the major challenges for mining data from large sensor data. H ere, various useful techniques of data mining are discussed which we are applied to wireless sensor network data for monitoring the environmental activities. The main area which we focus is accuracy and enhancement in the performance of getting the correct and fruitful results. We identify some of the research problems to work on sensor data irregularities detection, sensor data clustering and pattern matching. The work described in this paper link up the development of new knowledge discovery and decision making research designed to evaluate and optimize sensor network.ACKNOWLEDGMENTWe worked on open source data mining tool for our analysis and this can be downloaded from site: /~ml/weka/. And the dataset repository site from where we download the dataset of sensor network for our work/LBA/guides/CD04_Meteorology_Fluxes.html .REFERENCES[1] C.C.Aggarwal, J.H an, J.Wang, P.S.Yu. A Framework forClustering Evolving Data Streams. VLDB2003. J. ClerkMaxwell, A Treatise on Electricity and Magnetism, 3rd ed., vol. 2.Oxford: Clarendon, 1892, pp.68–73.[2]I.F.Akyildiz, W.Su, Y.Sankarasubramaniam, and E.Cayirci.Wireless Sensor Networks: A Survey. Computer Networks,Vol.38, No.4, pp.393-422, 2002.[3]S.Bandyopadhyay and E.J.Coyle. An Energy Efficient HierarchicalClustering Algorithm for Wireless Sensor Networks. IEEEINFOCOM 2003.[4] D.Barbara, W.Dumouchel, C.Faoutsos and P.H aas. The NewJersey Data Reduction Re-port. IEEE Data Engineering Bulletin,Vol.20, No.4, pp.3-45, 1997.[5] D.Estrin, indan, J.H eidemann, and S.Kumar. Next CenturyChallenges: Scalable Coordination in Sensor Networks. MobiCOM1999[6]G.J.Pottie and W.J.Kaiser. Wireless Integrated Network Sensors.Communications of the ACM. Vol.43, No.5, pp.51-58, May2000.[7]Agrawal, R.; Imielinski, T.; Swami, A. IEEE\z TransactiononKnowledge and Data Engineering; 1993; p 6.[8]H an, J.; Kamber, M. Data Mining: Concepts and Techniques;Morgan Kaufmann: 2000.[9]Dongqing Yang, Shiwei Tang, Qiong Luo ,Xiuli Ma, Dehui Zhang,Shuangfeng Li. Online Mining in Sensor Networks. NPC 2004,LNCS 3222, pp. 544-550, 2004.[10]Agrawal, R.; Srikant, R. Mining Sequential Patterns.ICDE 1995, 3-14.[11]Madden, M.J.Franklin, J.M.H ellerstein, and W.H ong. TAG: ATiny Aggregation Service for Ad-hoc Sensor Networks. InSymposium on OSDI, 2002.[12] A. Lazarevic and V. Kumar. Feature bagging for outlier detection.In KDD ’05, New York, NY, USA, 2005.I.F.Akyildiz,W.Su,Y.Sankarasubramaniam, and E.Cayirci. Wireless Sensor Networks:A Survey. Computer Networks, Vol.38, No.4, pp.393-422, 2002.[13]S. R. Madden, M. J. Franklin, J. M. H ellerstein, and W. H ong.TinyDB: an acquisitional query processing system for sensor networks. ACM Trans. Database Syst., 30(1), 2005.[14] E.M.Knorr and R.T.Ng. Algorithms for Mining Distance-basedOutliers in Large Datasets. VLDB 1998.[15]S. R. K. Joel B. Predd, and H. Vincent Poor, "Distributed Learningin Wireless Sensor Networks - application issues and the problemof distributed inference," IEEE Signal Processing Magazine,2006.[16]S. Madden, M.J.Franklin, J.M.H ellerstein, and W.H ong. TheDesign of an Acquisitional Query Processor for Sensor Networks.SIGMOD 2003.[17]M.J.Franklin. Challenges in Ubiquitous Data Management.Informatics 2001.。