数字信号处理及MATLAB实现第八章习题答案
《数字信号处理教程——MATLAB释义与实现》第八章

1
IIR滤波器设计
本章主要内容 8.1 关于模拟滤波器的预备知识 8.2 模拟滤波器原型的设计 8.3 由模拟滤波器变换为数字滤波器 8.4 模拟滤波器的频带变换 8.5 数字滤波器的频带变换 8.6 IIR数字滤波器的直接设计函数 8.7 IIR和FIR数字滤波器的比较 8.8 MATLAB中的滤波器设计工具
15
模拟滤波器原型的设计
计算本例的程序hc821应为: N=input('N= '); % 输入滤波器参数 OmegaC=input('OmegaC= '); [z0,p0,k0] = buttap(N) % 调用buttap函数, p = p0*OmegaC; % 非归一化极点 z = z0*OmegaC; % 非归一化零点 k = k0*OmegaC^N; % 非归一化增益 b = real(poly(z));b = k*b % 分子系数向量 a = real(poly(p)) % 分母系数向量 由此程序可求b,a,并得到系统函数的任何形式。
3
关于模拟滤波器的预备知识
图中ε 为通带波动系数,Ω p和Ω s是通带和 阻带边缘频率。A为阻带衰减参数。参数 ε 和A化成dB值后可与第七章中的数字 滤波器指标Rp和As建立关系。其关系式 为:
R p 10log10 1 1 2 10Rp /10 1
As 10log10
1
2 c 1 2T N
其中 N 为滤波器的阶数, ε 为通带波动系数,它 与Rp有关,TN(x)是N阶切比雪夫多项式 。
1 cos(N cos ( x)), T N ( x) 1 cosh(cosh ( x)),
数字信号处理及MATLAB实现第八章习题答案
1. 数字信号处理器有哪些结构特点?答:1. DSP内部采用的是程序空间和数据空间分开的哈佛结构;2. 多总线结构;3. 流水线结构:在DSP中,执行一条指令,需要通过取指、译码、取操作数和执行四个阶段。
在程序运行过程中,这四个阶段不是依次进行的,而是重叠的进行的;4. 多处理单元:DSP内部通常包括有算术逻辑运算单元(ALU)、辅助寄存器运算单元(ARAU)、累加器(ACC)以及硬件乘法器(MUL)等多个处理单元。
它们可以在一个指令周期内同时进行运算;5. 硬件配置强:新一代DSP的接口功能愈来愈强,如:TMS320C5000系列芯片片内具有串行口、主机接口(HPl)、DMA控制器、软件控制的等待状态产生器、锁相环时钟产生器以及实现在片仿真符合IEEEll49.1.标准的测试访问口,更易于完成系统设计。
许多DSP芯片都可以工作在省电方式,使系统功耗降低。
2. TMS320C54x系列DSP片内有多少条总线,具体说明有哪些?答:TMS320C54x系列DSP是TI公司于1996年推出的新一代定点数字信号处理器。
其采用先进的修正哈佛结构,片内有8条总线,分别为1条程序存储器总线,3条数据存储器总线和4条地址总线。
3. TMS320VC5402的在片外围电路有哪些?答:1. 软件可编程等待状态发生器;2. 可编程分区转换逻辑电路;3.带有内部振荡器或用外部时钟源的片内锁相环(PLL)时钟发生器;4. 时分多路(TDM)串行口;5. 缓冲串行口(BSP);6. 2个16位定时器;7. 8位并行主机接口(HPl);8. 外部总线关断控制,以断开外部的数据总线、地址总线和控制信号。
4. TMS320VC5402有哪些片内资源?答:TMS320VC5402的片内资源按功能包括运算单元、寄存器、片内RAM 和ROM、片外存储器接口、DMA控制器、主机接口、串口、定时器、时钟产生器和中断控制器。
5. CCS有几种工作模式?具体说明。
数字信号处理英文版课后答案(8)

Chapter 8 Solutions 8.1 The Fourier transform gives the spectrum of this non-periodic signal:Ω-Ω-++=Ω2j j e 25.0e 5.01)(X8.2 The samples for the signal are:The spectrum for the signal is given byΩ-Ω-Ω-++-=Ω4j 3j j e e e 5.0)(X8.3 Ω-Ω-Ω-Ω-∞-∞=Ω-++++==Ω∑8j 6j 4j 2j n jn e e e e 1e ]n [x )(X8.4 The first eight sample values for the signal are shown in the table.The signal contains an infinite number of non-zero samples, but the first 5, shown above, should be sufficient to approximate the DTFT reasonably well.Ω-Ω-Ω-Ω-∞-∞=Ω-+-+-≈=Ω∑4j 3j 2j j n jn e 0039.0e 0156.0e 0625.0e 25.01e ]n [x )(X8.5 The DTFT for x 1[n] isΩ-Ω-∞-∞=Ω-++==Ω∑2j j n jn 11e 3e 21e ]n [x )(XThe DTFT for x 2[n] isΩ-Ω-Ω-∞-∞=Ω-++==Ω∑4j 3j 2j n jn 22e 3e 2e 1e ]n [x )(XThe DTFT for x 3[n] isΩ-Ω-∞-∞=Ω-++==Ω∑2j j n jn 33e 1e 23e ]n [x )(XAll three signals have identical magnitude spectra, shown below.|X(The phase spectra of the three signals differ. They are shown in the figure below. From the DTFT expressions above, it is easy to see that )(X e )(X 12j 2Ω=ΩΩ- and)(X e )(X 12j 3Ω-=ΩΩ-. The first relationship means that the phase for x 2[n] will always be 2Ω less than the phase for x 1[n]. The second relationship means that the phase for x 3[n] is always 2Ω less than the negative of the phase for x 1[n], since X 1(-Ω) produces phases that are the negatives of the phases for X 1(Ω), following the odd phase spectrum rule. Both of these two relationships can be confirmed in the table or the plot, remembering that θ ± 2π = θ.8.6 The samples of the signal are shown in the table:The DTFT isΩ-Ω-Ω-∞-∞=Ω-+-==Ω∑4j 2j j n jn e 866.0e 866.0e 866.0e ]n [x )(X8.7 The period of the signal is N = 10. The sample values are listed in the table:The N = 10 DFS coefficients are given by:510k 2j 410k 2j 310k 2j 210k 2j 9n n10k 2j k e e e e e ]n [x c π-π-π-π-=π-+++==∑= 1|–2πk/5 + 1|–3πk/5 + 1|–4πk/5 + 1|–πkBecause of the symmetry of the spectrum, it is enough to calculate the coefficients for k = 0 to k = N/2 = 5, and to produce the other parts of the spectrum from this data.The magnitudes in the second half of the spectrum are a mirror image of those in the first. The phases in the second half are the negatives of the phases in the first half.|X(8.8 (a) The signal x[n] has the digital period N = 4. Its spectrum can be found using the discrete Fourier series:34k 2j 4k2j 3n n4k 2j k ee2e]n [x c π-π-=π--+==∑= 2 + 1|–πk/2 – 1|–3πk/2(b) The magnitude spectrum appears to repeat every second sample, while the phase spectrum repeats every four samples. The period of both spectra must be the same, so the overall period must be 4. As for all periodic signals, the period of the spectrum matches the period of the signal. 8.9 The signal has a period of N = 4, so the DFS coefficients are given by:24k2j 3n n4k 2j k e1e ]n [x c π-=π--==∑= 1 – 1|–πkSeveral cycles of the spectra are shown in the figures below.(8.10 The spectra for non-periodic signals are produced using the DTFT. The spectra, X(Ω), are smooth, continuous functions of frequency with a period of 2π. They are plotted against digital frequency Ω. If desired, the spectra can be plotted as X(f) versus frequency in Hz, using f = Ωf S /(2π).The spectra for periodic signals having a period N are produced using the DFS. The spectra, c k , are line functions of frequency with a period of N. They are plottedagainst the index k. If desired, the spectra can be plotted against frequency in Hz, using f = kf S /N.For both non-periodic and periodic signals, magnitude spectra are even and phase spectra are odd.8.11 (a) The signal is non-periodic. Its spectrum is given by the DTFT:Ω-Ω-Ω-∞-∞=Ω-++==Ω∑3j 2j j n jn e 3e 2e e ]n [x )(XThe magnitude and phase spectra appear as dashed lines in the figure in part (b). (b) The signal is a periodic version of the signal in (a), with period N = 4. Its spectrum is given by the DFS:34k2j 24k 2j 4k2j 3n n4k 2j k e3e 2ee]n [x c π-π-π-=π-++==∑= 1|–πk/2 + 2|–πk + 3|–3πk/2 The magnitude and phase spectrum are plotted below, dashed lines for the DTFT and solid for the DFS. Note that the DFS samples the DTFT.8.12 The harmonic frequencies are given by f = kf S /N. For f S = 12 kHz and N = 72, the first five harmonics are: 166.7, 333.3, 500.0, 666.7, and 833.3 Hz.8.13 For the first cosine, N/M = 2π/Ω = 2π/(2π/3) = 3, so the period is 3. For the second cosine, N/M = 2π/Ω = 2π/(π/3) = 6, so the period is 6. The lowest common multiple of these two periods is 6, so this is the overall period of the waveform.The signal samples are given by The Fourier coefficients are calculated as:56k2j 46k2j 36k2j 26k 2j 6k2j 5n n6k 2j k e5.0e 5.1e e 5.1e5.03e]n [x c π-π-π-π-π-=π---+--==∑= 3 – 0.5|–k π/3 –1.5|–2k π/3 + 1|–k π –1.5|–4k π/3 – 0.5|–5k π/3 The magnitude spectrum is periodic with period 6. Six spectrum samples cover the range from 0 to the sampling frequency, 4 kHz. Therefore, each point of the spectrum covers 4000/6 = 2000/3 Hz. As a result, k = 3 corresponds to the Nyquist frequency of 2 kHz. Using kf S /N, the two spikes in the spectrum below the Nyquist frequency, at k =1 and k = 2, map to frequencies of 2000/3 = 666.7 and 2(2000)/3 = 1333.3 Hz. Using Ω = 2πf/f S , these analog frequencies correspond to the digital frequencies π/3 and 2π/3 rads. Thespike at the higher frequency is twice the height of the other because its amplitude in the signal is double that of the other component. The other two spikes in the spectrum, at k = 6 – 1 and k = 6 – 2 map to imaged versions of the baseband frequencies.8.14 (a) Since the magnitude spectrum is periodic with period 14, the digital signal is periodic with the same period. (b) Fourteen points of the magnitude spectrum cover the sampling frequency, 16 kHz. Each point covers an interval 16/14 = 1.143 kHz wide. For a 16 kHz sampling frequency, the Nyquist frequency is 8 kHz. The first seven points of the magnitude spectrum cover this range. Three spikes occur within the Nyquist range, at k = 1, 2 and 3, or, using kf S /N, 1143, 2286 and 3429 Hz.(The magnitude spectrum belongs to the signal x[n] = sin(n π/7) + 2sin(n2π/7) +3sin(n3π/7). The digital frequencies π/7, 2π/7 and 3π/7 rads are, for a 16 kHz sampling rate, obtained from the analog frequencies 1143, 2286 and 3429 Hz.)8.15 (a) Since the magnitude spectrum has a period of 24, the digital signal also has a period of 24 samples. (b) Twenty-four samples cover 12 kHz, which means each point of the magnitude spectrum covers 0.5 kHz. The spikes at k = 2, 4 and 9 map to frequencies of kf S /N = 1, 2 and 4.5 kHz. The other three spikes are occur above the Nyquist frequency, at k = 24 –2 = 22, k = 24 – 4 = 20 and k = 24 – 9 = 15. The frequencies that correspond to these values of k are imaged copies of the baseband frequencies. (c) Using Ω = 2πf/f S , the digital frequencies are π/6, π/3 and 3π/4 rads.(The signal whose magnitude spectrum is shown is x[n] = cos(n π/6) + cos(n π/3) + cos(n3π/4).)8.16 The Fourier expansion can be matched to ∑-=π=1N 0k n N k2j k e c N 1]n [x . Since N = 16,n 1622j n1612j n 1612j n 1622j e e 2j 1e 2j e ]n [x πππ-π-+++-=⎪⎪⎭⎫ ⎝⎛+++-=πππ-π-n 1622j n 1612j n 1612j n 1622j e 8e 4j 8e 4j e 881The only non-zero coefficients c k are: c –2 = 8, c –1 = –j4, c 0 = 8, c 1 = j4, c 2 = 8. The other 11 coefficients in each period must be zero. The magnitudes of the non-zero coefficients are 8, 4, 8, 4, 8 and the phases are 0, –π/2, 0, π/2 and 0. The magnitude and phase spectra constructed using this information are shown below. Remember that the sequence of magnitudes and phases repeats every 16 points.8.17 (a)(i) Since 2π/Ω = 14π/(6π) = 7/3, the digital period is 7.(ii) The signal contains the frequency f = Ωf S /(2π) = 30000/7 Hz. For a digital period of 7, each point of the magnitude spectrum covers f S /N = 10000/7 Hz. Since each frequency is represented by kf S /N, a spike occurs in this magnitude spectrum at k = 3. Due to imaging, a second, symmetrically-placed spike occurs at N – 3 = 7 – 3 = 4.(b)(i) Since 2π/Ω = 10π/(3π) = 10/3, the digital period is 10.(ii) The signal contains the frequency f = Ωf S /(2π) = 3000 Hz. For a digital period of 10, each point of the magnitude spectrum covers f S /N = 1000 Hz. Therefore, a spike occurs in this magnitude spectrum at k = 3. Due to imaging, a second, symmetrically placed spike occurs at N – 3 = 10 – 3 = 7.(c)(i) For the first component 2π/Ω = 6, and for the second component 2π/Ω = 16. The digital period is the lowest common multiple of these two periods, or 48.(ii) The signal contains the frequencies f = Ωf S/(2π) = 10000/6 = 5000/3 Hz and f = Ωf S/(2π) = 10000/16 = 625 Hz. For a digital period of 48, each point of the magnitude spectrum covers f S/N = 10000/48 = 625/3 Hz. Therefore, spikes occur in this magnitude spectrum at k = 3 and k = 8. Symmetrically placed spikes occur at N – 3 = 48 – 3 = 45 and N – 8 = 48 – 8 = 40 as a result of imaging.(d)(i) As in part (c), the digital period is 48.(ii) The spikes occur in the same locations as in (c), but the higher frequency spike is twice as tall as the lower frequency spike.8.18 As evidenced by the zeros in the magnitude spectrum, some frequencies are excluded from this signal. The most significant contribution lies at a digital frequency of about 0.1 radian. The exact value is 0.113 radians. With f S = 20 kHz, f = Ωf S/(2π) = (0.113)(20000)/(2π), or about 360 Hz. The next biggest peak occurs at about 0.3 radians. The exact value is 0.336 radians, which corresponds to a frequency of 1070 Hz. Most of the important signal content lies below the fourth zero in the spectrum, at 0.395 radians or 1257 Hz.8.19 The number of points in the DFS spectrum gives the digital period of the underlying signal. The digital period in this case is N = 23. The periodic signal whose magnitude spectrum is shown has a large DC component and contributions at all harmonic frequencies, kf S/N = k(20000)/23 = 869.6k Hz. The first few harmonics are 869.6 Hz, 1739.1 Hz, 2608.7 Hz, …. The amplitudes of the harmonics decrease rapidly with frequency. The fundamental frequency of the signal is 869.6 Hz, so the period of the signal is NT S = 1.15 msec.8.20 (a) Ω-)X5.0(e5.0+Ωj-=(b) For a sampling frequency of f S= 16 kHz, the Nyquist frequency is 8 kHz. A cut-off of 2 kHz corresponds to a digital frequency of Ω = 2πf/f S = π/4 radians. The low pass filter extracts the lowest frequency elements in the signal.(c) Cut-off frequencies of 3 and 6 kHz correspond to digital frequencies of 0.375πand 0.75π radians. The band pass filter extracts the mid-range frequencies.(d) A cut-off of 7 kHz corresponds to a digital frequency of 0.875π radians. The high pass filter extracts only the highest frequency elements in the signal.8.21 (a) Each of the three terms is periodic. The digital period for each is 14, 3 and 16. The lowest common multiple for these integers is N = 336, the digital period for x[n]. The analog frequencies of the three terms are given by f = Ωf S/(2π). They are 1143, 5333, and 1000 Hz. The DFS frequencies are given by f = kf S/N = 47.6k, so the magnitude spectrum for the signal will contain peaks at k = 24, 112 and 21. These three peaks are shown below. Note the images of these peaks in the second half of the spectrum, at k = 363 – 21 = 342, k = 363 – 24 = 339, and k = 363 – 112 = 251.(b) The low pass filter will extract the two lowest-frequency peaks, at 1000 and 1143 Hz. The DFS magnitude spectrum will contain a peak at k = 21 and one at k = 24, plus imaged peaks at k = 363 – 21 = 342 and k = 363 – 24 = 339.(c) The band pass filter will extract the high frequency peak, at 5333 Hz. The DFS magnitude spectrum for the filtered output will contain a peak at k =112, plus an imaged peak at k = 363 – 112 = 251.(d) The high pass filter output will contain no peaks.8.22 (a) The spectrum has 64 points, so N = 64 is the digital period of the square wave. The fundamental frequency is f S/N = 4000/64 = 62.5 Hz.(b) The period in seconds is the reciprocal of the fundamental frequency, or NT S = 16 msec.(c) The DC component gives the average value of the signal. For this signal, the average is zero.(d) The harmonics present in the signal are odd multiples of the fundamental frequency. The only ones that lie below 500 Hz are 62.5k = 62.5, 187.5, 312.5, and 437.5 Hz. These frequencies correspond to the indices k = 1, 3, 5, 7.。
Matlab第八章部分课后答案

第八章
8.1
某随机系统的微分方程为ψϕϕϕϕ
k k dt d dt
d dt
d
=+++2
2
3
3
75.0075.0
已知===)0()0()0( ϕϕϕ0,)(1)(t t =ϕ试分别就k=2.5,5.0,12.5三种情况对系统进行仿真,
8.2已知系统模型pu
x x x pu x x
=--=+=212212 ,x1(0)=x2(0)=0,当p=1、2、10时,对以下进行仿
真
(1) u(t)=1
(2) u(t)=t
u(t)=sin(t)
(4) u(t)=1+sin(t)
(5) u(t)=1+t+sin(t)
8.3对如图所示的系统进行仿真(1)输入信号为人r(t)=1(t);
(2)输入的信号为如下分段函数
(2)
8.4液压调速系统如图所示,在稳定情况下在V环节前,加上f=-1的阶跃扰动,试求系
统在该扰动作用下IV环节和V环节的动态过程。
8.5某控制系统如图所示,选择增益k的值,使系统阶跃响应的超调量小于20%,且调节时间小于5s。
8.7潜艇潜水深度控制系统的简化结构简图如图所示,球系统在阶跃作用下地动态响应,并观察当舵机的k增大时系统性能有何改变。
8.8非线性控制系统如图所示,求系统在有饱和非线性和无饱和非线性两种情况下的动态响应,分析饱和非线性对系统动态性能的影响。
数字信号处理—原理、实现及应用(第4版)第8章 时域离散系统的实现 学习要点及习题答案
·185·第8章 时域离散系统的实现本章学习要点第8章研究数字信号处理系统的实现方法。
数字信号处理系统设计完成后得到的是该系统的系统函数或者差分方程,要实现还需要设计一种具体的算法,这些算法会影响系统的成本以及运算误差等。
本章介绍常用的几种系统结构,即系统算法,同时简明扼要地介绍数字信号处理中的量化效应,最后介绍了MA TLAB 语言中的滤波器设计和分析工具。
本章学习要点如下:(1) 由系统流图写出系统的系统函数或者差分方程。
(2) 按照FIR 系统的系统函数或者差分方程画出其直接型、级联型和频率采样结构,FIR 线性相位结构,以及用快速卷积法实现FIR 系统。
(3) 按照IIR 系统的系统函数或者差分方程画出其直接型、级联型、并联型。
(4) 一般了解格型网络结构,包括全零点格型网络结构系统函数、由FIR 直接型转换成全零点格型网络结构、全极点格型网络结构及其系统函数。
(5) 一般了解如何用软件实现各种网络结构,并排出运算次序。
(6) 数字信号处理中的量化效应,包括A/D 变换器中的量化效应、系数量化效应、运算中的量化效应及其影响。
(7) 了解用MA TLAB 语言设计、分析滤波器。
8.5 习题与上机题解答8.1 已知系统用下面差分方程描述311()(1)(2)()(1)483y n y n y n x n x n =---++- 试分别画出系统的直接型、级联型和并联型结构。
差分方程中()x n 和()y n 分别表示系统的输入和输出信号。
解:311()(1)(2)()(1)483y n y n y n x n x n --+-=+- 将上式进行Z 变换,得到121311()()()()()483Y z Y z z Y z z X z X z z ----+=+ 112113()31148z H z z z ---+=-+ (1) 按照系统函数()H z ,画出直接型结构如图S8.1.1所示。
数字信号处理习题及参考解答

目录习题一 (3)习题二 (26)习题三 (40)习题四 (61)习题五 (83)习题一1.1序列)(n x 如图T1.1所示,用延迟的单位采样序列加权和表示出这个序列。
图 T1.1 习题1.1图【解答】 任一数字序列都可表达为)()()(k n k x n x k -=∑∞-∞=δ所以图T1-1信号可表达为)3(2)1(3)()3(2)(-+-+-+-=n n n n n x δδδδ1.2 分别绘出以下各序列的图形: (1))(2)(1n u n x n =(2))(21)(2n u n x n⎪⎭⎫⎝⎛=(3)()3()2()nx n u n =-(4))(21)(4n u n x n⎪⎭⎫⎝⎛-=【解答】 用MATLAB 得到的各序列图形如图T1.2所示。
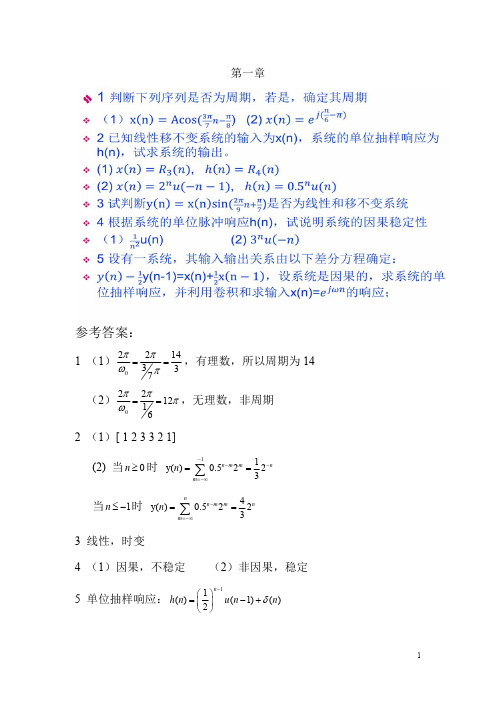
图T1.2习题1.2解答1.3 判断下列每个序列是否是周期性的;若是周期性的,试确定其周期。
(1)⎪⎭⎫ ⎝⎛-=873cos )(ππn A n x(2)⎪⎭⎫⎝⎛=n A n x 313sin )(π(3)⎪⎭⎫⎝⎛-=n j e n x 6)(π(4){}{}/12/18()Re Im jn jn x n e e ππ=+(5)16()cos(/17)jnx n e n ππ=【解答】(1)因为730πω=,而31473220==ππωπ,这是一有理数。
所以)(n x 是周期的,周期为14。
(2)因为3130πω=,而136313220==ππωπ,也为有理数。
所以)(n x 是周期的,周期为6。
(3)注意此序列的10=ω,πωπ220=,是无理数,所以)(n x 是非周期的。
(4)实际上()cos(/12)sin(/18)x n n n ππ=+因此)(n x 有两个频率分量,即1201πω=,1802πω=,而 24122201==ππωπ;02223618πππω==都是有理数,所以)(n x 是两个周期信号之和,第一个周期信号的周期241=N ,第二个周期信号的周期362=N ,因此)(n x 的周期是这两个周期的最小公倍数,即72123624)36,24gcd(3624),gcd(2121=⋅=⋅=⋅=N N N N N(5)()x n 是两个周期序列的乘积,其中132N =,234N =,所以该序列的周期是121232343234544gcd(,)gcd(32,34)2N N N N N ⋅⋅⋅====1.4 已知序列)]6()()[6()(---=n u n u n n x ,画出下面序列的示意图。
数字信号处理课后答案_史林版_科学出版社
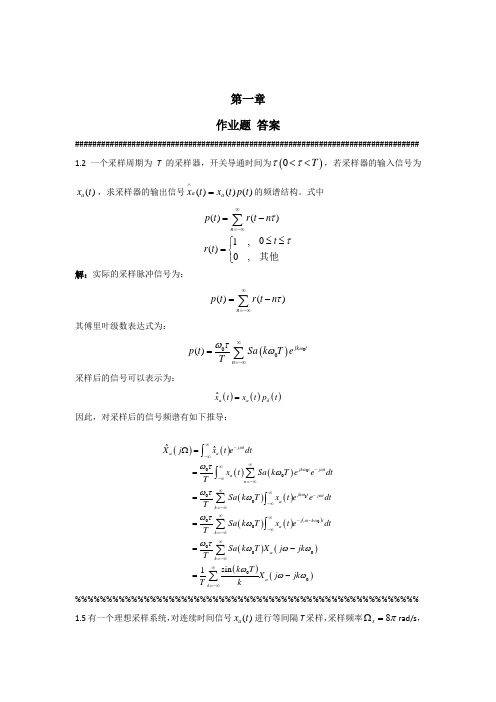
第一章 作业题 答案############################################################################### 1.2一个采样周期为T 的采样器,开关导通时间为()0T ττ<<,若采样器的输入信号为()a x t ,求采样器的输出信号()()()a a x t x t p t ∧=的频谱结构。
式中()()01,()0,n p t r t n t r t ττ∞=-∞=-≤≤⎧=⎨⎩∑其他解:实际的采样脉冲信号为:()()n p t r t n τ∞=-∞=-∑其傅里叶级数表达式为:()000()jk tn p t Sa k T eTωωτω∞=-∞=∑采样后的信号可以表示为:()()()ˆa a xt x t p t δ= 因此,对采样后的信号频谱有如下推导:()()()()()()()()()()()()()0000000000000ˆˆsin 1j t a a jk t j t a n jk t j t a k j k ta k ak a k X j x t e dtx t Sa k T e e dtTSa k T x t e e dtTSa k T x t edtTSa k T X j jk Tk T X j jk T kωωωωωωωωτωωτωωτωωτωωωωωω∞--∞∞∞--∞=-∞∞∞--∞=-∞∞∞---∞=-∞∞=-∞∞=-∞Ω=====-=-⎰∑⎰∑⎰∑⎰∑∑%%%%%%%%%%%%%%%%%%%%%%%%%%%%%%%%%%%%%%%%%%%%%%%%%%%%%%% 1.5有一个理想采样系统,对连续时间信号()a x t 进行等间隔T 采样,采样频率8s πΩ=rad/s ,采样后所得采样信号()a x t ∧经理想低通滤波器()G j Ω进行恢复,已知()41/4,,4G j ππ⎧Ω≤⎪Ω=⎨Ω>⎪⎩今有两个输入信号12()cos(2)()cos(5)a a x t t x t t ππ==和,对应的输出信号分别为12()()a a y t y t 和,如题1.5图所示,问12()()a a y t y t 、有没有失真,为什么?题1.5图 理想采样系统与恢复理想低通滤波器解:因为是理想采样系统,因此采样后的信号频谱可以表示为:()()1ˆa a s k X j X j jk T ∞=-∞Ω=Ω-Ω∑8s πΩ=,12πΩ=,25πΩ=,折叠频率为2s Ω,而滤波器对4πΩ≤的信号通过,因此有如下图:结论:1)1()a y t 不失真、2()a y t 失真。
数字信号处理习题答案及matlab实验详解.pdf
阶跃响应为: y[n] x[n] h[n] x[m]h[n m] h(n m), n m, m 0
m
m0
即 y(0) 0, y(1) 0.25, y(2) 0.5, y(3) 0.75,其余y(n) 1, (n 3)
利用函数 h=impz(b,a,N)和 y=filter(b,a,x)分别绘出冲激和阶跃响应 b=[0,0.25,0.25,0.25,0.25]; a=1; x=ones(1,100); h=impz(b,a,100);y=filter(b,a,x) figure(1) subplot(2,1,1); stem(h,’.’); subplot(2,1,2); plot(y,’.’);
4
解:(1)系统的转移函数是是其单位抽样响应的 Z 变换,因此
H (z)
1 1 z1
1 1 0.3z1
1 1 0.6z1
(1
3 3.8z1 1.08z2 z1)(1 0.3z1)(1 0.6z1)
1
3 1.9
3.8z1 1.08z2 z1 1.08z2 0.18z
3
Z 1
系统的零极点图如下图所示: B=[3,-3.8,1.08]; A=[1,-1.9,1.08,-0.18]; [Z,P,K]=tf2zp(B,A); Zplane(B,A)
5
单位抽样响应:
h(n)
1 2
n1
u
(n
1)
(n)
1
y(n) x(n) * h(n)
2 m1
1 2
m1
e
j (n m)
e
jn
e
jn
e j
1 2 1
2
n
u(n1)
- 1、下载文档前请自行甄别文档内容的完整性,平台不提供额外的编辑、内容补充、找答案等附加服务。
- 2、"仅部分预览"的文档,不可在线预览部分如存在完整性等问题,可反馈申请退款(可完整预览的文档不适用该条件!)。
- 3、如文档侵犯您的权益,请联系客服反馈,我们会尽快为您处理(人工客服工作时间:9:00-18:30)。
1. 数字信号处理器有哪些结构特点?
答:1. DSP内部采用的是程序空间和数据空间分开的哈佛结构;2. 多总线结构;3. 流水线结构:在DSP中,执行一条指令,需要通过取指、译码、取操作数和执行四个阶段。
在程序运行过程中,这四个阶段不是依次进行的,而是重叠的进行的;4. 多处理单元:DSP内部通常包括有算术逻辑运算单元(ALU)、辅助寄存器运算单元(ARAU)、累加器(ACC)以及硬件乘法器(MUL)等多个处理单元。
它们可以在一个指令周期内同时进行运算;5. 硬件配置强:新一代DSP的接口功能愈来愈强,如:TMS320C5000系列芯片片内具有串行口、主机接口(HPl)、DMA控制器、软件控制的等待状态产生器、锁相环时钟产生器以及实现在片仿真符合IEEEll49.1.标准的测试访问口,更易于完成系统设计。
许多DSP芯片都可以工作在省电方式,使系统功耗降低。
2. TMS320C54x系列DSP片内有多少条总线,具体说明有哪些?
答:TMS320C54x系列DSP是TI公司于1996年推出的新一代定点数字信号处理器。
其采用先进的修正哈佛结构,片内有8条总线,分别为1条程序存储器总线,3条数据存储器总线和4条地址总线。
3. TMS320VC5402的在片外围电路有哪些?
答:1. 软件可编程等待状态发生器;2. 可编程分区转换逻辑电路;3.带有内部振荡器或用外部时钟源的片内锁相环(PLL)时钟发生器;4. 时分多路(TDM)串行口;5. 缓冲串行口(BSP);6. 2个16位定时器;7. 8位并行主机接口(HPl);8. 外部总线关断控制,以断开外部的数据总线、地址总线和控制信号。
4. TMS320VC5402有哪些片内资源?
答:TMS320VC5402的片内资源按功能包括运算单元、寄存器、片内RAM 和ROM、片外存储器接口、DMA控制器、主机接口、串口、定时器、时钟产生器和中断控制器。
5. CCS有几种工作模式?具体说明。
答:CCS有两种工作模式。
1. 软件仿真器模式:可以脱离DSP芯片,在PC机上模拟DSP的指令集和工作机制,主要用于前期算法的实现和调试;2. 硬件在线编程模式:可以实时运行在DSP芯片上,与硬件开发板相结合在线编程和调试应用程序。
6. 如何添加和删除一个存储器映射范围?
答:1. 添加一个新的存储器映射范围:① 通过选择Option->Memory Map打开Memory Map对话框。
② 在Memory Map对话框中选中Enable Memory Mapping,可以使用存储器映射。
③ 选择需修改的页面(Program,Data或IO)。
如果程序只使用一个存储器页面,则可以跳过这一步。
④ 按照命令文件的存储器定义,在Starting域键入起始地址,
在Length域键入存储器长度,在Attributes域选择存储器的读/写属性,再单击Add按钮即添加一个新的存储器映射范围;2. 删除一个存储器映射范围:将一个已有存储器映射属性设为None-No
Memory/Protected,可将该存储器范围删除。
另一个删除存储器范围的方法是在Memory Map列表框内选中需删除的存储器范围,按Delete按钮将其删除。
7. 如何创建一个新工程?
答:进入CCS主窗口,选择菜单栏中Project下的New项,将弹出新建工程窗口,键入工程名,在Location一栏处设置要存放的位置,下面接着在Project一栏处选择工程文件类型,最后在Target一栏中选择目标板,当工具有多个目标板时,这个选择是必要的。
完成后系统将创建一个名为*.pjt的工程文件。
8. 如何将工程相关文件添加到工程中?
答:新建一个工程后,在Project菜单中选择Add Files to Project选项,选择需要添加的文件,点击打开按钮将其添加到该工程中。
9. 断点的作用是什么?如何设置断点?
答:断点的作用是当程序运行到设置的断点处时停止运行程序,只有再次按Run才继续执行程序,在源程序中需要设置断点的地方双击或点击断点设置按钮
来设置断点,去出断点的方法相同或者单击Remove All按钮将所有断点删除。
10. 如何添加变量到Watch窗口?
答:在源程序中选择要查看的变量符号,右单击在弹出的选项卡中选择Add to Watch Window,此时将在Watch Window中看到所添加的变量。
11. .cmd文件的作用是什么?
答:.cmd文件用于DSP代码的定位,由于DSP 的编译器的编译结果是未定位的,DSP没有操作系统来定位执行代码,每个客户设计的DSP 系统的配置也不尽相同,因此需要用户自己定义代码的安装位置。
12. Run命令和Animate命令的区别是什么?
答:Run命令在遇到断点后会停止运行程序,只有再次按Run才继续执行程序。
Animate命令在遇到断点时会暂停运行程序并刷新所有窗口,之后继续运行程序,所以常被用来连续刷新变量窗口和生成graph图形等。