X-ray and soft gamma-ray behaviour of the Galactic source 1E 1743.1-2843
JEM-X background models
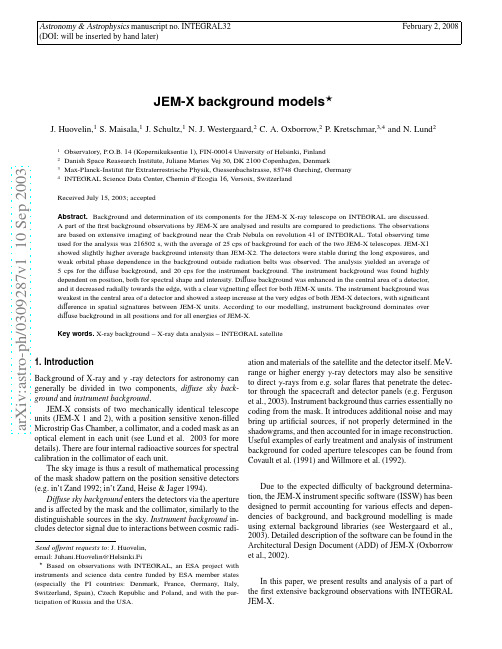
a r X i v :a s t r o -p h /0309287v 1 10 S e p 2003Astronomy &Astrophysics manuscript no.INTEGRAL32February 2,2008(DOI:will be inserted by hand later)JEM-X background models ⋆J.Huovelin,1S.Maisala,1J.Schultz,1N.J.Westergaard,2C.A.Oxborrow,2P.Kretschmar,3,4and N.Lund 21Observatory,P.O.B.14(Kopernikuksentie 1),FIN-00014University of Helsinki,Finland 2Danish Space Reasearch Institute,Juliane Maries Vej 30,DK 2100Copenhagen,Denmark 3Max-Planck-Institut f¨u r Extraterrestrische Physik,Giessenbachstrasse,85748Garching,Germany 4INTEGRAL Science Data Center,Chemin d’Ecogia 16,Versoix,Switzerland Received July 15,2003;accepted Abstract.Background and determination of its components for the JEM-X X-ray telescope on INTEGRAL are discussed.A part of the first background observations by JEM-X are analysed and results are compared to predictions.The observations are based on extensive imaging of background near the Crab Nebula on revolution 41of INTEGRAL.Total observing time used for the analysis was 216502s,with the average of 25cps of background for each of the two JEM-X telescopes.JEM-X1showed slightly higher average background intensity than JEM-X2.The detectors were stable during the long exposures,and weak orbital phase dependence in the background outside radiation belts was observed.The analysis yielded an average of 5cps for the di ffuse background,and 20cps for the instrument background.The instrument background was found highly dependent on position,both for spectral shape and intensity.Di ffuse background was enhanced in the central area of a detector,and it decreased radially towards the edge,with a clear vignetting e ffect for both JEM-X units.The instrument background was weakest in the central area of a detector and showed a steep increase at the very edges of both JEM-X detectors,with significant di fference in spatial signatures between JEM-X units.According to our modelling,instrument background dominates over di ffuse background in all positions and for all energies of JEM-X.Key words.X-ray background –X-ray data analysis –INTEGRAL satellite 1.Introduction Background of X-ray and γ-ray detectors for astronomy can generally be divided in two components,di ffuse sky back-ground and instrument background .JEM-X consists of two mechanically identical telescope units (JEM-X 1and 2),with a position sensitive xenon-filledMicrostrip Gas Chamber,a collimator,and a coded mask as anoptical element in each unit (see Lund et al.2003for moredetails).There are four internal radioactive sources for spectralcalibration in the collimator of each unit.The sky image is thus a result of mathematical processingof the mask shadow pattern on the position sensitive detectors(e.g.in’t Zand 1992;in’t Zand,Heise &Jager 1994).Di ffuse sky background enters the detectors via the apertureand is a ffected by the mask and the collimator,similarly to thedistinguishable sources in the sky.Instrument background in-cludes detector signal due to interactions between cosmic radi-2Huovelin et al.:JEM-X background modelsFig.1.Spatial distribution of the background.Upper panels:JEM-X1,lower panels,JEM-X2.Left panels:Instrument back-ground,Right panels:Diffuse background.The white rectan-gles denote the positions of the calibration sources,which havebeen excluded from our analysis.The collimator signature canbe seen as weak vertical and horizontal line structures in the shadowgrams.The broad vertical lines are due to dead anodes.Also some photon leak from the calibration sources is evident.The sharp and very narrow lines are graphical artifacts causedby the plotting routine.Total intensity of each shadowgram isnormalized to1.Table1.INTEGRAL background pointings during cycle41.45324.0+210850.17000053645.0+122415.14082553645.2+122546.44277553645.3+122543.564468Huovelin et al.:JEM-X background models3Table2.The normalization factors of the background con-tinuum components(10−3photons keV−1cm−2s−1at1keV). Mean and standard deviation of values derived from the six extraction regions at each radius are given.The energy range used in thefitting is4-33keV.Diffuse denotes diffuse sky back-ground,Flat denotes theflat continuum of the instrument back-ground.Note that the normalization is determined on the basis of source spectra from1R in R out JEM-X1JEM-X2pix pix Diffuse Flat Diffuse FlatThe diffuse background decreases towards the edges of the detector,as expected.The instrument background is stronger than expected,dominating the spectrum at all radii.The ten expected K-shell lines(from the109Cd and55Fe calibration sources,collimator(Mo),and detector gas(Xe))were detected close to their nominal positions.This implies that the energy scale is correctly determined.The previously unknown weak line near13keV turned out to be the uranium L-shell line.It most likely originates in the detector beryllium window.Near the edges of the detector,the background is highly nonuniform. Additional nonuniformity in the outer parts was introduced by photon leak from calibration sources,which could not be com-pletely eliminated.We also searched for possible dependence of background on the orbital phase of the observations.The spectrum varied with a range of approximately5%between three separate or-bital sections well outside radiation belts.The variation is sta-tistically significant but small.Also dependence on solar aspect angle and particle radiation level can be utilised in the JEM-X ISSW background modelling.Significant variations were not found.The variation in the solar aspect due to different point-ings was20◦,which is probably not sufficiently large for stud-ies of an effect on instrument background.Also,there was no proper indicator of particle radiation level on INTEGRAL available during our observations to search for a correlation.4.ConclusionsWe have analyzed a part of thefirst INTEGRAL background observations with JEM-X.Estimates of the spatial and spec-tral distributions are obtained for diffuse sky background and instrument background.The total background observed for JEM-X1was28cps,for JEM-X223cps,and25cps on the average.A part(∼1/5)of the excessively large background may be due to residual Crab Nebula emission in JEM-X data.According to XSPECfitting,the diffuse background was at maximum in the centre of the detector and it decreasedra-Fig.2.Four sample background spectra extracted from differ-ent parts of JEM-X2.At the sides of the detector,a blend of K-shell lines from the spacecraft structure is seen.Note also the prominent lines in spectrum extracted from the surround-ings of the calibrationsources.Fig.3.The background extraction regions.Units in both axes are pixels.All regions cover an equal area of the detector. Exclusion of calibration sources(not shown)reduces the ac-tual area of some regions.dially towards the edge,which is due to vignetting.There is also slight asymmmetry in the spatial distribution of the diffuse background,which is caused by a small angular misalignment of the detector plane.The count rate for diffuse background was approximately20%of the total background.The instrument background intensity and spectrum are highly position dependent,with a steep increase near the edges at all radial directions.Leakage of the radiative calibration sources causes residual line emission in the neighbourhood of4Huovelin et al.:JEM-X background modelsTable3.The lines detected from the background.Line ID is the element and transitions producing the line,E is the line en-ergy in keV(Thompson et al.,2001).Subscripts1and2denote the detectors JEM-X1and2,F is the largest line strength de-tected,¯F(N)mean of detected line strengths where N is the number of regions from which the line is detected(maximum is48regions/detector).The Mn/Fe line at6.45keV is a blend of Mn Kβ(6.49keV)and Fe Kα(6.40keV).Line strengths are given in10−3photons cm−2s−1.Note that the line strengths are determined on the basis of source spectra from1Line E F1¯F1(N)F2¯F2(N)Origin the source positions.The count rate for the instrument back-ground was approximately80%of the total background.The total background level varied with a range of approx-imately5%between different orbital sections.the variation is significant,but small.Also,it is impossible to say,what fraction of this,if any,is caused by the simultaneous variation of the so-lar aspect angle of the satellite,and the unknown variations of particle radiation level.We plan to separate these effects by the support of future background observations.Although our modelling is simple,and does not provide accurate absolute estimates of physical backgroundfluxes,it yields information which can be applied to the JEM-X analysis software to properly account for background contribution in spatially resolved spectral data.A thorough analysis of JEM-X background will be presented in a future paper. Acknowledgements.Authors from the Observatory,University of Helsinki acknowledge the Academy of Finland,TEKES,and the Finnish space research programme ANTARES forfinancial support in this research.J.Schultz is grateful for thefinancial support of the Wihuri Foundation.The Danish Space Research Institute acknowl-edges support given to the development of the JEM-X instrument from the PRODEX programme.ReferencesArnaud,K.A.,1996,Astronomical Data Analysis Software and Systems V,eds.Jacoby G.and Barnes J.,ASP Conf.Series V ol.101.Covault,C.E.,Grindlay,J.E.,Manandhar,R.P.,and Braga,J.,1991, IEEE Transact.Nucl.Sci.,V ol.38,No.2.Ferguson,C.,Barlow,E.J.,Bird,A.J.,et al.,2003A&A,this volume in’t Zand,J.,1992,Ph.D.thesis,SRON.in’t Zand,J.,Heise,J.,Jager,R.,1994,A&A288,665.Lund,.N.,Brandt,S.,Budtz-Joergensen,C.,et al.,2003,A&A,this volumeMarshall,F.E.,Boldt,E.A.,Holt,S.S.,et al.,1980,ApJ235,4 Oxborrow C.A.,Kretschmar,P.,Maisala,S.,Westergaard,N.J., Larsson,S.,2002,Instrument Specific Software for JEM-X: Architectural Design Document,DSRI homepage:www.dsri.dk Thompson, A.C.,Attwood, D.T.,Gullikson, E.M.,et al.,2001,“The X-ray data booklet”,2nd ed.,Lawrence Berkley National Laboratory,Univ.of California,available at / Westergaard,N.J.,Kretschmar,P.,Oxborrow,C.A.,et al.,2003,A& A,this volumeWillmore,A.P.,Bertram,D.,Watt,M.P.,et al.,1992,MNRAS258, 621。
英国“钻石”同步辐射光源(DIAMOND)

英国“钻石”同步辐射光源(DIAMOND)2010-08-10 | 文章来源: | 浏览次数: 659 |【大中小】璀璨夺目的“钻石”光源英国第一台第三代同步辐射光源DIAMOND坐落于英国南牛津郡(South Oxfordshire)迪德科特镇(Didcot)。
它的名字来源有两种说法:一种说法是该项目的发起人迈克普尔(Mike Poole)由DIpole And Multipole Output for the Nation at Daresbury(国家在达斯伯里的偶极和多极输出)的缩写构思了DIAMOND这个名字;另一种说法是DIAMOND表达了同步辐射光既硬(指“硬”X射线的电磁波谱区)又明亮,就像“钻石”。
不管哪种说法更准确,与法国“太阳”光源(SOLEIL)相比,英国“钻石”光源(DIAMOND)的名字毫不逊色,DIAMOND 光源就像钻石那样璀璨夺目。
DIAMOND光源的紫外线和X射线具有远非常规光源可比的品质和亮度,其亮度为医用X光机的1千亿倍,科技工作者用它将能更深入地研究物质、材料及生物样品的基本结构。
利用同步辐射技术开展的科学实验,可望在生物技术、医学、环境和材料研究中取得突破性进展。
英国南牛津郡的迪德科特镇DIAMOND光源鸟瞰2002年,英国政府批准建造DIAMOND光源,其辐射能量及光束性能首先被优化为高能的欧洲同步光源ESRF的补充。
它的主要目标是生成高亮度、高强度的可调光源,建成英国第一的研究基地,开展不同学科领域交叉学科的研究。
DIAMOND是40多年来英国投资兴建的最重要的大科学装置和最大的民用科研基地,由英国科学和技术设施委员会STFC的中心实验室研究理事会CCLRC( Council for the Central Laboratory of the Research Councils)与英国最大的生物医学研究慈善机构——威康信托基金会(Wellcome Trust)共同建设,双方各投资86%和14%。
LND两年月表辐射剂量测量结果

0254-6124/2021 /41(3)-439-06Chin. J. Space Sci.空间科学学报Z H A N G Shenyi, H O U Donghui, W I M M E R-S C H W E I N G R U B E R R F, S U N Yueqiang, W A N G Chunqin, C H A N G Zheng, X U Zigong. S H E N Guohong, Y U A N Bin, X U E Changbin. Radiation dose of L N D on the lunar surface in two years (in Chinese). Chin. J. Space Sci.,2021, 41(3): 439-444. DOI: 10.11728/cjss2021.03.439L N D两年月表辐射剂量测量结果+张珅毅 i’2’3’4侯东辉 l2’3’4WIMMER-SCHWEINGRUBER R F 1,5孙越强W’3王春琴W’3常峥1’2’3徐子贡5沈国红以3袁斌1,2’3薛长斌11(中国科学院国家空间科学中心北京100190)2(天基空间环境探测北京市重点实验室北京100190)3(中国科学院空间态势感知重点实验室北京100190)4(中国科学院大学北京100049)5(德国基尔大学实验应用物理研究所基尔24118)子商要月球表面的辐射剂量是影响航天员安全和月表驻留时间的重要参数,通过对月表的粒子辐射测量可以为 航天员的辐射安全防护提供重要依据.利用嫦娥四号着陆器上搭载的月表中子与辐射剂量探测仪二年的观测数据得 到:月表粒子辐射在硅中的平均总吸收剂量率为U.e e i C U S/i G y.h-1,中性粒子吸收剂量率为2.67士0.16/xGy.h-1.辐射剂ti:率随时间出现缓慢的下降,L E T谱的变化则很小.同时观测到了2020年12月太阳活动末期由于银河宇 宙线福布斯K降导致的辐射剂量率降低.关键词嫦娥四号,月表,辐射剂量,航天员中图分类号V 478R a d ia tio n D ose o f L N D on th e L u n a rS urface in T w o Y earsZHANG Shenyi1,2,3,4HOU Donghui1,2,3,4WIMMER-SCHWEINGRUBER R F1-5 SUN Yueqiang1’2’3WANG Chunqin12-3CHANG Zheng1’2’3XU Zigong5SHEN Guohong1’2,3YUAN Bin1,2,3XUE Changbin1l(National Space Science Center, Chinese Academy of Sciences, Beijing100190)2(Beijing Key Laboratory of Space Environment Exploration, Beijing100190)3(Key Laboratory of Environmental Space Situation Awareness Technology, Beijing100190)4( University of Chinese Academy of Sciences, Beijing100049)^(Institute of Experimental and Applied Physics, Christian-Albrechts-University, Kiel24118) **国家自然科学基金项目资助(41941001,D020104)2021-04-16收到原稿,2021-05-03收到修定稿E-mail:***********.cn440Chin. J. Space Sci.空间科学学报 2021, 41(3)Abstract T h e radiation d o s e o n the lunar surface is a n i m p o r t a n t p a r a m e t e r affecting the safety of astronauts a n d the residence t i m e of the lunar surface. T h e m e a s u r e m e n t of t he particle radiation o n the lunar surface c a n provide a n i m p o r t a n t basis for the radiation safety protection of astronauts. B a s e d o n the two-y ea r observation d a t a of lunar n e u t r o n a n d radiation dos e detector o n C h a n g1E-4 lander, the aver a g e total a b s o r b e d dose rate of lunar particle radiation in silicon is12.66士0.45/i G y.h-1, a n d the a b s o r b e d dose rate of neutral particle is 2.67士0.16/i Gy.h-1.T h e radiation do s e rate decreases slowly w i t h time, b u t the c h a n g e of L E T s p e c t r u m is very small. T h e decrease of radiation dose rate d u e to the decrease of f ubusch of G C R at the e n d of solar activity inD e c e m b e r 2020 w a s observed.Key words C h a n g,E-4, L u n a r surface, R a d iation dose, A s t r o n a u t〇引言随着中国嫦娥四号/五号任务的圆满成功,月球 科研站及月球基地等月球探测步伐也正在逐步开展,最终实现人类月球深空的长期驻留.空间辐射暴露 是影响航天员健康的主要风险之一 [1_31,因为长期 暴露在银河宇宙射线中可能引起航天员一系列缓发 的健康问题,例如白内障、癌症以及中枢神经系统或 其他器官系统+5i的退化性疾病.月球表面的粒子辐射来源主要有三种:一是长期 存在银河宇宙线(G C R)%G C R受到行星际磁场的 调制发生缓慢的变化;二是偶发的太阳高能粒子事 件,太阳发生耀斑及日冕物质抛射时会发出大量的 高能粒子,在较短的时间内对月球表面产生强烈的辐 射A三是S E P s和G C R通过与月壤的作用产生的 二次粒子,主要是中子和7射线[8].嫦娥四号着陆器在2019年1月3日02:26 U T登陆月球背面的冯卡门陨石坑.在此之前,尚未对月 球表面的辐射剂量率进行过主动测量(即时间分辨).在阿波罗任务期间,航天员到达月球时虽然随身携带 了剂量仪,但是在月球表面的时间段内的辐射数据从 未进行过报告为了评估辐射暴露,必须利用探测器系统测量 相关量.吸收剂童D是沉积在探测器中的能量五 (单位:k e V)与探测器质量(m)的比值,常用的单 位为格瑞(G y z^k f1).将吸收剂量除以累积的时 间可以得到剂量率(单位:G y h-1).利用两个探测 器符合的逻辑工作方式以及其中一个探测器中的沉 积能量分布,可以获得线性能量转移谱L E T (单位: k e V./m T1).由于人体不是由硅构成的,为了便于比较不同测董的剂量、剂量率以及L E T谱,通常使 用1.301U1的恒定剂量转换系数.将硅中的测量值转 换为在水中相应的物理量.嫦娥四号任务在2019年1月登陆月球背面后, 目前已持续在轨工作超过25个月昼,月表中子与辐 射剂量探测仪(L u n a r L a n d e r N e u t r o n s a n d D o s i m et r y,L N D)112,131 对月表的粒子辐射环境和辐射剂量 进行测量,包括质子、电子、重离子能谱,带电粒子 和中性粒子的辐射剂量以及L E T谱[141.L N D安装在嫦娥四号着陆器的有效载荷舱内,由10片双灵敏区硅固体探测器(S S D)组成,这10 片硅探测器命名为A-J.总吸收剂量和剂量率通过探 测器B测量,中性粒子的吸收剂量和剂量率通过探 测器C的内灵敏区C1测量,紧密靠近的探测器B和D以及探测器C的外灵敏区C2作为反符合用于 区别带电粒子,L E T谱由d£/d:c确定.1数据结果图1给出了 L N D探头在嫦娥四号着陆器的位 置,图1中的红色箭头指向为L N D的探测指向,为 了保护L N D,舱门在寒冷的月夜关闭,在月昼时打开. 图2显示了 L N D在2019年5月至2021年1月两 年时间共21个月昼期间(着陆器未休眠期间)获得 的辐射剂量测量结果.图2(a)为辐射总剂量率,包括 带电粒子和中性粒子(中子、7射线)的贡献;图2(b)为中性粒子的辐射剂量率;图2(c)为带电粒子的辐 射剂量率;图2(d)为穿透高能带电粒子的通董(质 子>34.8M e V,H e >40M e V),也代表了银河宇宙线 的通量;图2(e)为地面测量到的奥卢中子结果,其也张珅毅等:L N D 两年月表辐射剂量测量结果44114.513.512.511.510.5 3.63.22.82.42.01211109(a )I —T TT I L-'1^ i i i l 1 1 卜i~~l --H-i:Apr.2019(c)(e )Jul.Oct.Jan.2020DateApr.Jul.Oct.Jan.2021图2 L N D 在嫦娥四号测量到的辐射环境随时间演化结果Fig. 2 T e m p o r a l evolution of the radiation environment o n the M o o n as mea s u r e d by L N D o n C h a n g 5E-4代表了宇宙线的变化情况.通过图2可以看到21 个月昼内月球表面的平均辐射剂量率为12.66±O^^G y.h -1 (S i ),等效到人体中的辐射剂量率为16.46/i G y .h -1 (H 20),其中,中性粒子的辐射剂量 率为S .e T i O .i e /i G y .h -1 (S i ),约占总辐射剂量的 21%.从图2可以看到辐射总剂量率和中性粒子辐 射剂量率的变化与穿透粒子的通童有明显的正相关,与空间物理学认知相符.从2020年10月的第21个月昼开始辐射剂量 率出现了缓慢的下降(见图2阴影部分),这是由于 行星际磁场的变化造成了银河宇宙线的通最降低导 致的,最直接的证据是LN D测量到的同时间段的穿透粒子数M 和奥卢中子数量也出现了降低.图3显示了 LN D在第7, 9, 13, 16. 20月昼期间图1 L N D 探头在嫦娥四号着陆器的位置,红色箭头为视场方向Fig. 1 L N D sensor h ead (whose field of view is indicated by red arrow) is installed inthe C h a n g ’E-4 lander payload c o m p a r t m e n t(l -M >,a 3(l-M>,D 3(l =>»o 3/o sc !) (■L Jn -M r .*-.E 3-_U J l u /H l n 03/(!s =l a /(!s c !)i Q 5U Q L O Q /O o u -i s u 3d2Z1010'210—110°101102L ET (inH 2〇)/(keV ^m-1)103图3在不同月昼得到的L N D 的L E T 谱(已转化为水)Fig. 3 Linear Ene r gy Transfer (L E T ) spectra(converted to L E T in water) me a su r e d during fourdifferent time periods将L N D的测量结果与月船一号(C h a n d r a y a a n -1)上的粒子载荷R A D 0M [16]和月球轨道器(L R O )上的载荷C R a T E R M的测量结果进行比较,结果列于表1.由于C h a n d r a y a a n -1, LR O和嫦娥四号进行的测量是在太阳平静期进行的,可以假设剂量率的差异主 要是由轨道髙度的差异造成的,即月球提供的屏蔽不 同.然而这种简单的解释并不合理,通过将文中的结 果与没有被月球遮挡的部分(立体角)进行比较可以 看出,屏蔽与吸收剂量并不存在相应的比例关系.R A D O M在2008年离月球很远的地方测得的剂量率与2019年在月球表面测得的剂量率不可比. 原因主要有两点:第一,其处在不同的太阳周期.例 如,从2015年开始,美国好奇号上的辐射评估探测 器R A D在火星观测到银河宇宙射线的剂量率增加了 50%.第二,L N D测量的能量范围与RA D O M和获得的L E T谱结果.可以看到在近两年的时间内月表粒子辐射L E T谱的变化很小,这是因为银河宇宙 线的变化很小,更大的变化需要更长期的观测.L N D在轨期间遇到了两次太阳粒子爆发事件,分别为2019年5月6日[15丨和2020年12月1日,2019年5月的太阳质子事件中L N D的9〜21 M e V高能质子通量出现了少量增长,但L N D的辐射剂量率并没有出现明显的变化.这是因为太阳质子事件 爆发等级不高,能够加速质子的通量和能量也较低, 被仪器挡光层和第一片探测器A 阻挡或者降低了能 量,导致了其在B 探测器的剂量测量中所占比例较442小.2020年12月1日的太阳活动中,磁场出现了 明显的变化,k e V量级的粒子增长大约持续了 10天,而M e V量级的高能粒子并没有出现明显变化,LN D在2020年12月9日开机,处于太阳活动的末期,从 图4可以看到此时测量到的辐射剂量出现了一个明 显的下降,这是因为太阳活动造成了行星际磁场的扰 动,该扰动引起了银河宇宙线的福布斯下降导致辐射 剂量降低,该福布斯下降使辐射剂量比正常水平少下 降了约10%左右.2分析讨论Chin . J . Space Sci .空间科学学报 2021,41(3)13 18 23 12 17 22 11 1621 10 15 20 9 1419 8 13 18Aug. 2020 Sept. Oct. Nov. Dec. Jan. 2021Datew^w w w (q _I J S • S 3 • O I T i _l >3e/ s 3p }y E cu图4太阳质子爆发期间辐射剂量的变化情况Fig. 4 D o s e rate me as ur ed in period of S EP张珅毅等:L N D 两年月表辐射剂量测量结果4433110Jan. 20198CRaTERFeb. 2019$16514工112103 5 7 9 11 312 4 6 8 10Jan. 2019Feb. 2019图5 L N D 和C R a T E R 的剂量率测M. C R a T E R 测量到的剂量率已对月球提供的几何屏蔽进行了修正.垂直线标记L R O 位于嫦娥四号正上方的时间点,指示剂量率值是此时的测量值Fig. 5 Dose rate measurements by L N D and C R a T E R. Dose rates measured by C R a T E R are corrected for the geometrical shielding provided by the Moon. T h e vertical line marks the time point w h e n L R O was located rightabove C h a n g 5E-4, and the dose rate values indicated in the panels are the values measured at this timeC R a T E R不同.LN D也能够测量更低能试的粒子,这 些低能粒子比能M 更高、穿透力更强的粒子更多,对 剂量率的贡献也更大.L N D与C R a T E R测量能量范围不同对剂量结果的影响可以通过具体实例看到,通过对比同一时间 段、同一位置(2019年2月2日01:30U T) LN D和C R a T E R测量值可以看出1^0和〇^丁瓦11覆 盖不同能量测量范围对剂量的影响(见图5).此时. 两台仪器都处于相同的日球层条件,但在各自测量上 下能量截止阈值上存在差异.图5给出了 LN D和C R a T E R 在2019年初L N D活动时间段的测量,垂直线表示LR O和嫦娥四号在月球经纬度大致相同的时间段.并在图中给 出了测M 剂t t 率值.结果表明,D 1和D2的剂量率为 13.2/i G y .h -1, LN D剂量率为 13.29/i G y .h -1,L N D测量的剂量率与C R a T E R的结果十分类似.需要注意的是,月球的屏蔽效应已经在公布的CR a-T E R剂量率数据中得到修正,但是如果没有详细考虑两种仪器的响应范围及其屏蔽差异.仍然不能比 较C R a T E R和L N D的剂量率.虽然LN D的B探测器由于其位于LN D和嫦娥四号着陆器内受到不同程度的屏蔽,但C R a T E R的D1和D2探测器也表1不同时间段内不同轨道测量到的月球辐射剂量率T a b le 1D o se r a te m e a s u re d in d iffe re n t o rb its o f th e M o o n a t d iffe re n t tim e卫星测量时间段轨道高度/k m辐射剂 f i /k G y.h -1)未被月球遮挡/(%)参考文献Chandrayaan-1 3 to 8 Nov. 200820 000〜30 00012.76100[18]Chandrayaan-120 M a y to 28 Aug. 200920010.772[18]Chandrayaan-120 Nov. 2008 to 18 M a y 20091009.7666[18]L R O 17 Sept. 2009 to 31 M a y 2010509.17 〜11.2562[19]C h a n g ’E-41 M a y 2019 to 19 Jan. 202012.6650一LND-M ^o5/o x.£)c 】ll被来自仪器和LR O 卫星的不同材料厚度屏蔽.CRa-T E R 探测器D1 (148/m i)探测器由0.82 m m 厚的铝入口窗口屏蔽,其1m m 厚的D 2探测器被0.82mmA1和148 y m 的硅屏蔽.LND 的B 探测器在最小屏蔽方向上被25/xm 的A1及50/xm 的kapton 和0.5 mm 的硅屏蔽.本文的测量结果涵盖了 LND 在月表两年的辐射 剂量结果,这些结果与未来人类月球任务的安排和规 划直接相关.参考文献[1] N A S A. Space Radiation Cancer Risk Projections andUncertainties-2012 [R ]. Houston: N A S A , 2013[2] S T R A U B E U, B E R G E R T, R E I T Z G, et al. Operationalradiation protection for astronauts and cosmonauts and correlated activities of E S A Medical Operations [J ]. ActaAstronaut., 2010, 66:963-973[3] C U C I N O T T A F A, M A N U E L F K, J O N E S J , et al. Spaceradiation and cataracts in astronauts [J]. Radiat. Res., 2001, 156:460-466[4] C H A N G P Y, C U C I N O T T A F A, B J O R N S T A D K A,et al. Harderian gland tumorigenesis: low-dose and L E Tresponse [J ]. Radiat. Res., 2016, 185:449-460[5] C U C I N O T T A F A. Review of N A S A approach to spaceradiation risk assessments for Marsexploration [J]. HealthPhys., 2015, 108:131-142[6] S I M P S O N J A. Elemental and isotopic composition of thegalactic cosmic rays [J ]. Ann. Rev.Nucl. Part. Sci., 1983, 33:323-382[7] R E A M E S D V. Particle acceleration at the sun and in theheliosphere [J ]. Space Sci. Rev., 1999, 90:413-491[8] B O Y N T O N , D R O E G E G F, M I T R O F A N O V I G. Highspatial resolution studies of epithermal neutron emission from the lunar poles: constraints on hydrogen mobility [J ].J. Geophys. Res. Planet., 2015, 117(12): 1991-2012[9] JIA Yingzhuo, Z O U Yongliao, X U E Changbin, et al. Scientific objectives and payloads of Chang,E-4 missionor-444malsize[J]. Chin. J. Space Sci., 2018, 38(1): 118-130 瑛卓,邹永廖,薛长斌,等.嫦娥四号任务科学目标和有效载荷 配置[J].空间科学学报,2018, 38(1): 118-130)[10] E N G L I S H R A, B E N S O T Z R E, V E R N O N B U I L E Y J ,et al. Apollo Experience Report-Protect i on against radiation, N A S A Technical Note N A S A T N D-7080 [OL]. [1973- 03-01]. https:///archive/nasa/casi.ntrs.nasa. gov/19730010172.pdf[11] ZEITLIN C, N A R I C I L, RIOS R R, et al. Comparisonsof high-linear energy transfer spectra on the ISS and in deep space [J ]. Space Weather^ 2019, 17:396-418[12] W I M M E R -S C H W E I N G R U B E R R F, Y U J , B O T T -C H E R S I , et al. The Lunar Lander Neutron and Dosimetry (LND) experiment on Chang,E-4 [J ]. Space Sci. Rev., 2020, 216:104[13] H O U D, Z H A N G S, Y U J , et al. Removing the dose background from radio active sources from active dose rate measurements in the Lunar Lander Neutron &: Dosimetry (LND) experiment on Chang,E-4 [J ]. J . Instrum., 2020, 15(1):P01023-P01032[14] Z H A N G S, W I M M E R -S C H W E I N G R U B E R R F, Y U J ,et al. First measurements of the radiation dose on thelunar surface [J ]. Sci. Adv., 2020, 6. DOI: 10.1126/sciadv. aazl334[15] X U Zigong, G U O Jingnan, R O B E R T F, et al First solar energetic particles measured on the lunar far-side [J].Astrophys. J. Lett., 2020, 902:30[16] B H A N D A R I N. Chandrayaan-1: science goals [J ]. J.Earth Syst. Sci., 2005, 114:701-709[17] C H I N G, B R Y L O W S, F O O T E M, et al. Lunar reconnaissance orbiter overview: the instrument suite and mission [J ]. Space Sci. Rev., 2007, 129:391-419[18] D A C H E V T P, T O M O V B T, Y U N, et al. A n overviewof R A D O M results for earth and moo n radiation environment on Chandrayaan-1 satellite [J ]. Adv. Space Res” 2011, 48(5): 779-791[19] S P E N C E H E. Crater science team: an overview ofresults from the Lunar Reconnaissance Orbiter (LRO) Cosmic Ray Telescope for the effects of Radiation (CRa T E R ) [C]//Annual Meeting of the Lunar Exploration Analysis Group. Washington: LPI, 2010Chin . J . Space Sci .空间科学学报 2〇21,41(3)。
磁单极存在的天文观测证据和它在天体物理学的重大作用―磁
Lm bLEdd
(b 10 102 )
(爆发瞬间)
超新星爆发以后
超新星爆发瞬间,天体核心物质密度接近或超过原子核密度,聚集 在核心中的磁单极催化核子衰变反应产生的RC光度及其辐射压非常 巨大, 使得包括星体核心在内的整个星体物质(处于高温等离子体状 态)向外抛射。核心区域的磁单极通过电磁相互作用也随着等离子体 物质向外抛射。星体核心区域物质密度急剧下降,核心区磁单数目 也下降,因此RC光度及其辐射压強将会大幅度降低。此后那些抛射 速度低于逃逸速度的物质(包括一些磁单极)开始向星体中心回落。 它使得星体中心的物质密度再次较快地增长。星体核心内的磁单极 仍然持续不断地催化核子衰变产生RC光度和相应的辐射压, 抗拒着 (c) 2 回落物质的坍缩。由于RC光度 Lm s (nB ) , 中心物质密度不仅 不可能趋向于无穷大,而且将会远远低于核密度(否则将出现再次爆 发。残留的星体最后终于会达到某种稳定的平衡状态:它内部核心磁 单极催化核子衰变产生RC光度必定远远低于这个残留星体的 Eddington光度。
II.磁单极存在的天文观测证椐
问题(1983年) :如果粒子物理学中有关磁单极的观念及其RC效应 是正确的,它会对天体物理学带来什么重要的作用?它们会产生 哪些重要的观测效应? 利用磁单极催化核子衰变反应作为能源, 1985年我们提出了<含磁 单极的超巨质量恒星-类星体与活动星系核模型> ( 替代黑洞模型 )。 星系核心的超巨质量天体在其周围附近区域的引力效应类似于黑洞 . 含有足够数量磁单极的超巨质量天体既无黑洞视界面、也无中 心奇异性, 这是由于磁单极催化核子衰变反应的速率正比于物质 密度的平方.衰变出来的轻子与光子向外发射, 因此中心密度不 可能趋向无穷大.结合粒子物理学中的RC效应,避免了经典广义相 对论的黑洞理论呈现的中心奇异性问题. 2001年,我们的有关论文( Peng & Chou, 2001, ApJL)明确地提出了 五个主要理论预言。其中三个定量预言被后来的天文观测证实。
天文学会专业词汇【4】

Sagittarius dwarf ⼈马矮星系 Sagittarius dwarf galaxy ⼈马矮星系 Sagittarius galaxy ⼈马星系 Saha equation 沙哈⽅程 Sakigake 〈先驱〉空间探测器 Saturn-crossing asteroid 越⼟⼩⾏星 Saturnian ringlet ⼟星细环 Saturnshine ⼟星反照 scroll 卷滚 Sculptor group ⽟夫星系群 Sculptor Supercluster ⽟夫超星系团 Sculptor void ⽟夫巨洞 secondary crater 次级陨击坑 secondary resonance 次共振 secular evolution 长期演化 secular resonance 长期共振 seeing management 视宁度控管 segregation 层化 selenogony ⽉球起源学 separatrice 分界 sequential estimation 序贯估计 sequential processing 序贯处理 serendipitous X-ray source 偶遇 X 射线源 serendipitous γ-ray source 偶遇γ射线源 Serrurier truss 赛路⾥桁架 shell galaxy 壳星系 shepherd satellite 牧⽺⽝卫星 shock temperature 激波温度 silicon target vidicon 硅靶光导摄象管 single-arc method 单弧法 SIRTF, Space Infrared Telescope 空间红外望远镜 Facility slitless spectroscopy ⽆缝分光 slit spectroscopy 有缝分光 slow pulsar 慢转脉冲星 SMM, Solar Maximum MIssion 太阳极⼤使者 SMT, Submillimeter Telescope 亚毫⽶波望远镜 SOFIA, Stratospheric Observatory for 〈索菲雅〉机载红外望远镜 Infrared Astronomy soft γ-ray burst repeater 软γ暴复现源 soft γ repeater ( SGR )软γ射线复现源 SOHO, Solar and Heliospheric 〈索贺〉太阳和太阳风层探测器 Observatory solar circle 太阳圈 solar oscillation 太阳振荡 solar pulsation 太阳脉动 solar-radiation pressure 太阳辐射压 solar-terrestrial environment ⽇地环境 solitary 孤⼦性 soliton star 孤⼦星 South Galactic Cap 南银冠 South Galactic Pole 南银极 space density profile 空间密度轮廓 space geodesy 空间⼤地测量 space geodynamics 空间地球动⼒学 Spacelab 空间实验室 spatial mass segregation 空间质量分层 speckle masking 斑点掩模 speckle photometry 斑点测光 speckle spectroscopy 斑点分光 spectral comparator ⽐长仪 spectrophotometric distance 分光光度距离 spectrophotometric standard 分光光度标准星 spectroscopic period 分光周期 specular density 定向密度 spherical dwarf 椭球矮星系 spin evolution ⾃旋演化 spin period ⾃旋周期 spin phase ⾃旋相位 spiral 旋涡星系 spiral arm tracer ⽰臂天体 Spoerer minimum 斯珀勒极⼩ spotted star 富⿊⼦恒星 SST, Spectroscopic Survey Telescope 分光巡天望远镜 standard radial-velocity star 视向速度标准星 standard rotational-velocity star ⾃转速度标准星 standard velocity star 视向速度标准星 starburst 星暴 starburst galaxy 星暴星系 starburst nucleus 星暴 star complex 恒星复合体 star-formation activity 产星活动 star-formation burst 产星暴 star-formation efficiency ( SFE )产星效率 star-formation rate 产星率 star-formation region 产星区 star-forming region 产星区 starpatch 星斑 static property 静态特性 statistical orbit-determination 统计定轨理论 theory steep-spectrum radio quasar 陡谱射电类星体 stellar environment 恒星环境 stellar halo 恒星晕 stellar jet 恒星喷流 stellar speedometer 恒星视向速度仪 stellar seismology 星震学 Stokes polarimetry 斯托克斯偏振测量 strange attractor 奇异吸引体 strange star 奇异星 sub-arcsec radio astronomy 亚⾓秒射电天⽂学 Subaru Telescope 昴星望远镜 subcluster 次团 subclustering 次成团 subdwarf B star B 型亚矮星 subdwarf O star O 型亚矮星 subgiant branch 亚巨星⽀ submilliarcsecond optical astrometry 亚毫⾓秒光波天体测量 submillimeter astronomy 亚毫⽶波天⽂ submillimeter observatory 亚毫⽶波天⽂台 submillimeter photometry 亚毫⽶波测光 submillimeter space astronomy 亚毫⽶波空间天⽂ submillimeter telescope 亚毫⽶波望远镜 submillisecond optical pulsar 亚毫秒光学脉冲星 submillisecond pulsar 亚毫秒脉冲星 submillisecond radio pulsar 亚毫秒射电脉冲星 substellar object 亚恒星天体 subsynchronism 亚同步 subsynchronous rotation 亚同步⾃转 Sunflower galaxy ( M 63 )葵花星系 sungrazer comet 掠⽇彗星 supercluster 超星团; 超星系团 supergalactic streamer 超星系流状结构 supergiant molecular cloud ( SGMC )超巨分⼦云 superhump 长驼峰 superhumper 长驼峰星 supermaximum 长极⼤ supernova rate 超新星频数、超新星出现率 supernova shock 超新星激波 superoutburst 长爆发 superwind galaxy 超级风星系 supporting system ⽀承系统 surface activity 表⾯活动 surface-brightness profile ⾯亮度轮廓 surface-channel CCD 表⾯型 CCD SU Ursae Majoris star ⼤熊 SU 型星 SWAS, Submillimeter Wave Astronomy 亚毫⽶波天⽂卫星 Satallite symbiotic binary 共⽣双星 symbiotic Mira 共⽣刍藁 symbiotic nova 共⽣新星 synthetic-aperture radar 综合孔径雷达 systemic velocity 质⼼速度TAMS, terminal-age main sequence 终龄主序 Taurus molecular cloud ( TMC )⾦⽜分⼦云 TDT, terrestrial dynamical time 地球⼒学时 television guider 电视导星器 television-type detector 电视型探测器 Tenma 〈天马〉X 射线天⽂卫星 terrestrial reference system 地球参考系 tetrad 四元基 thermal background 热背景辐射 thermal background radiation 热背景辐射 thermal pulse 热脉冲 thermonuclear runaway 热核暴涨 thick-disk population 厚盘族 thinned CCD 薄型 CCD third light 第三光源 time-signal station 时号台 timing age 计时年龄 tomograph 三维结构图 toner 调⾊剂 torquetum ⾚基黄道仪 TRACE, Transition Region and Coronal 〈TRACE〉太阳过渡区和⽇冕 Explorer 探测器 tracker 跟踪器 transfer efficiency 转移效率 transition region line 过渡区谱线 trans-Nepturnian object 海外天体 Trapezium cluster 猎户四边形星团 triad 三元基 tri-dimensional spectroscopy 三维分光 triquetum 三⾓仪 tuning-fork diagram ⾳叉图 turnoff age 拐点年龄 turnoff mass 拐点质量 two-dimensional photometry ⼆维测光 two-dimensional spectroscopy ⼆维分光 UKIRT, UK Infrared Telescope Facility 联合王国红外望远镜 UKST, UK Schmidt Telescope 联合王国施密特望远镜 ultracompact H Ⅱ region 超致密电离氢区 ultradeep-field observation 特深天区观测 ultraluminous galaxy 超⾼光度星系 ultrametal-poor star 特贫⾦属星 Ulysses 〈尤利西斯〉太阳探测器 unseen component 未见⼦星 upper tangent arc 上正切晕弧 unnumbered asteroid 未编号⼩⾏星 Uranian ring 天王星环 Ursa Major group ⼤熊星群 Ursa Minorids ⼩熊流星群 Vainu Bappu Observatory 巴普天⽂台 variable-velocity star 视向速度变星 vectorial astrometry ⽮量天体测量 vector-point diagram ⽮点图 Vega 〈维佳〉⾏星际探测器 Vega phenomenon 织⼥星现象 velocity variable 视向速度变星 Venera 〈⾦星〉号⾏星际探测器 very strong-lined giant, VSL giant 甚强线巨星 very strong-lined star, VSL star 甚强线星 video astronomy 录象天⽂ viewfinder 寻星镜 Viking 〈海盗〉号⽕星探测器 virial coefficient 位⼒系数 virial equilibrium 位⼒平衡 virial radius 位⼒半径 virial temperature 位⼒温度 virtual phase CCD 虚相 CCD visible arm 可见臂 visible component 可见⼦星 visual star 光学星 VLT, Very Large Telescope 甚⼤望远镜 void 巨洞 Vondrak method 冯德拉克⽅法 Voyager 〈旅⾏者〉号⾏星际探测器 VSOP, VLBI Space Observatory 空间甚长基线⼲涉测量 Programme 天⽂台计划 wave-front sensor 波前传感器 weak-line T Tauri star 弱线⾦⽜ T 型星 Wesselink mass 韦塞林克质量 WET, Whole Earth Telescope 全球望远镜 WHT, William Herschel Telescope 〈赫歇尔〉望远镜 wide-angle eyepiece ⼴⾓⽬镜 wide binary galaxy 远距双重星系 wide visual binary 远距⽬视双星 Wild Duck cluster ( M 11 )野鸭星团 Wind 〈风〉太阳风和地球外空磁层 探测器 WIRE, Wide-field Infrared Explorer 〈WIRE〉⼴⾓红外探测器 WIYN Telescope, Wisconsin-Indiana- 〈WIYN〉望远镜 Yale-NOAO Telescope WR nebula, Wolf-Rayet nebula WR 星云 Wyoming Infrared Telescope 怀俄明红外望远镜 xenobiology 外空⽣物学 XMM, X-ray Mirror Mission X 射线成象望远镜 X-ray corona X 射线冕 X-ray eclipse X 射线⾷ X-ray halo X 射线晕 XTE, X-ray Timing Explorer X 射线计时探测器 yellow straggler 黄离散星 Yohkoh 〈阳光〉太阳探测器 young stellar object ( YSO )年轻恒星体 ZAHB, zero-age horizontal branch 零龄⽔平⽀ Zanstra temperature 赞斯特拉温度 ZZ Ceti star 鲸鱼 ZZ 型星 γ-ray burster ( GRB )γ射线暴源 γ-ray line γ谱线 γ-ray line astronomy γ谱线天⽂ γ-ray line emission γ谱线发射 ζ Aurigae binary 御夫ζ型双星 ζ Aurigae variable 御夫ζ型变星absolute energy distribution 绝对能量分布 abundance effect 丰度效应 angular diameter—redshift relation ⾓径—红移关系 asteroid astrometry ⼩⾏星天体测量 bursting pulsar ( GRO J1744-28 )暴态脉冲星 Caliban 天卫⼗七 canonical Big Bang 典型⼤爆炸 Cepheid binary 造⽗双星 CH anomaly CH 反常 chromospheric plage ⾊球谱斑 circumnuclear star-forming ring 核周产星环 circumstellar astrophysics 星周天体物理 CN anomaly CN 反常 colliding-wind binary 星风互撞双星 collisional de-excitation 碰撞去激发 collisional ionization 碰撞电离 collision line broadening 碰撞谱线致宽 Compton loss 康普顿耗损 continuous opacity 连续不透明度 coronagraphic camera ⽇冕照相机 coronal active region ⽇冕活动区 cosmic-ray exposure age 宇宙线曝射法年龄 count—magnitude relation 计数—星等关系 Cousins color system 卡曾斯颜⾊系统 dating method 纪年法 DDO color system DDO 颜⾊系统 deep sky object 深空天体 deep sky phenomena 深空天象 dense star cluster 稠密星团 diagnostics 诊断法 dissociative recombination 离解复合 Doppler line broadening 多普勒谱线致宽 epicyclic orbit 本轮轨道 extragalactic background 河外背景 extragalactic background radiation 河外背景辐射 flare particle emission 耀斑粒⼦发射 flare physics 耀斑物理 Fm star Fm 星 focal plane spectrometer 焦⾯分光计 focusing X-ray telescope 聚焦 X 射线望远镜 Friedmann time 弗⾥德曼时间 galactic chimney 星系通道 Galactic chimney 银河系通道 gas relention age ⽓体变异法年龄 Gauss line profile ⾼斯谱线轮廓 GCR ( Galactic cosmic rays )银河系宇宙线 Geneva color system ⽇内⽡颜⾊系统 global oscilletion 全球振荡 GW-Vir instability strip 室⼥ GW 不稳定带 Highly Advanced Laboratory for 〈HALCA〉通讯和天⽂⾼新空间 Communications and Astronomy 实验室 ( HALCA ) Hipparcos catalogue 依巴⾕星表 Hobby-Eberly Telescope ( HET )〈HET〉⼤型拼镶镜⾯望远镜 Hoyle—Narlikar cosmology 霍伊尔—纳⾥卡宇宙学 Hubble Deep Field ( HDF )哈勃深空区 human space flight 载⼈空间飞⾏、⼈上天 imaging spectrograph 成象摄谱仪 infrared camera 红外照相机 infrared luminosity 红外光度 infrared polarimetry 红外偏振测量 in-situ acceleration 原位加速 intercept age 截距法年龄 inverse Compton limit 逆康普顿极限 isochron age 等龄线法年龄 Johnson color system 约翰逊颜⾊系统 K giant variable ( KGV ) K 型巨变星 kinetic equilibrium 运动学平衡 large-scale beam ⼤尺度射束 large-scale jet ⼤尺度喷流 limb polarization 临边偏振 line-profile variable 谱线轮廓变星 long term fluctuation 长期起伏 Lorentz line profile 洛伦兹谱线轮廓 magnetic arm 磁臂 Mars globe ⽕星仪 massive black hole ⼤质量⿊洞 mean extinction coefficient 平均消光系数 mean luminosity density 平均光度密度 microwave storm 微波噪暴 Milli-Meter Array ( MMA )〈MMA〉毫⽶波射电望远镜阵 molecular maser 分⼦微波激射、分⼦脉泽 moving atmosphere 动态⼤⽓ neutrino loss rate 中微⼦耗损率 non-linear astronomy ⾮线性天⽂ non-standard model ⾮标准模型 passband width 带宽 P Cygni type star 天鹅 P 型星 Perseus chimney 英仙通道 planetary companion 似⾏星伴天体 plateau phase 平台阶段 primordial abundance 原始丰度 protobinary system 原双星 proto-brown dwarf 原褐矮星 quiescent galaxy 宁静星系 radiation transport 辐射转移 radio-intermediate quasar 中介射电类星体 random peculiar motion 随机本动 relative energy distribution 相对能量分布 RGU color system RGU 颜⾊系统 ringed barred galaxy 有环棒旋星系 ringed barred spiral galaxy 有环棒旋星系 rise phase 上升阶段 Rossi X-ray Timing Explorer ( RXTE )〈RXTE〉X 射线时变探测器 RQPNMLK color system RQPNMLK 颜⾊系统 Scheuer—Readhead hypothesis 朔伊尔—⾥德⿊德假说 Serpens molecular cloud 巨蛇分⼦云 soft X-ray transient ( SXT )软 X 射线暂现源 solar dynamo 太阳发电机 solar global parameter 太阳整体参数 solar neighbourhood 太阳附近空间 spectral catalogue 光谱表 spectral duplicity 光谱成双性 star-formation process 产星过程 star-forming phase 产星阶段 Stroemgren color system 颜⾊系统 Sub-Millimeter Array ( SMA )〈SMA〉亚毫⽶波射电望远镜阵 superassociation 超级星协 supermassive black hole 特⼤质量⿊洞 supersoft X-ray source 超软 X 射线源 super-star cluster 超级星团 Sycorax 天卫⼗七 symbiotic recurrent nova 共⽣再发新星 synchrotron loss 同步加速耗损 time dilation 时间扩展 tired-light model 光线⽼化宇宙模型 tremendous outburst amplitude 巨爆幅 tremendous outburst amplitude dwarf 巨爆幅矮新星 nova ( TOAD ) Tycho catalogue 第⾕星表 UBV color system UBV 颜⾊系统 UBVRI color system UBVRI 颜⾊系统 ultraviolet luminosity 紫外光度 unrestricted orbit ⽆限制性轨道 uvby color system uvby 颜⾊系统 VBLUW color system VBLUW 颜⾊系统 Venus globe ⾦星仪 Vilnius color system 维尔纽斯颜⾊系统 Virgo galaxy cluster 室⼥星系团 VLBA ( Very Long Baseline Array )〈VLBA〉甚长基线射电望远镜阵 Voigt line profile 佛克特谱线轮廓 VRI color system VRI 颜⾊系统 Walraven color system 沃尔拉⽂颜⾊系统 waning crescent 残⽉ waning gibbous 亏凸⽉ waxing crescent 娥眉⽉ waxing gibbous 盈凸⽉ WBVR color system WBVR 颜⾊系统 Wood color system 伍德颜⾊系统 zodiacal light photometry 黄道光测光 11-year solar cycle 11 年太阳周 α Cygni variable 天津四型变星 δ Doradus variable 剑鱼δ型变星。
广西大学天体物理学科介绍
Corrections:
k-correction, Galactic extinction (No correction for host galaxy extinction )
7
光度分布
Global lightcurves
( L)
0
ቤተ መጻሕፍቲ ባይዱ
[(
L Lb
)1
( L Lb
)2 ]1
(2)GRB rate: dN RGRB (z) dV (z)
dzdt 1 z dz
RGRB (z) RSFR (z)( , z)
(3)Extinction:
RSFR
(
z)
(1 (1
z
z)3.44 , z ) , 3.44
peak
z
z
peak
Function 3. MC simulation 4. Robotic 60-cm Telescopes of GXU-NAOC Center 5. Summary and Discussion
2
1.伽玛暴
伽玛射线暴(Gamma-Ray Burst,GRB) 是宇宙学距离上的宇宙大爆炸以来的最 强的能量爆发事件,它的主要特点是伽 玛射线波段流量突然增强,以及具有的 瞬时性,能量高,时标短,光变曲线复 杂多变等特点。
6
Data selection
Sample:
Full sample of GRBs with optical afterglow detection from 1997-2012, 230 GRBs included
146 well-sampled LCs for our analysis. Most of them were observed in the R-band.
UBVI CCD photometry of two old open clusters NGC 1798 and NGC 2192
a r X i v :a s t r o -p h /9901140v 1 12 J a n 1999Mon.Not.R.Astron.Soc.000,1–8(1998)Printed 1February 2008(MN L A T E X style file v1.4)UBV I CCD photometry of two old open clusters NGC 1798and NGC 2192Hong Soo Park and Myung Gyoon Lee ⋆Department of Astronomy,Seoul National University,Seoul 151-742,KoreaAccepted 1998??.Received 1998??;in original form 1998July ??ABSTRACT We present UBV I CCD photometry of two open clusters NGC 1798and NGC 2192which were little studied before.Color-magnitude diagrams of these clusters show several features typical for old open clusters:a well-defined main-sequence,a red giant clump,and a small number of red giants.The main sequence of NGC 1798shows a distinct gap at V ≈16.2mag.From the surface number density distribution we have measured the size of the clusters,obtaining 8′.3(=10.2pc)for NGC 1798and 7′.3(=7.5pc)for NGC 2192.Then we have determined the reddening,metallicity,and distance of these clusters using the color-color diagrams and color-magnitude diagrams:E (B −V )=0.51±0.04,[Fe/H]=−0.47±0.15dex and (m −M )0=13.1±0.2(d =4.2±0.3kpc)for NGC 1798,and E (B −V )=0.20±0.03,[Fe/H]=−0.31±0.15dex and (m −M )0=12.7±0.2(d =3.5±0.3kpc)for NGC 2192.The ages of these clusters have been estimated using the morphological age indicators and the isochrone fitting with the Padova isochrones:1.4±0.2Gyrs for NGC 1798and 1.1±0.1Gyrs for NGC 2192.The luminosity functions of the main sequence stars in these clusters are found to be similar to other old open clusters.The metallicity and distance of these clusters are consistent with the relation between the metallicity and galactocentric distance of other old open clusters.Key words:Hertzsprung–Russell (HR)diagram –open clusters and associations:general –open clusters and associations:individual:NGC 1798,NGC 2192–stars:luminosity function.1INTRODUCTIONOld open clusters provide us with an important informationfor understanding the early evolution of the Galactic disk.There are about 70known old open clusters with age >1Gyrs (Friel 1995).These clusters are faint in general so thatthere were few studies about these clusters until recently.With the advent of CCD camera in astronomy,the numberof studies on these clusters has been increasing.However,there are still a significant number of old open clusters forwhich basic parameters are not well known.For example,metallicity is not yet known for about 30clusters amongthem.Recently Phelps et al.(1994)and Janes &Phelps (1994)presented an extensive CCD photometric survey of potentialold open clusters,the results of which were used in the studyon the development of the Galactic disk by Janes &Phelps(1994).In the sample of the clusters studied by Phelps et al.⋆corresponding author,E-mail:mglee@astrog.snu.ac.krthere are several clusters for which only the non-calibrated photometry is available.We have chosen two clusters among them,NGC 1798and NGC 2192,to study the characteristics of these clus-ters using UBV I CCD photometry.These clusters are lo-cated in the direction of anti-galactic centre.To date there is published only one photometric study of these clusters,which was given by Phelps et al.(1994)who presented non-calibrated BV CCD photometry of these clusters.From the instrumental color-magnitude diagrams of these clus-ters Phelps et al.estimated the ages of these clusters using the morphological age indicators,obtaining the values of 1.5Gyrs for NGC 1798and 1.1Gyrs for NGC 2192.However,no other properties of these clusters are yet known.In this paper we present a study of NGC 1798and NGC 2192based on UBV I CCD photometry.We have es-timated the basic parameters of these clusters:size,red-dening,metallicity,distance,and age.Also we have derived the luminosity function of the main sequence stars in these clusters.Section 2describes the observations and data re-duction.Sections 3and 4present the analysis for NGC 1798c 1998RAS2Hong Soo Park and Myung Gyoon Leeand NGC2192,respectively.Section5discusses the results. Finally Section6summarizes the primary results.2OBSER V ATIONS AND DATA REDUCTION 2.1ObservationsUBV I CCD images of NGC1798and NGC2192were obtained using the Photometrics512CCD camera at the Sobaeksan Observatory61cm telescope in Korea for several observing runs between1996November and1997October. We have used also BV CCD images of the central region of NGC1798obtained by Chul Hee Kim using the Tek1024 CCD camera at the Vainu Bappu Observatory2.3m tele-scope in India on March4,1998.The observing log is given in Table1.The original CCD images wereflattened after bias sub-traction and several exposures for eachfilter were combined into a single image for further reduction.The sizes of the field in a CCD image are4′.3×4′.3for the PM512CCD im-age,and10′.6×10′.6for the Tek1024CCD image.The gain and readout noise are,respectively,9electrons/ADU and 10.4electrons for the PM512CCD,and9electrons/ADU and10.4electrons for the Tek1024CCD.Figs.1and2illustrate grey scale maps of the V CCD images of NGC1798and NGC2192made by mosaicing the images of the observed regions.It is seen from thesefigures that NGC1798is a relatively rich open cluster,while NGC 2192is a relatively poor open cluster.2.2Data ReductionInstrumental magnitudes of the stars in the CCD images were obtained using the digital stellar photometry reduction program IRAF⋆/DAOPHOT(Stetson1987,Davis1994). The resulting instrumental magnitudes were transformed onto the standard system using the standard stars from Lan-dolt(1992)and the M67stars in Montgomery et al.(1993) observed on the same photometric nights.The transforma-tion equations areV=v+a V(b−v)+k V X+Z V,(B−V)=a BV(b−v)+k BV X+Z BV,(U−B)=a UB(u−b)+k UB X+Z UB,and(V−I)=a V I(v−i)+k V I X+Z V I,where the lower case symbols represent instrumental mag-nitudes derived from the CCD images and the upper case symbols represent the standard system values.X is the air-mass at the midpoint of the observations.The results of the transformation are summarized in Table2.The data ob-tained on non-photometric nights were calibrated using the photometric data for the overlapped region.The total number of the measured stars is1,416for NGC1798and409for NGC2192.Tables3and4list the⋆IRAF is distributed by the National Optical Astronomy Ob-servatories,which are operated by the Association of Universities for Research in Astronomy,Inc.under contract with the National Science Foundation.photometry of the bright stars in the C-regions of NGC1798 and NGC2192,respectively.The X and Y coordinates listed in Table3and4are given in units of CCD pixel(=0′′.50). The X and Y values are increasing toward north and west, respectively.We have divided the entire region of thefields into sev-eral regions,as shown in Figs.1and2,for the analysis of the data.The C-region represents the central region of the cluster,and the F-regions(F,Fb,Fir,and Fi regions)rep-resent the controlfield regions,and the N-region represents the intermediate region between the central region and the field region.The radius of the C-region is300pixel for NGC 1798and NGC2192.The ratio of the areas of the C-region, N-region,Fb-region,and(Fi+Fir)-regions for NGC1798is 1:1.50:1.00:1.07,and the ratio of the areas of the C-region, N-region,and F-region for NGC2192is1:1.26:0.98.3ANALYSIS FOR NGC17983.1The Size of the ClusterWe have investigated the structure of NGC1798using star-counts.The centre of the cluster is estimated to be at the po-sition of(X=710pixel,Y=1110pixel),using the centroid method.Fig.3illustrates the projected surface number den-sity profile derived from counting stars with V<19.5mag in the entire CCDfield.The magnitude cutofffor starcounts was set so that the counts should be free of any photometric incompleteness problem.Fig.3shows that most of the stars in NGC1798are concentrated within the radius of250pixel (=125′′),and that the outskirts of the cluster extend out to about500pixel(=250′′)from the center.The number density changes little with radius beyond500pixel,show-ing that the outer region of the observedfield can be used as a controlfield.Therefore we have estimated the approxi-mate size of NGC1798for which the cluster blends in with thefield to be about500′′in diameter,which corresponds to a linear size of10.2pc for the distance of NGC1798as determined below.3.2Color-Magnitude DiagramsFigs.4and5show the V−(B−V)and V−(V−I)color-magnitude diagrams(CMDs)of the measured stars in the observed regions in NGC1798.Thesefigures show that the C-region consists mostly of the members of NGC1798with some contamination of thefield stars,while the F-regions consist mostly of thefield stars.The N-region is intermediate between the C-region and the F-region.The distinguishable features seen in the color-magnitude diagrams of the C-region are:(a)There is a well-defined main sequence the top of which is located at V≈16 mag;(b)There is seen a distinct gap at V≈16.2mag in the main sequence,which is often seen in other old open clusters (e.g.M67);(c)There is a poorly defined red giant branch and these is seen some excess of stars around(B−V)=1.3 and V=15.6mag on this giant branch,which is remarked by the small box in thefigures.This may be a random excess of stars.However,the positions of the stars in the CMDs are consistent with the positions of known red giant clump in other old open clusters.Therefore most of these stars arec 1998RAS,MNRAS000,1–8UBV I CCD photometry of two old open clusters NGC1798and NGC21923probably red giant clump stars;and(d)There are a small number of stars along the locus of the red giant branch. 3.3Reddening and MetallicityNGC1798is located close to the galactic plane in the anti-galactic centre direction(b=4◦.85and l=160◦.76)so that it is expected that the reddening toward this cluster is significant.We have estimated the reddening for NGC1798 using two methods as follows.First we have used the mean color of the red giant clump.Janes&Phelps(1994)estimated the mean color and magnitude of the red giant clump in old open clusters to be (B−V)RGC=0.87±0.02and M V,RGC=0.59±0.09,when the difference between the red giant clump and the main sequence turn-offof the clusters,δV,is smaller than one. The mean color of the red giant clump in the C-region is estimated to be(B−V)RGC=1.34±0.01((V−I)RGC= 1.47±0.01,and(U−B)RGC=1.62±0.04),and the cor-responding mean magnitude is V RGC=15.57±0.05.δV is estimated to be0.8±0.2,which is the same value derived by Phelps et al.(1994).From these data we have derived a value of the reddening,E(B−V)=0.47±0.02.Secondly we have used the color-color diagram to es-timate the reddening and the metallicity simultaneously. We havefitted the mean colors of the stars in the C-region with the color-color relation used in the Padova isochrones (Bertelli et al.1994).This process requires iteration,because we need to know the age of the cluster as well as the red-dening and metallicity.We have iterated this process until all three parameters are stabilized.Fig.6illustrates the results offitting in the(U−B)−(B−V)color-color diagram.It is shown in thisfigure that the stars in NGC1798are reasonablyfitted by the color-color relation of the isochrones for[Fe/H]=−0.47±0.15 with a reddening value of E(B−V)=0.55±0.05. The error for the metallicity,0.15,was estimated by com-paring isochrones with different metallicities.As a reference the mean locus of the giants for solar abundance given by Schmidt-Kaler(1982)is also plotted in Fig.6.Finally we derive a mean value of the two estimates for the reddening, E(B−V)=0.51±0.04.3.4DistanceWe have estimated the distance to NGC1798using two methods as follows.First we have used the mean magnitude of the red giant clump.We have derived a value of the ap-parent distance modulus(m−M)V=14.98±0.10from the values for the mean magnitudes of the red giant clump stars described above.Secondly we have used the the zero-age main sequence (ZAMS)fitting,following the method described in Vanden-Berg&Poll(1989).VandenBerg&Poll(1989)presented the semi-empirical ZAMS as a function of the metallicity[Fe/H] and the helium abundance Y:V=M V(B−V)+δM V(Y)+δM V([Fe/H])whereδM V(Y)=2.6(Y−0.27)andδM V([Fe/H])=−[Fe/H](1.444+0.362[Fe/H]).Before the ZAMSfitting,we subtracted statistically the contribution due to thefield stars in the CMDs of the C-region using the CMDs of the Fb-region for BV photometry and the CMDs of the Fi+Fir region for V I photometry. The size of the bin used for the subtraction is∆V=0.25 and∆(B−V)=0.1.The resulting CMDs are displayed in Fig.7.We used the metallicity of[Fe/H]=–0.47as derived above and adopted Y=0.28which is the mean value for old open clusters(Gratton1982).Using this method we have obtained a value of the apparent distance modulus(m−M)V=14.5±0.2.Finally we calculate a mean value of the two estimates,(m−M)V=14.7±0.2.Adopting the extinction law of A V=3.2E(B−V),we derive a value of the intrinsic distance modulus(m−M)0=13.1±0.2.This corresponds to a distance of d=4.2±0.3kpc.3.5AgeWe have estimated the age of NGC1798using two methods as follows.First we have used the morphological age index (MAI)as described in Phelps et al.(1994).Phelps et al. (1994)and Janes&Phelps(1994)presented the MAI–δV relation,MAI[Gyrs]=0.73×10(0.256δV+0.0662δV2).From the value ofδV derived above,0.8±0.2mag,we obtain a value for the age,MAI=1.3±0.2Gyrs.Secondly we have estimated the age of the cluster us-ing the theoretical isochrones given by the Padova group (Bertelli et al.1994).Fitting the isochrones for[Fe/H]=–0.47to the CMDs of NGC1798,as shown in Fig.8,we estimate the age to be1.4±0.2Gyrs.Both results agree very well.3.6Luminosity FunctionWe have derived the V luminosity functions of the main sequence stars in NGC1798,which are displayed in Fig.9.The Fb-region was used for subtraction of thefield star contribution from the C-region and the magnitude bin size used is0.5mag.This controlfield may not be far enough from the cluster to derive thefield star contribution.If so,we might have oversubtracted thefield contribution,obtaining flatter luminosity functions than true luminosity functions. However,the fraction of the cluster members in thisfield must be,if any,very low,because the surface number density of this region is almost constant with the radius as shown in Fig.3.The luminosity function of the C-region in Fig. 9(a)increases rapidly up to V≈16.5mag,and stays almost flat for V>16.5mag.The luminosity functions of the N-region and the(R+Fir)-region are steeper than that of the C-region.A remarkable drop is seen at V=16.2mag(M V= 1.5mag)in the luminosity function of the C-region based on smaller bin size of0.2mag in Fig.9(b).This corresponds to the main sequence gap described above.4ANALYSIS FOR NGC21924.1The Size of the ClusterWe have investigated the structure of NGC2192using star-counts.We could not use the centroid method to estimatec 1998RAS,MNRAS000,1–84Hong Soo Park and Myung Gyoon Leethe centre of this cluster,because this cluster is too sparse. So we have used eye-estimate to determine the centre of the cluster to be at the position of(X=465pixel,Y=930 pixel).Fig.10illustrates the projected surface number den-sity profile derived from counting stars with V<18mag in the entire CCDfield.The magnitude cutofffor starcounts was set so that the counts should be free of any photomet-ric incompleteness problem.Fig.10shows that most of the stars in NGC2192are concentrated within the radius of200 pixel(=100′′),and that the outskirts of the cluster extend out to about440pixel(=220′′)from the centre.Therefore the approximate size of NGC2192is estimated to be about 440′′in diameter,which corresponds to a linear size of7.5pc for the distance of NGC2192as determined below.4.2Color-Magnitude DiagramsFigs.11and12show the V−(B−V)and V−(V−I)color-magnitude diagrams of the measured stars in the observed regions in NGC2192.The distinguishable features seen in the color-magnitude diagrams of the C-region are:(a)There is a well-defined main sequence the top of which is located at V≈14mag;(b)There are a group of red giant clump stars at(B−V)=1.1and V=14.2mag,which are remarked by the small box in thefigures;and(c)There are a small number of stars along the locus of the red giant branch. 4.3Reddening and MetallicityNGC2192is located11degrees above the galactic plane in the anti-galactic centre direction(b=10◦.64and l= 173◦.41)but higher than NGC1798so that it is expected that the reddening toward this cluster is significant but smaller than that of NGC1798.We have estimated the red-dening for NGC2192using two methods as applied for NGC 1798.First we have used the mean color of the red giant clump.The mean color of the red giant clump in the C-region is estimated to be(B−V)RGC=1.08±0.01((V−I)RGC=1.07±0.01,and(U−B)RGC=0.61±0.02),and the corresponding mean magnitude is V RGC=14.20±0.05.δV is estimated to be0.6±0.2,which is similar to the value derived by Phelps et al.(1994).From these data we have derived a value of the reddening,E(B−V)=0.19±0.03.Secondly we have used the color-color diagram to es-timate the reddening and the metallicity simultaneously. We havefitted the mean colors of the stars in the C-region with the color-color relation used in the Padova isochrones (Bertelli et al.1994).Fig.13illustrates the results offit-ting in the(U−B)−(B−V)color-color diagram.It is shown in thisfigure that the stars in NGC2192are rea-sonablyfitted by the color-color relation of the isochrones for[Fe/H]=−0.31±0.15dex with a reddening value of E(B−V)=0.21±0.01.The error for the metallicity,0.15, was estimated by comparing isochrones with different metal-licities.As a reference the mean locus of the giant for solar abundance given by Schmidt-Kaler is also plotted in Fig.13. Finally we derive a mean value of the two estimates for the reddening,E(B−V)=0.20±0.03.4.4DistanceWe have estimated the distance to NGC2192using two methods as for NGC1798.First we have used the mean magnitude of the red giant clump.We have derived a value of the apparent distance modulus(m−M)V=13.61±0.10 from the values for the mean magnitudes of the red giant clump stars described previously.Secondly we have used the ZAMSfitting.Before the ZAMSfitting,we subtracted statistically the contribution due to thefield stars in the CMDs of the C-region using the CMDs of the F-region.The size of the bin used for the subtraction is∆V=0.25and∆(B−V)=0.1.The resulting CMDs are displayed in Fig.14.We used the metallicity of[Fe/H]=–0.31as derived before and adopted Y=ing this method we have obtaineda value of the apparent distance modulus(m−M)V=13.1±0.2.Finally we calculate a mean value of the two estimates,(m−M)V=13.3±0.2.Adopting the extinction law of A V=3.2E(B−V),we derive a value of the intrinsic distance modulus(m−M)0=12.7±0.2.This corresponds to a distance of d=3.5±0.3kpc.4.5AgeWe have estimated the age of NGC2192using two methods as follows.First we have used the morphological age index. From the value ofδV derived above,0.6±0.2mag,we obtain a value for the age,MAI=1.1±0.2Gyrs.Secondly we have estimated the age of the cluster using the theoretical isochrones given by the Padova group(Bertelli et al.1994). Fitting the isochrones for[Fe/H]=–0.31to the CMDs of NGC2192,as shown in Fig.15,we estimate the age to be 1.1±0.1Gyrs.Both results agree very well.4.6Luminosity FunctionWe have derived the V luminosity functions of the main sequence stars in NGC2192,which are displayed in Fig.16.The F-region was used for subtraction of thefield star contribution from the C-region.The luminosity function of the C-region in Fig.16(a)increases rapidly up to V≈14 mag,and stays almostflat for V>15mag.The luminosity function of the N-region is steeper than that of the C-region. Fig.16(b)displays a comparison of the luminosity functions of NGC1798,NGC2192,and NGC7789which is another old open cluster of similar age(Roger et al.1994).Fig.16(b) shows that the luminosity functions of these clusters are similar in that they are almostflat in the faint part.The flattening of the faint part of the luminosity functions of old open clusters has been known since long,and is believed to be due to evaporation of low mass stars(Friel1995).5DISCUSSIONWe have determined the metallicity and distance of NGC 1798and NGC2192in this study.We compare them with those of other old open clusters here.Fig.17illustrates the radial metallicity gradient of the old open clusters com-piled by Friel(1995)and supplemented by the data in Wee&Lee(1996)and Lee(1997).Fig.17shows that thec 1998RAS,MNRAS000,1–8UBV I CCD photometry of two old open clusters NGC1798and NGC21925 mean metallicity decreases as the galactocentric distance in-creases.The positions of NGC1798and NGC2192we haveobtained in this study are consistent with the mean trendof the other old open clusters.The slope we have deter-mined for the entire sample including these two clusters is∆[Fe/H]/R GC=−0.086±0.011dex/kpc,very similar tothat given in Friel(1995),∆[Fe/H]/R GC=−0.091±0.014dex/kpc.There are only four old open clusters located beyondR GC=13kpc in Fig.17.These four clusters follow the meantrend of decreasing outward.However,the number of theclusters is not large enough to decide whether the metallictykeeps decreasing outward or it stops decreasing somewherebeyond R GC=13kpc and stays constant.Further studiesof more old open clusters beyond R GC=13kpc are neededto investigate this point.6SUMMARY AND CONCLUSIONSWe have presented UBV I photometry of old open clustersNGC1798and NGC2192.From the photometric data wehave determined the size,reddening,metallicity,distance,and age of these clusters.The luminosity functions of themain sequence stars in these clusters are similar to those ofthe other old open clusters.The basic properties of theseclusters we have determined in this study are summarizedin Table5.ACKNOWLEDGMENTSProf.Chul Hee Kim is thanked for providing the BV CCDimages of NGC1798.This research is supported in part bythe Korea Science and Engineering Foundation Grant No.95-0702-01-01-3.REFERENCESBertelli,G.,Bressan,A.,Chiosi,C.,Fagotto,F.,&Nasi,E.1994,A&AS,106,275Davis,L.E.,1994,A Reference Guide to the IRAF/DAOPHOTPackageFriel,E.D.1995,ARA&A,33,381Gratton,R.G.,1982,ApJ,257,640Janes,K.,&Phelps,R.L.1994,AJ,108,1773Landolt,A.U.,1992,AJ,104,340Lee,M.G.,1997,113,729Montgomery,K.A.,Marschall,L.A.,&Janes,K.A.1993,AJ,106,181Phelps,R.L.,Janes,K.,&Montgomery,K.A.,1994,AJ,107,1079Roger,C.M.,Paez,E.,Castellani,V.,&Staniero,O.1994,A&A,290,62Schmidt-Kaler,T.1982,in Landolt-Bornstein VI,2b(Berlin:Springer)Stetson,P.B.,1987,PASP,99,191VandenBerg,D.A.,&Poll,H.E.,1989,AJ,98,1451Wee,S.O.,&Lee,M.G.,1996,Jour.Korean Astro.Soc.,29,181This paper has been produced using the Royal AstronomicalSociety/Blackwell Science L A T E X stylefile.c 1998RAS,MNRAS000,1–86Hong Soo Park and Myung Gyoon LeeTable2.Transformation coefficients for the standard stars.Date Color a k Z rms n(stars) 96.11.11V0.003–0.101–6.0400.00919(B−V) 1.090–0.155–0.4670.01317(U−B) 1.008–0.154–1.7110.03416 97.02.11V0.028–0.198–6.0500.00934(B−V) 1.150–0.118–0.5930.01035(U−B) 1.079–0.324–1.5750.03226(V−I)0.983–0.1300.3020.00829 97.02.13V–0.007–0.176–6.0050.01034(B−V) 1.160–0.133–0.5880.01334(U−B) 1.079–0.349–1.5260.02320(V−I)0.986–0.0970.2710.01532 97.03.17V-0.019–0.225–6.0680.01548(B−V) 1.221–0.093–0.7810.01844(U−B) 1.008–0.309–1.4580.02735(V−I)0.956–0.1570.3140.02052Table 3.UBV I photometry of the bright stars in the C-regionof NGC1798.ID X[px]Y[px]V(B−V)(U−B)(V−I) 1723.21110.815.8600.7790.3240.9143680.51092.015.380 1.3250.627 1.5254746.01160.315.9050.7410.2200.9545741.81165.514.380 1.4830.880 1.6336684.61030.115.8140.8640.342 1.0427745.31073.315.3760.9200.237 1.0849707.21038.814.777 1.4860.723 1.653 11549.41153.715.305 1.5290.915 1.666 12547.91162.714.846 1.6270.947 1.764 13602.31068.015.325 1.5240.847 1.660 14598.11080.815.776 1.3340.575 1.490 15525.81116.815.510 1.0020.346 1.169 18833.91144.214.976 1.4940.866 1.578 21981.91125.114.711 1.510 1.031 1.440 26835.71098.015.706 1.3180.468 1.407 27656.51022.115.653 1.4160.180 1.571 28659.8955.915.216 1.2160.384 1.385 29656.4976.813.6670.6610.3100.777 30674.2822.512.0330.4450.0500.532 33668.7966.315.687 1.3130.641 1.446 34764.3879.915.460 1.3370.508 1.408 38749.01008.115.359 1.3220.744 1.426 39774.4965.915.545 1.3040.590 1.402 43571.8930.612.875 1.970 1.264 2.252 45512.8908.715.810 1.3480.474 1.485 46642.1949.515.622 1.3290.590 1.477 48732.61211.315.821 1.3530.643 1.492 50678.81210.515.297 1.3680.770 1.501 51742.11244.414.7990.747-0.046 1.216 52673.11250.215.180 1.3060.780 1.457 56728.21183.415.665 1.4050.803 1.545 57614.91229.413.085 2.1770.635 3.581 62563.01338.415.9090.7060.6380.778 65913.91203.013.686 1.2490.851 1.354 67792.71314.215.6010.9750.470 1.275 68932.61268.414.4660.7170.1970.763 70801.11338.715.561 1.3270.785 1.442 72827.61315.513.5260.9670.521 1.161 78444.01094.814.605 1.5790.825 1.723 82684.3822.615.8280.9510.128 1.189 97598.51330.315.580 1.3360.710 1.483Table4.UBV I photometry of the bright stars in the C-region of NGC2192.ID X[px]Y[px]V(B−V)(U−B)(V−I) 4502.4879.614.9830.4320.1140.424 5537.5891.712.9690.9240.4750.930 7535.1931.315.1700.598-0.2010.483 9434.8947.613.6760.570-0.0560.648 10562.3991.914.037 1.0960.612 1.043 11412.9884.814.165 1.0780.608 1.072 12598.4778.715.1840.464-0.0300.477 13595.9930.014.4800.5020.1720.549 14625.8971.814.7430.7200.0890.741 16614.3684.214.3970.7660.1750.758 17463.3689.514.7660.4660.0120.480 18553.3710.715.4920.447-0.1350.428 19591.7723.814.4660.5450.0930.566 21623.0867.712.634 1.1020.713 1.108 22648.0929.015.3380.3940.1150.399 26461.1711.314.162 1.0860.670 1.091 29583.9802.315.0940.600-0.0160.644 32720.4889.515.3260.3700.0710.410 37395.9778.315.2640.3960.0310.379 38405.5778.514.8900.4810.1010.409 40258.21042.915.4310.4240.1200.484 42376.6883.915.1870.4550.1360.470 44180.1908.714.3200.2870.1120.295 47367.1938.314.8970.4030.2520.459 51183.3998.714.202 1.1140.552 1.108 55475.81052.514.6370.3880.1670.465 56389.11055.113.6060.6520.2560.777 58481.41074.114.3470.4500.1150.520 59514.91085.115.0970.4290.1370.517 60478.51089.614.2360.5280.1590.582 61498.51127.914.6090.5090.1350.578 63278.71154.414.372 1.0700.599 1.053 64527.41158.715.4180.4460.2450.510 65343.41167.814.266 1.0120.618 1.035 66362.21169.314.2660.8790.4690.879 74346.91039.814.5810.4520.1240.510 77688.91124.215.4200.3900.2900.400 83678.91079.715.4950.4640.1070.504 84624.21042.813.5010.3850.2170.389 88579.61028.914.8250.4560.1620.530 Table5.Basic properties of NGC1798and NGC2192.Parameter NGC1798NGC2192RA(2000)5h11m40s6h15m11sDEC(2000)47◦40′37′′39◦51′1′′l160◦.76173◦.41b4◦.8510◦.64Age1.4±0.2Gyrs1.1±0.1GyrsE(B−V)0.51±0.040.20±0.04[Fe/H]−0.47±0.15dex−0.31±0.15dex(m−M)013.1±0.212.7±0.2distance4.2±0.3kpc3.5±0.3kpcR GC12.5kpc11.9kpcz355pc646pcdiameter10.2pc(8′.3)7.5pc(7′.3)c 1998RAS,MNRAS000,1–8UBV I CCD photometry of two old open clusters NGC1798and NGC21927 Table1.Observing log for NGC1798and NGC2192.Date Target Filter Seeing Telescope Condition96.11.11NCC1798UBV2′′.3SAO a-61cm Photometric97.01.12NCC1798UBV I2′′.2SAO-61cm Non-photometric97.02.12NCC1798,NGC2192UBV I3′′.3SAO-61cm Photometric97.02.13NCC1798,NGC2192UBV I2′′.5SAO-61cm Non-photometric97.03.17NCC2192UBV I2′′.2SAO-61cm Photometric97.10.21NCC1798BV I2′′.3SAO-61cm Non-photometric97.10.24NCC2192BV I2′′.7SAO-61cm Non-photometric97.03.04NCC1798BV2′′.7VBO b-2.3m Non-photometrica Sobaeksan Astronomical Observatoryb Vainu Bappu Observatoryc 1998RAS,MNRAS000,1–8。
剂量计算
1、放射性及其常用度量单位1.1元素元素是指具有相同核电荷数的一类原子的总称。
按照元素的化学性质呈周期性的变化规律排列在元素周期表中占据同一个位置称为元素。
例如等它们同属于碘元素。
迄今为止,世界上已发现了118种不同的元素,其中92种是地球上存在的天然元素。
26种是人造元素。
1.2 同位素具有相同的原子序数Z和不同的质量数A,或者是原子核内具有相同数目的质子和不同数目的中子的一类原子(或元素),它们的化学性质相同,在元素同期表上占据同一个位置,故称为同位素,等均属钴的同位素。
目前已知的118种元素的同位素达2500余种。
一种元素可以有许多种同位素,例如元素周期中的元素的同位素就有30种。
一种元素的各个同位素的某些性能可能是不同的。
因引,又将核内具有特定数目中子和质子的一类原子。
称为某一核素。
例如都是氢的同位素,但它们都属不同的核素。
由核的稳定性能又可将同位素分为稳定同位素和不稳定同位素两类。
不稳定的同位素又称放射性同位素。
1.3放射性不稳定的同位素(或核素)能不属外界条件的影响自发地放出携带能量的射线,使其原子核发生变化,这种现象称为放射性。
1.4放射性同位素能够自发地放出射线从而变成另一种元素的同位素称为放射性同位素。
放射性同位素又可分为天然放射性同位素和人工放射性同位素。
1.5核衰变(或衰变)不稳定同位素的原子核能自发地发生变化而入射出某种粒子(例发α、β-、β+等)和射线(例如γ射线等)的现象称为核衰变或衰变。
放射性核素的衰变与环境温度、压力、湿度等外界条件无关,而是取决于原子核内部的物理状态。
对某种特定的放射性同位素的某个特定放射性原子,它何时衰变是随机的,但是可以用统计方法来处理的,则单位时间内发生衰变的几率都是相同的这个几率叫做衰变常数,λ。
假定在to时刻有N个放射性原子,到时刻则有个放射性原子核发生衰变,则:公式(1)就是放射性衰变的基本方程。
是衰变率,通常称为放射性活度(后面再述)。
适于强源测量的便携式反康普顿γ探测系统设计
2 系统设计
需要尽可能减薄主探测器和反符合探测器的封装材
便携式反康普顿 γ 探测系统设计主要包括探测
器的选取、结构设计及屏蔽体设计 3 个部分。
料,且应使用低 原 子 序 数 元 素 组 成 的 材 料。 本 文 采
用金属铍作为主探测器的外壳和反符合探测器的内
2.
1 探测器的选取
选取 主 探 测 器 需 要 兼 顾 分 辨 率、效 率 及 实 验 保
sabou
t70 kg The Comp
t
onsupp
r
e
s
s
i
onf
a
c
t
o
r
so
ft
he de
t
e
c
t
i
ons
t
em wi
t
h 4π
ys
s
t
ruc
t
u
r
ef
o
r662keVand1525keV γ
r
aysa
r
e63and29 r
e
spe
c
t
i
ve
l
i
l
et
heComp
t
on
y wh
suppr
e
s
的区间为高能区。
顿 γ 谱仪普遍采用 高 纯 锗 探 测 器 作 为 主 探 测 器、环
测器上发生能量 沉 积,逃 逸 的 散 射 γ 射线 又 在 主 探
体后,设备庞大厚重,无法实现移动式应用。曾国强
符合剔除掉;如果逃逸 的 散 射 γ 射 线 未 在 主 探 测 器
பைடு நூலகம்
效果的影响,获得了最 优 位 置
- 1、下载文档前请自行甄别文档内容的完整性,平台不提供额外的编辑、内容补充、找答案等附加服务。
- 2、"仅部分预览"的文档,不可在线预览部分如存在完整性等问题,可反馈申请退款(可完整预览的文档不适用该条件!)。
- 3、如文档侵犯您的权益,请联系客服反馈,我们会尽快为您处理(人工客服工作时间:9:00-18:30)。
arXiv:astro-ph/0511301v1 10 Nov 20051X-RAYANDSOFTGAMMA-RAYBEHAVIOUROFTHEGALACTICSOURCE1E1743.1–2843M.DelSanto1,L.Sidoli2,A.Bazzano1,M.Cocchi1,G.DeCesare1,A.Paizis3,andP.Ubertini11IstitutodiAstrofisicaSpazialeeFisicacosmicadiRoma–INAF,viadelFossodelCavaliere100,00133Roma,Italy
2IstitutodiAstrofisicaSpazialeeFisicacosmicadiMilano–INAF,viaE.Bassini15,20133Milano,Italy
3ISDC,Chemind’´Ecogia16,1290Versoix,Switzerland
ABSTRACTTheX-raypersistentsource1E1743.1–2843,locatedintheGalacticCentreregion,hasbeendetectedbyallX-raytelescopeabove2keV,whereasitisnotvisibleinthesoftX-rays(i.e.Rosat)becauseofthehighcolumndensityalongtheline-of-sight.Moreover,thenatureofthissourceremainsstillunknown.Thegamma-raysatel-liteINTEGRALhaslongobservedtheGalacticCentrere-gionintheframeworkoftheCoreProgramme.Were-portonresultsoftwoyearsofINTEGRALobservationsof1E1743.1–2843detectedforthefirsttimeinthesoftgamma-rayband.Sincethesourcedoesnotshowanyev-idenceforstrongvariability,wepresentthebroad-bandspectralanalysisusingnotsimultaneousXMM-Newtonobservations.
Keywords:X-rayandgamma-ray:observations;X-rays:binaries;stars:individual:1E1743.1–2843.
1.INTRODUCTION1E1743.1-2843isoneofthemostabsorbed(NH>1023)X-raysourcesoftheGalacticCentre(GC)region,suggestingadistancecloseorevengreaterthantheGC.Inthelastyearsthesourcehasbeenobservedbynu-merousX-raytelescopesupto20keV,butithasneverbeendetectedinthehardX-rays,becauseofthelackofcombinedhighspatialresolutionandgoodsensitivityin-strumentsathighenergies.BeppoSAXhaslongobservedtheGalacticCentreregion,butithasneverdetectedanyburstingactivity(in’tZand2000),norperiodicpulsationfromthissource(Cremonesietal.1999).AlsoXMM-NewtonobservationsreportedbyPorquetetal.(2003),limitedtotherangebelow10keV,didnotsolvedthemys-teryofthesourcenature;theyunderlinedthathighenergyobservationscouldhelpinthedeterminationofthecom-pactobjectnature.Wereporthereonthefirstdetectioninthesoftgamma-raydomain(upto70keV)obtainedduringatwoyearsmonitoringwiththegamma-rayim-agerIBIS,on-boardtheINTEGRALsatellite.Abroadbandspectralanalysishasbeenalsoperformedusingre-analysedXMM-Newtondata.
2.OBSERVATIONSANDDATAANALYSISWehaveanalysedpublicIBIS/ISGRIobservationsoftheGalacticCentreregionperformedin2003andthe2004observationsofCoreProgramme.The2003effectiveex-posuretimeis∼2Ms;∼1Msin2004.Datawerere-ducedusingOSA5.0.The20-40keVtemporalbehaviourhasbeenextractedfromthewholedatasetwhilespec-tralanalysisconcernonlythe2003pointings.SearchingthesourcefieldintheXMM-Newtonpublicarchivewefound2XMM-Newtonobservationsperformedon2000September19th(obs.401)and21th(obs.501).Amongthese,onlyoneoftheXMM-Newtonobservations(obs.401)hasbeenreportedinliterature(Porquetetal.2003).Herewepresentare-analysisofthisobservation,nownon-affectedbypile-upproblems.XMM-NewtondatahavebeenanalysedbySAS6.5.Inordertoexcludepile-upeffects,weselectedanannularregionwithinnerradiusof10”andouterradiusof40”.Backgroundspectrawereobtainedfromsource-freeregionsofthesameobserva-tions.
3.RESULTSANDDISCUSSIONTheGalacticCentreispointedbyINTEGRALduringtwovisibilitywindowsperyear.Thetemporalbehaviourof1E1743.1–2843over2yearsofIBISobservationsforatotalofabout3Msisshown(Fig.1).Thesourceshowsmarginalvariabilityoverfewmonthstimesscale,
Figure1.20-40keVtemporalbehaviourof1E1743.1–2843withINTEGRALstartingfromFebruary2003tillApril2005.2Table1.Modelparametersobtainedbythebroad-bandspectralfitusingXMM-Newton(twoobservations)andIS-GRI(2003meanspectrum).Themeaningofthesymbolsisthefollowing:pow=power-law,bb=blackbody,dbb=disk-blackbodyinXSPEC;αisthepower-lawphotonindex,kTistheblackbodytemperatureortheinnerdisktemperature,dependingontheadoptedmodel.
Obs.401bb+po19.5+1.1−0.91.8+0.1−0.13.1+0.1−0.13.97.3468/375diskbb+po18.6+0.8−0.73.1+0.1−0.12.5+0.1−0.23.5475/375
aThe2–10keVfluxoftheunabsorbedfitmodelinunitsof10−10ergcm−2s−1.bThebroad-bandflux(1–100keV)oftheunabsorbedbest-fitmodelinunitsof10−10ergcm−2s−1.
inagreementwithresultsreportedbyBelangeretal.(2005).Becauseofitsratherconstanthighenergybe-haviour,wefittedtheaverageIBIS/ISGRIspectrumof2003withnon-simultaneousPN,MOS1andMOS2data(Fig.2).Weusedtwomodels:ablackbodyplusapowerlawandamulti-temperaturediscplusapowerlaw.Spec-tralparametersarepresentedinTab.1.Thetwoobserva-tionsshowparametersconsistentwithintheerrors.Thesteepnessofthepowerlawcomponentindicatesasofthard-X-rayspectrumforthissource.Weconfirmthefur-therindicationbyCremonesietal.(1999)whichrulesouttheHMXBnature.Sofar,theobservationalscenarioseemstobeinfavourofaLMXBsystem.Startingfromthishypothesis,thenatureofthecompactobjectneedstobediscussed.Wehaveestimatedluminositiesandre-latedfractionsinEddingtonluminositybothforNeutronStar(NS)andBlackHole(BH),consideringthreepossi-bledistancesfor1E1743.1–2843.WeassumedMNS=1.4M⊙andMBH=10M⊙.Let’ssupposethattheaccretingobjectisaNS.Duringmorethan20yearsofobservations,thelackoftype-IX-rayburstsisnoteworthy.NeverthelessitisinagreementwiththeestimatedluminositiesinEddingtonluminosityfractions(Tab.2).Type-IX-rayburstsbe-comeraregoingupafewpercentofEddingtonluminos-