Fault branching and rupture directivity
推拉钥匙(和 Прокс

Copyright © 2010 Linear LLC231340 AACT-31DH ACT-34DHOperation InstructionsDESCRIPTIONThe ACT-31DH and ACT-34DH are TRANS PROX key fobs that contain a radio transmitter plus a HID proximity tag. Request access by pressing a button to send a wireless signal to a Linear MegaCode ® receiver or by moving the unit within two inches of a compa tible 26-bit HID forma t proximity rea der. The HID pr oximity tag is designed to wor k with Linear ’s Model AM‑DPR HID reader, other manufacturer’s 26‑bit HID readers may also be compatible, but not all have been tested.The ACT-31DH is a single-button minia ture TRANS PROX that sends one wireless code. The ACT-34DH is a four-button minia ture TRANS PROX tha t sends four different wireless codes, depending on which button is pressed.In a ddition to ea ch unit’s Mega Code ® ra dio tra nsmission capabilities (factory set from over a million possible ID codes), both units contain a built-in proximity tag. The proximity tag is factory programmed to the same ID and facility code as the transmitter using card access 26-bit Wiegand format.The TRANS PROXs are powered by two Type 2016 “coin cell” batteries. A 2-part key ring is supplied with the units.PROGRAM TRANSMITTER INTO RECEIVERLinea r’s receivers tha t a ccept “Block Coding” ca n be programmed to accept a user defined block of ID codes. The ACT-31DH a nd ACT-34DH TRANS PROXs a re block coded. Ea ch block of tra nsmitters a re la beled with sta rting a nd ending block code numbers, along with an optional facility code number. Refer to the receiver instructions for details on how to program the block and facility code numbers.For non Block Coded single lea rning receivers, press the desired tra nsmitter button while the receiver is in programming mode to program that button into the receiver.Refer to the access system instructions for details on how to enroll the proximity tags into the system.REPLACING BATTERIESUSA & Canada (800) 421-1587 & (800) 392-0123(760) 438-7000 - Toll Free FAX (800) 468-1340LINEAR LIMITED WARRANTYThis Linear product is warranted ag ainst defects in material and workmanship for twelve (12) months. This warranty extends only to wholesale customers who buy direct from Linear or through Linear’s normal distribution channels. Linear does not warrant this product to consumers. Consumers should inquire from their selling dealer as to the nature of the dealer’s warranty, if any. There are no obligations or liabilities on the part of Linear LLC for consequential damages arising out of or in connection with use or performance of this product or other indirect damages with respect to loss of property, revenue, or profit, or cost of removal, installation, or reinstallation. All implied warranties, including implied warranties for merchantability and implied warranties for fitness, are valid only until the warranty expires. This Linear LLC Warranty is in lieu of all other warranties express or implied.All products returned for warranty service require a Return Product Authorization Number (RPA#). Contact Linear Technical Services at 1-800-421-1587 for an RPA# and other important details.IMPORTANTLinear radio controls provide a reliable communications link and fill an important need in portable wireless signaling. However, there are some limitations which must be observed.• For U.S. installations only: The radios are required to comply with FCC Rules and Regulations as Part 15 devices. As such, they have limited transmitter power and therefore limited range.• A receiver cannot respond to more than one transmitted signal at a time and may be blocked by radio signals that occur on or near their operating frequencies, regardless of code settings.• Changes or modifications to the device may void FCC compliance.• Infrequently used radio links should be tested regularly to protect against undetected interference or fault.• A general knowledge of radio and its vagaries should be gained prior to acting as a wholesale distributor or dealer, and these facts should be communicated to the ultimate users.• This device complies with FCC Part 15 and Industry Canada Rules and Regulations. Operation is subject to the following two conditions: (1) This device may not cause harmful interference, and (2) this device must accept any interference received, including interference that may cause undesired operation.12345TWIST A COIN IN SLOT TOOPEN TRANSMITTER CASEREMOVE THE BACK OF THE CASE REMOVE THE TWOBATTERIESSLIDE IN TWO NEW TYPE 2016 BATTERIES BE SURE BOTH PLUS (+)SIDES ARE FACING AWAY FROM THE CIRCUIT BOARDSNAP CASE TOGETHERDISCARD BATTERIES PROPERLYACT-34DHACT-31DHUSE AS ATRANSMITTERUSE AS APROXIMITY TAGLINEAR MODEL AM-DPRHID COMPATIBLE TRANS PROXIntegrated transmitter & HID proximity tagPROXTRANS。
三星复合机错误代码于解决办法

Cover Switch Connector
CN29 Connector 24V1 ˧ No. 2,3,4 Pin 24V enable ˧ No. 28 Pin
ServiceBiblioteka Manual4-31Samsung Electronics
Alignment & Troubleshooting
● Code 01-004
Troubleshooting 4-31 page 4-32 page 4-33 page 4-34 page 4-35 page 4-36 page 4-37 page 4-38 page 4-39 page 4-40 page 4-41 page 4-41 page 4-42 page
4-43 page
Flat
6p Feed/Tray empty
Pickup Solenoid
7p MP empty/MP solenoid
Service Manual
4-32
Samsung Electronics
Alignment & Troubleshooting
● Code 01-005
● Error message Paper jam in tray 1
Error Code 01-000 01-004 01-005 01-006 01-018 01-009 01-010 01-015 01-016 01-017 02-000 02-001 02-006 02-002 02-005 03-000 03-007 03-008 03-009 03-015 04-001 04-002 04-008 08-000 08-001 08-002 08-006 08-003 08-010 08-004 08-006
《风险评价技术及方法》 11._Fault_Tree_Analysis
Chapter 11Fault Tree Analysis11.1INTRODUCTIONFault tree analysis (FTA)is a systems analysis technique used to determine the root causes and probability of occurrence of a specified undesired event.FTA is employed to evaluate large complex dynamic systems in order to understand and prevent potential ing a rigorous and structured methodology,FTA allows the systems analyst to model the unique combinations of fault events that can cause an undesired event to occur.The undesired event may be a system hazard of concern or a mishap that is under accident investigation.A fault tree (FT)is a model that logically and graphically represents the various combinations of possible events,both faulty and normal,occurring in a system that lead to an undesired event or state.The analysis is deductive in that it transverses from the general problem to the specific causes.The FT develops the logical fault paths from a single undesired event at the top to all of the possible root causes at the bottom.The strength of FTA is that it is easy to perform,easy to understand,provides useful system insight,and shows all of the possible causes for a problem under investigation.Fault trees are graphical models using logic gates and fault events to model the cause–effect relationships involved in causing the undesired event.The graphical model can be translated into a mathematical model to compute failure probabilities and system importance measures.FT development is an iterative process,where the initial structure is continually updated to coincide with design development.In the analysis of systems there are two applications of FTA.The most commonly used application is the proactive FTA,performed during system development to influence design by predicting and preventing future problems.The other 183Hazard Analysis Techniques for System Safety ,by Clifton A.Ericson,IICopyright #2005John Wiley &Sons,Inc.184FAULT TREE ANALYSISapplication is the reactive FTA,performed after an accident or mishap has occurred. The techniques used for both applications are identical except the reactive FTA includes the use of mishap evidence and the evidence event gate.When used as a system safety analysis tool,the FT results in a graphic and logical representation of the various combinations of possible events,both faulty and normal,occurring within a system,which can cause a predefined undesired event. An undesired event is any event that is identified as objectionable and unwanted, such as a potential accident,hazardous condition,or undesired failure mode.This graphic presentation exposes the interrelationships of system events and their interdependence upon each other,which results in the occurrence of the undesired event.The completed FT structure can be used to determine the significance of fault events and their probability of occurrence.The validity of action taken to eliminate or control fault events can be enhanced in certain circumstances by quantifying the FT and performing a numerical evaluation.The quantification and numerical evalu-ation generates three basic measurements for decision making relative to risk acceptability and required preventive measures:1.The probability of occurrence of the undesired event2.The probability and significance of fault events(cut sets)causing theundesired event3.The risk significance or importance of componentsIn most circumstances a qualitative evaluation of the fault tree will yield effective results at a reduced cost.Careful thought must be given in determining whether to perform a qualitative or a quantitative FTA.The quantitative approach provides more useful results,however,it requires more time and experienced personnel. The quantitative approach also requires the gathering of component failure rate data for input to the FT.Since a FT is both a graphic and a logical representation of the causes or system faults leading to the undesired event,it can be used in communicating and support-ing decisions to expend resources to mitigate hazards.As such,it provides the required validity in a simple and highly visible form to support decisions of risk acceptability and preventive measure requirements.The FT process can be applied during any lifecycle phase of a system—from concept to usage.However,FTA should be used as early in the design process as possible since the earlier necessary design changes are made,the less they cost.An important time-and cost-saving feature of the FT technique is that only those system elements that contribute to the occurrence of the undesired event need to be analyzed.During the analysis,noncontributing elements are ruled out and are,thus, not included in the analysis.This means that a majority of the effort is directed toward the elimination or control of the source or sources of the problem area. However,system elements not involved with the occurrence of one undesired event may be involved with the occurrence of another undesired event.11.2BACKGROUND185In summary,the FT is used to investigate the system of concern,in an orderly and concise manner,to identify and depict the relationships and causes of the undesired event.A quantitative evaluation may be performed in addition to a qualitative evalu-ation to provide a measure of the probability of the occurrence of the top-level event and the major faults contributing to the top-level event.The analyst may use the results of a FTA as follows:1.Verification of design compliance with established safety requirements2.Identification of design safety deficiencies(subtle or obvious)that have devel-oped in spite of existing requirements3.Identification of common mode failures4.Establishment of preventive measures to eliminate or mitigate identifieddesign safety deficiencies5.Evaluation of the adequacy of the established preventive measures6.Establishment or modification of safety requirements suitable for the nextdesign phase11.2BACKGROUNDThis analysis technique falls under the system design hazard analysis type (SD-HAT).Refer to Chapter3for a description of the analysis types.The FTA tech-nique has been referred to as logic tree analysis and logic diagram analysis.Fault tree analysis has several basic purposes,which include the following:1.Find the root causes of a hazard or undesired event during design developmentin order that they can be eliminated or mitigated.2.Establish the root causes of a mishap that has occurred and prevent them fromrecurring.3.Identify the undesired event causal factor combinations and their relativeprobability.4.Determine high-risk fault paths and their mechanisms.5.Identify risk importance measures for components and fault events.6.Support a probabilistic risk assessment(PRA)of system designs.The FTA technique can be used to model an entire system,with analysis coverage given to subsystems,assemblies,components,software,procedures,environment, and human error.FTA can be conducted at different abstraction levels,such as conceptual design,top-level design,and detailed component design.FTA has been successfully applied to a wide range of systems,such as missiles,ships,space-craft,trains,nuclear power plants,aircraft,torpedoes,medical equipment,and chemical plants.The technique can be applied to a system very early in design development and thereby identify safety issues early in the design process.Early186FAULT TREE ANALYSISapplication helps system developers to design in safety of a system during early development rather than having to take corrective action after a test failure or a mishap.A basic understanding of FTA theory is essential to developing FTs of small and noncomplex systems.In addition it is crucial for the analyst to have a detailed under-standing of the system regardless of complexity.As system complexity increases, increased knowledge and experience in FTA is also required.Overall,FTA is very easy to learn and understand.Proper application depends on the complexity of the system and the skill of the analyst.Applying FTA to the analysis of a system design is not a difficult process.It is more difficult than an analysis technique such as a PHA,primarily because it requires a logical thought process,an understanding of FTA construction method-ology,and a detailed knowledge of system design and operation.FTA does not require knowledge of high-level mathematics compared to Markov or Petri net analyses.The FTA technique enjoys a favorable reputation among system safety analysts in all industries utilizing the technique.In some industries it is the only tool that can provide the necessary probability calculations for verification that numerical requirements are being met.Many commercial computer programs are available to assist the analyst in building,editing,and mathematically evaluating FTs.Some analysts criticize the FTA tool because it does not always provide probabil-ities to six-decimal-place accuracy when modeling certain designs.However,com-parison of FT model results to those of other tools,such as Markov analysis(MA) show that FTA provides very comparable results with much greater simplicity in modeling difficulty.In addition,six-digit accuracy is sometime meaningless when the input data is not precise.Although FTA is classified as a hazard analysis,it is primarily used as a root cause analysis tool to identify and evaluate the causal factors of a hazard.In addition,it can provide a probability risk assessment.Markov analysis could be utilized in place of FTA for probability calculations; however,MA has limitations that FTA does not(refer to Chapter18).For example, it is difficult to model large complex systems,the mathematics are more cumber-some,it is difficult to visualize fault paths in an MA model,and an MA model does not produce cut sets.11.3HISTORYThe FTA technique was invented and developed by H.Watson and Allison B. Mearns of Bell Labs for use on the Minuteman Guidance System.Dave Haasl of the Boeing Company recognized the power of FTA and applied it for quantitative safety analysis of the entire Minuteman Weapon System.The analytical power and success of the technique was recognized by the commercial aircraft industry and the nuclear power industry,and they then began using it for safety evaluations.11.4THEORY187 Many individuals in each of these industries contributed to enhancing the state-of-the-art in fault tree mathematics,graphics,and computer algorithms.11.4THEORYFault tree analysis is a robust,rigorous,and structured methodology requiring the application of certain rules of Boolean algebra,logic,and probability theory.The FT itself is a logic diagram of all the events(failure modes,human error,and normal conditions)that can cause the top undesired event to occur.When the FT is complete,it is evaluated to determine the critical cut sets(CSs) and probability of failure.The cut sets are the combination of failure events that can cause the top to occur.The FT evaluation provides the necessary information to sup-port risk management decisions.As shown in Figure11.1the theory behind FTA is to start with a top undesired event(UE)(e.g.,hazard)and model all of the system faults that can contribute to this top event.The FT model is a reflection of the system design,from a failure state viewpoint.In this example the UE might be“inadvertent warhead initiation due to system faults.”The FTs are developed in layers,levels,and branches using a repetitive analysis process.Figure11.2demonstrates an FT developed in layers,with each major layer representing significant aspects of the system.For example,the top FT structure usually models the system functions and phases,the intermediate FT structure SystemFigure11.1FTA overview.models subsystem fault flows,and the bottom FT structure models assembly and component fault flows.11.5METHODOLOGYThere are eight basic steps in the FTA process,as shown in Figure 11.3.These are the steps required to perform a complete and accurate FTA.Some analysts may combine or expand some of the steps,but these are the basic procedures that must be followed.11.5.1Building BlocksFault trees consists of nodes interlinked together in a treelike structure.The nodes represent fault /failure paths and are linked together by Boolean logic and symbols.The FT symbols form the basic building blocks of FTA and consist of four categories:1.Basic events 2.Gate events 3.Conditional events 4.Transfer eventsFigure 11.4shows the standard symbols for basic event (BE),condition event (CE),and transfer event (TE)as they would appear on an FT and their associated definitions.Note that the rectangle is nothing more than a placeholder for text.When FTA was first developed,the text was placed directly in the BEsymbolsFigure 11.2Major levels of a fault tree.188FAULT TREE ANALYSIS1. Understand system design and operation. Acquire current design data (drawings, schematics, procedures, diagrams, etc.). 4. Follow construction process, rules, and logic to build FT model of the system.5. Generate cut sets and probability. Identify weak links and safety problems in the design. 6. Check if the FT model is correct, complete, and accurately reflects system design. 7. Modify the FT as found necessary during validation or due to system design changes. 8. D ocument the entire analysis with supporting data. Provide as customer product or preserve for future reference.2. Descriptively define problem and establish the correct undesired event for the analysis.3. Define analysis ground rules and boundaries. Scope the problemand record all ground rules. Figure 11.3FTAprocess.Figure 11.4FT symbols for basic events,conditions,and transfers.11.5METHODOLOGY 189190FAULT TREE ANALYSISFigure11.5FT symbols for gate events.and the rectangle was only used for gate nodes,but with the advent of computer graphics this became cumbersome,so the rectangle was adopted for all nodes.Figure11.5shows the gate event symbols,definitions,and probability calculation formulas.It is through the gates that the FT logic is constructed and the tree grows in width and depth.The symbols shown in Figures11.4and11.5are generally con-sidered the standard FT symbols,however,some FT software programs do utilize slightly different symbols.Figure11.6shows some alternative and additional symbols that might be encountered.Figure11.6Alternative FT symbols.11.5METHODOLOGY191 11.5.2DefinitionsIn addition to the FT symbol definitions,the following definitions define important concepts utilized in FTA:Cut set(CS)Set of events that together cause the top UE to occur.Also referred to as a fault path.Minimal cut set(MinCS or MCS)Cut set that has been reduced to the minimum number of events that cause the top UE to occur.The CS cannot be further reduced and still guarantee occurrence of the top UE.CS order Number of items in a CS.A one-order CS is a single-point failure(SPF).A two-order CS has two items ANDed together.Multiple occurring event(MOE)FT basic event that occurs in more than one place in the FT.Multiple occurring branch(MOB)FT branch that is used in more than one place in the FT.This is one place in the FT where the transfer symbol is used.All BEs below the MOB are automatically MOEs.Failure Occurrence of a basic inherent component failure,for example,“resistor fails open.”Fault Occurrence or existence of an undesired state of a component,subsystem,or system.For example,“light off”is an undesired fault state that may be due to light bulb failure,loss of power,or operator action.(Note that all failures are faults,but not all faults are failures.)Primary fault/failure Independent component failure that cannot be further defined at a lower level.For example,“diode inside a computer fails(due to mate-rielflaw).”Secondary fault/failure Independent component failure that is caused by an external force on the system.For example,“diode fails due to excessive RF/ EMI energy in system.”Failure due to out-of-tolerance operational or environ-mental conditions.Command fault/failure Item that is“commanded”to fail or forced into a fault state by system design.For example,“light off”is the command fault for the light,that is,it is commanded to fail off if certain system faults cause loss of power.A command fault can be the normal operational state,but,at the wrong time,and sometimes it is lack of the desired normal state when desired or intended.(This is the“transition”to look for in the analysis.)Exposure time(ET)Length of time a component is effectively exposed to failure during system operation.ET has a large effect on FT probability calculations (P¼1.0–e2l T).Exposure time can be controlled by design,repair,circumven-tion,testing,and monitoring.Critical path Highest probability CS that drives the top UE probability.The most dramatic system improvement is usually made by reducing the probability of this CS.Importance measure Measure of the relative importance(sensitivity)of a BE or CS in the overall FT.192FAULT TREE ANALYSISFigure11.7demonstrates the usage of FT transfer symbols and the MOE/MOB concepts.Thisfigure shows an example of three FT pages.On page1,the node with a triangle at the bottom with the name A represents a transfer in.This means that a duplicate of branch A should also go here,but it is drawn somewhere else,treepage2in this case.In this case,A is not an MOB but merely the transfer of11.5METHODOLOGY193 to start on a new page,due to lack of space on page1.Transfer C represents an MOE, as it is intended to be repeated in two different places in the FT.11.5.3Construction—BasicsFault tree construction is an iterative process that begins at the treetop and continues down through all of the tree branches.The same set of questions and logic is applied on every gate,moving down the tree.After identifying the top UE,sub-undesired events are identified and structured into what is referred to as the top fault tree layer.The actual deductive analysis begins with the development of the faultflow or cause-and-effect relationship of fault and normal events through the system. This deductive reasoning involves determining the type of gate and the particular inputs to this gate at each gate level of the FT.The faultflow links theflow of events from the system level,through the subsystem level,to the component level.The FT development proceeds through the identification and combination of the system normal and fault events,until all events are defined in terms of basic ident-ifiable hardware faults,software faults,and human error.This is the level of basic events in the FT structure and is the end point for construction of the FT.In developing the structure of the FT,certain procedures must consistently be fol-lowed in a repetitive manner.These procedures are necessary at each gate level to determine the type of gate to be used and the specific inputs to the gate.The estab-lished procedure evolves around three principal concepts:1.The I–N–S concept2.The SS–SC concept3.The P–S–C conceptI–N–S Concept This concept involves answering the question“What is immediate(I),necessary(N),and sufficient(S)to cause the event?”The I–N–S question identifies the most immediate cause(s)of the event;the causes that are absolutely necessary;and only includes the causes that are absolutely necessary and sufficient.For example,water is necessary to maintain a green lawn and rain is sufficient to provide it,or a sprinkler system is sufficient.This seems like an obvious question to ask,but too often it is forgotten in the tur-moil of analysis.There are several reasons for stressing this question:1.It helps keep the analyst from jumping ahead.2.It helps focus on identifying the next element in the cause–effect chain.3.It is a reminder to only include the minimum sufficient causes necessary andnothing extraneous.SS–SC Concept The SS–SC concept differentiates between the failure being “state-of-the-system”(SS)and“state-of-the-component”(SC).If a fault in the event box can be caused by a component failure,classify the event as an SC fault.If the fault cannot be caused by a component failure,classify the fault as an194FAULT TREE ANALYSISSS fault.If the fault event is classified as SC,then the event will have an OR gate with P–S–C inputs.If the fault event is classified as SS,then the event will be further developed using I–N–S logic to determine the inputs and gate type.P–S–C Concept This concept involves answering the question“What are the primary(P),secondary(S),and command(C)causes of the event?”The P–S–C question forces the analyst to focus on specific causal factors.The rationale behind this question is that every component fault event has only three ways of failing:a primary failure mode,a secondary failure mode,or a command path fault. Figure11.8demonstrates this concept.An added benefit of this concept is that if more than two of the three elements of P–S–C are present,then an OR gate is auto-matically indicated.Figure11.8depicts how a system element is subdivided into primary,secondary, and command events for the FT structure.Two types of system events exist—those that are intended and those that are not intended.The intended events follow the desired intended mode of system operation,while the command path faults follow the undesired modes of operation.A primary failure is the inherent failure of a system element(e.g.,a resistor fails open).The primary failure is developed only to the point where identifiable internal component failures will directly cause the fault event.The failure of one component is presumed to be unrelated to the failure of any other component(i.e.,independent).A secondary failure is the result of external forces on the component(e.g.,a resis-tor fails open due to excessive external heat exposure).Development of the second-ary failure event requires a thorough knowledge of all external influences affecting system components(e.g.,excessive heat,vibration,EMI,etc.).The failure of one COutputFigure11.8P–S–C concept.component may be related to the failure of other components (i.e.,dependent).This type of component failure is due to any cause other than its own primary failure.A command failure is an expected,or intended,event that occurs at an undesired time due to specific failures.For example,missile launch is an intended event at a certain point in the mission.However,this event can be “commanded”to occur pre-maturely by certain failures in the missile arm and fire functions.Failures and faults in this chain of events are referred to as the command path faults.The command path is a chain of events delineating the path of command failure events through the system.Analysis of command path events creates an orderly and logical manner of fault identification at each level of the FT.A path of command events through the FT corresponds to the signal flow through the system.In devel-oping command events,the question “what downstream event commands the event to occur?”is asked for each event being analyzed.At the finish of each FT branch,the command path will terminate in primary and /or secondary events.Note that the command path is primarily a guideline for analysis of fault event development through a system.Once an analysis is completed,comparison between the FT and the system signal flow diagram will show that the FT command path rep-resents the signal flow through the system along a single thread.For another example of a command path fault,consider a relay.When the relay coil is energized,the relay contacts will automatically close,as designed and intended.If a failure down stream of the relay provides inadvertent power to the relay coil,then the closing of the relay contacts is considered as a “command”fail-ure.The relay operates as normally intended,except at the wrong time.11.5.4Construction—AdvancedAs previously mentioned,FT building is a repetitive process.Figure 11.9displays this iterative process;for every logic gate on the FT,the same set of three questions is asked:I–N–S,P–S–C,andSS–SC.EFFECT CAUSE Iterative Analysis 1) I-N-S 2) SS-SC 3) P-S-C1) I-N-S 2) SS-SC 3) P-S-C 1) I-N-S 2) SS-SC 3) P-S-C Figure 11.9FT building steps.11.5METHODOLOGY 195196FAULT TREE ANALYSISAnswering these questions provides the gate input events and the gate logic involved.As can be seen from this diagram,as the iterative analysis proceeds down-ward,the cause–effect relationships are linked in an upward manner.The basic steps to follow when constructing the FT include:1.Review and understand the fault event under investigation.2.Identify all the possible causes of this event via the questions:a.Immediate,necessary,and sufficient?b.State of component or state of system?c.Primary,secondary,and command?3.Identify the relationship or logic of the cause–effect events.4.Structure the tree with the identified gate input events and gate logic.5.Double check logic to ensure that a jump in logic has not occurred.6.Keep looking back to ensure identified events are not repeated.7.Repeat for next fault event(i.e.,gate).Some critical items to remember while performing this process:1.When possible,start analyzing in the design at the point where the undesiredevent occurs.2.Work backward(through the system)along signal or logicflow.3.Keep node wording clear,precise,and complete.4.Check to ensure all text boxes have unique text,no repeated text.5.Ensure you do not jump ahead of a possible fault event.6.Look for component or fault event transition states(e.g.,“no output signalfrom component A,”“no inputfluid to valve V1”).11.5.5Construction RulesSome basic rules for FT construction and development include:plete basic required data for each FT node(node type,node name,andtext).2.Give every node a unique identifying name.3.No gate-to-gate connections are allowed(always have text box).4.Always place relevant text in text box;never leave it blank.5.State event fault state exactly and precisely;use state transition wording.plete the definition of all inputs to a gate before proceeding.7.Keep events on their relative level for clarity.e meaningful naming convention.9.Do not draw lines from two gates to a single input (use the MOEmethodology).10.Assume no miracles (i.e.,miraculous component failure blocks other failuresfrom causing UE).11.I–N–S,P–S–C,and SS–SC are analysis concepts;do not use these wordsin text boxes.Figure 11.10demonstrates some typical violations of the FT construction rules.Violation of these rules creates many problems.For example,if a text box is missing or has no text in it,no one reading the FT will be able to understand the logic involved.11.6FUNCTIONAL BLOCK DIAGRAMSWhen constructing FTs,an important concept to remember is the use of functional block diagrams (FBDs).The FBD presents a simplified representation of the system design and operation for clarity and understanding.It shows the subsystem inter-faces and the component relationships.The FBD shows the functions that must be performed by the system for successful operation,thereby also indicating potential modes of faulty operation.When constructing an FT it is often much easier to work from an FBD than from a large complex electrical schematic.A general rule of thumb is:If an analyst cannot draw an FBD of the system being analyzed,then the analyst may not fully understand the system design and operation .As shown in Figure 11.11,in many cases the FBD forms the levels and events directly for theFTA.Figure 11.10FT construction errors.11.6FUNCTIONAL BLOCK DIAGRAMS 197。
Advantage WPONI模块用户手册说明书
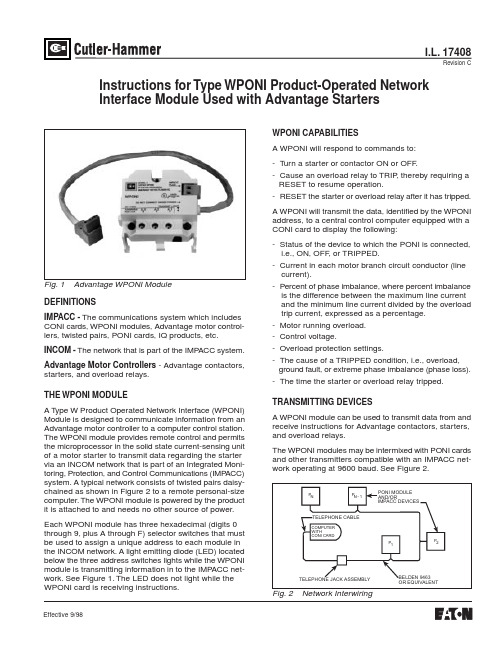
I.L. 17408Revision CInstructions for Type WPONI Product-Operated Network Interface Module Used with Advantage StartersFig. 1 Advantage WPONI Module DEFINITIONSIMPACC - The communications system which includesCONI cards, WPONI modules, Advantage motor control-lers, twisted pairs, PONI cards, IQ products, etc.INCOM - The network that is part of the IMP ACC system.Advantage Motor Controllers - Advantage contactors,starters, and overload relays.THE WPONI MODULEA T ype W Product Operated Network Interface (WPONI)Module is designed to communicate information from an Advantage motor controller to a computer control station.The WPONI module provides remote control and permits the microprocessor in the solid state current-sensing unit of a motor starter to transmit data regarding the starter via an INCOM network that is part of an Integrated Moni-toring, Protection, and Control Communications (IMP ACC)system. A typical network consists of twisted pairs daisy-chained as shown in Figure 2 to a remote personal-size computer. The WPONI module is powered by the product it is attached to and needs no other source of power.Each WPONI module has three hexadecimal (digits 0through 9, plus A through F) selector switches that must be used to assign a unique address to each module in the INCOM network. A light emitting diode (LED) located below the three address switches lights while the WPONI module is transmitting information in to the IMP ACC net-work. See Figure 1. The LED does not light while the WPONI card is receiving instructions.Effective 9/98WPONI CAPABILITIESA WPONI will respond to commands to:-Turn a starter or contactor ON or OFF .-Cause an overload relay to TRIP , thereby requiring a RESET to resume operation.-RESET the starter or overload relay after it has tripped.A WPONI will transmit the data, identified by the WPONI address, to a central control computer equipped with a CONI card to display the following:-Status of the device to which the PONI is connected, i.e., ON, OFF , or TRIPPED.-Current in each motor branch circuit conductor (line current).-Percent of phase imbalance, where percent imbalance is the difference between the maximum line current and the minimum line current divided by the overload trip current, expressed as a percentage.-Motor running overload.-Control voltage.-Overload protection settings.-The cause of a TRIPPED condition, i.e., overload,ground fault, or extreme phase imbalance (phase loss).-The time the starter or overload relay tripped.TRANSMITTING DEVICESA WPONI module can be used to transmit data from and receive instructions for Advantage contactors, starters,and overload relays.The WPONI modules may be intermixed with PONI cards and other transmitters compatible with an IMP ACC net-work operating at 9600 baud. See Figure 2.Effective 9/98I.L. 17408Page 3CUTLER-HAMMER4201 North 27 Street Milwaukee, WI 53216Effective 9/98OPERATION CHECKAfter the IMPACC system has been installed, check the operation of each WPONI and PONI card by applying power to the parent unit and issuing an IMP ACC command through the system to each WPONI and PONI card in turn using the selected addresses. If the product responds by flashing the LED (OFF to receive, ON while transmitting,OFF to receive), all connections are correct. If the LED remains OFF , please the WPONI or PONI card.。
英语文摘
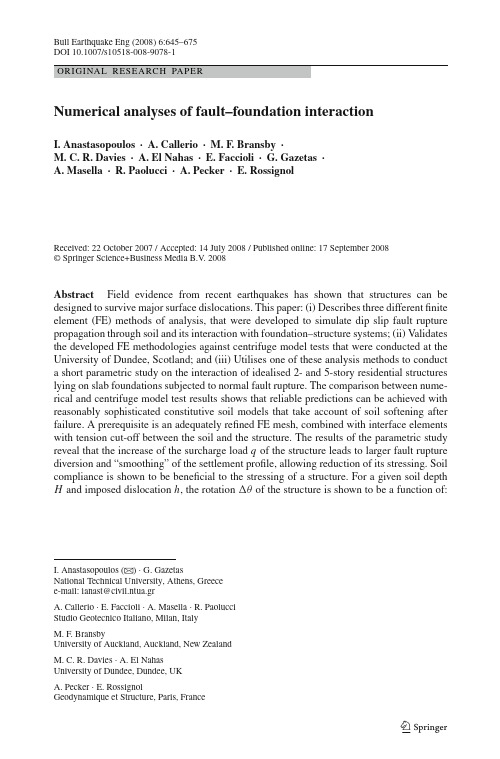
Bull Earthquake Eng(2008)6:645–675DOI10.1007/s10518-008-9078-1ORIGINAL RESEARCH PAPERNumerical analyses of fault–foundation interactionI.Anastasopoulos·A.Callerio·M.F.Bransby·M.C.R.Davies·A.El Nahas·E.Faccioli·G.Gazetas·A.Masella·R.Paolucci·A.Pecker·E.RossignolReceived:22October2007/Accepted:14July2008/Published online:17September2008©Springer Science+Business Media B.V.2008Abstract Field evidence from recent earthquakes has shown that structures can be designed to survive major surface dislocations.This paper:(i)Describes three differentfinite element(FE)methods of analysis,that were developed to simulate dip slip fault rupture propagation through soil and its interaction with foundation–structure systems;(ii)Validates the developed FE methodologies against centrifuge model tests that were conducted at the University of Dundee,Scotland;and(iii)Utilises one of these analysis methods to conduct a short parametric study on the interaction of idealised2-and5-story residential structures lying on slab foundations subjected to normal fault rupture.The comparison between nume-rical and centrifuge model test results shows that reliable predictions can be achieved with reasonably sophisticated constitutive soil models that take account of soil softening after failure.A prerequisite is an adequately refined FE mesh,combined with interface elements with tension cut-off between the soil and the structure.The results of the parametric study reveal that the increase of the surcharge load q of the structure leads to larger fault rupture diversion and“smoothing”of the settlement profile,allowing reduction of its stressing.Soil compliance is shown to be beneficial to the stressing of a structure.For a given soil depthH and imposed dislocation h,the rotation θof the structure is shown to be a function of:I.Anastasopoulos(B)·G.GazetasNational Technical University,Athens,Greecee-mail:ianast@civil.ntua.grA.Callerio·E.Faccioli·A.Masella·R.PaolucciStudio Geotecnico Italiano,Milan,ItalyM.F.BransbyUniversity of Auckland,Auckland,New ZealandM.C.R.Davies·A.El NahasUniversity of Dundee,Dundee,UKA.Pecker·E.RossignolGeodynamique et Structure,Paris,France123(a)its location relative to the fault rupture;(b)the surcharge load q;and(c)soil compliance.Keywords Fault rupture propagation·Soil–structure-interaction·Centrifuge model tests·Strip foundation1IntroductionNumerous cases of devastating effects of earthquake surface fault rupture on structures were observed in the1999earthquakes of Kocaeli,Düzce,and Chi-Chi.However,examples of satisfactory,even spectacular,performance of a variety of structures also emerged(Youd et al.2000;Erdik2001;Bray2001;Ural2001;Ulusay et al.2002;Pamuk et al.2005).In some cases the foundation and structure were quite strong and thus either forced the rupture to deviate or withstood the tectonic movements with some rigid-body rotation and translation but without damage(Anastasopoulos and Gazetas2007a,b;Faccioli et al.2008).In other cases structures were quite ductile and deformed without failing.Thus,the idea(Duncan and Lefebvre1973;Niccum et al.1976;Youd1989;Berill1983)that a structure can be designed to survive with minimal damage a surface fault rupture re-emerged.The work presented herein was motivated by the need to develop quantitative understan-ding of the interaction between a rupturing dip-slip(normal or reverse)fault and a variety of foundation types.In the framework of the QUAKER research project,an integrated approach was employed,comprising three interrelated steps:•Field studies(Anastasopoulos and Gazetas2007a;Faccioli et al.2008)of documented case histories motivated our investigation and offered material for calibration of the theoretical methods and analyses,•Carefully controlled geotechnical centrifuge model tests(Bransby et al.2008a,b)hel-ped in developing an improved understanding of mechanisms and in acquiring a reliable experimental data base for validating the theoretical simulations,and•Analytical numerical methods calibrated against the abovefield and experimental data offered additional insight into the nature of the interaction,and were used in developing parametric results and design aids.This paper summarises the methods and the results of the third step.More specifically: (i)Three differentfinite element(FE)analysis methods are presented and calibratedthrough available soil data.(ii)The three FE analysis methods are validated against four centrifuge experiments con-ducted at the University of Dundee,Scotland.Two experiments are used as a benchmark for the“free-field”part of the problem,and two more for the interaction of the outcrop-ping dislocation with rigid strip foundations.(iii)One of these analysis methods is utilised in conducting a short parametric study on the interaction of typical residential structures with a normal fault rupture.The problem studied in this paper is portrayed in Fig.1.It refers to a uniform cohesionless soil deposit of thickness H at the base of which a dip-slip fault,dipping at angle a(measured from the horizontal),produces downward or upward displacement,of vertical component h.The offset(i.e.,the differential displacement)is applied to the right part of the model quasi-statically in small consecutive steps.123hx O:“f o c u s ”O ’:“e p i c e n t e r ”Hanging wallFootwallyLW –LW hx O:“fo c u s ”O ’:“e p i c e n t e r ”Hanging wallFootwallyL W –LWq BStrip Foundation s(a )(b)Fig.1Definition and geometry of the studied problem:(a )Propagation of the fault rupture in the free field,and (b )Interaction with strip foundation of width B subjected to uniform load q .The left edge of the foundation is at distance s from the free-field fault outcrop2Centrifuge model testingA series of centrifuge model tests have been conducted in the beam centrifuge of the University of Dundee (Fig.2a)to investigate fault rupture propagation through sand and its in-teraction with strip footings (Bransby et al.2008a ,b ).The tests modelled soil deposits of depth H ranging from 15to 25m.They were conducted at accelerations ranging from 50to 115g.A special apparatus was developed in the University of Dundee to simulate normal and reverse faulting.A central guidance system and three aluminum wedges were installed to impose displacement at the desired dip angle.Two hydraulic actuators were used to push on the side of a split shear box (Fig.2a)up or down,simulating reverse or normal faulting,respectively.The apparatus was installed in one of the University of Dundee’s centrifuge strongboxes (Fig.2b).The strongbox contains a front and a back transparent Perspex plate,through which the models are monitored in flight.More details on the experimental setup can be found in Bransby et al.(2008a ).Displacements (vertical and horizontal)at different123Fig.2(a)The geotechnicalcentrifuge of the University ofDundee;(b)the apparatus for theexperimental simulation of faultrupture propagation through sandpositions within the soil specimen were computed through the analysis of a series of digital images captured as faulting progressed using the Geo-PIV software(White et al.2003).Soil specimens were prepared within the split box apparatus by pluviating dry Fontainebleau sand from a specific height with controllable massflow rate.Dry sand samples were prepared at relative densities of60%.Fontainebleau sand was used so that previously published laboratory element test data(e.g Gaudin2002)could be used to select drained soil parameters for thefinite element analyses.The experimental simulation was conducted in two steps.First,fault rupture propagation though soil was modelled in the absence of a structure(Fig.1a),representing the free-field part of the problem.Then,strip foundations were placed at a pre-specified distance s from the free-field fault outcrop(Fig.1b),and new tests were conducted to simulate the interaction of the fault rupture with strip foundations.3Methods of numerical analysisThree different numerical analysis approaches were developed,calibrated,and tested.Three different numerical codes were used,in combination with soil constitutive models ranging from simplified to more sophisticated.This way,three methods were developed,each one corresponding to a different level of sophistication:(a)Method1,using the commercial FE code PLAXIS(2006),in combination with a simplenon-associated elastic-perfectly plastic Mohr-Coulomb constitutive model for soil; 123Foundation : 2-D Elastic Solid Elements Elastic BeamElementsInterfaceElements hFig.3Method 1(Plaxis)finite element diecretisation(b)Method 2,utilising the commercial FE code ABAQUS (2004),combined with a modifiedMohr-Coulomb constitutive soil model taking account of strain softening;and(c)Method 3,making use of the FE code DYNAFLOW (Prevost 1981),along with thesophisticated multi-yield constitutive model of Prevost (1989,1993).Centrifuge model tests that were conducted in the University of Dundee were used to validate the effectiveness of the three different numerical methodologies.The main features,the soil constitutive models,and the calibration procedure for each one of the three analysis methodologies are discussed in the following sections.3.1Method 13.1.1Finite element modeling approachThe first method uses PLAXIS (2006),a commercial geotechnical FE code,capable of 2D plane strain,plane stress,or axisymmetric analyses.As shown in Fig.3,the finite element mesh consists of 6-node triangular plane strain elements.The characteristic length of the elements was reduced below the footing and in the region where the fault rapture is expected to propagate.Since a remeshing technique (probably the best approach when dealing with large deformation problems)is not available in PLAXIS ,at the base of the model and near the fault starting point,larger elements were introduced to avoid numerical inaccuracies and instability caused by ill conditioning of the element geometry during the displacement application (i.e.node overlapping and element distortion).The foundation system was modeled using a two-layer compound system,consisting of (see Fig.3):•The footing itself,discretised by very stiff 2D elements with linear elastic behaviour.The pressure applied by the overlying building structure has been imposed to the models through the self weight of the foundation elements.123Fig.4Method1:Calibration of constitutive model parameters utilising the FE code Tochnog;(a)oedometer test;(b)Triaxial test,p=90kPa•Beam elements attached to the nodes at the bottom of the foundation,with stiffness para-meters lower than those of the footing to avoid a major stiffness discontinuity between the underlying soil and the foundation structure.•The beam elements are connected to soil elements through an interface with a purely frictional behaviour and the same friction angleϕwith the soil.The interface has a tension cut-off,which causes a gap to develop between soil and foundation in case of detachment. Due to the large imposed displacement reached during the centrifuge tests(more than3m in several cases),with a relative displacement of the order of10%of the modeled soil height, the large displacement Lagrangian description was adopted.After an initial phase in which the geostatic stresses were allowed to develop,the fault displacement has been monotonically imposed both on the right side and the right bottom boundaries,while the remaining boundaries of the model have beenfixed in the direction perpendicular to the side(Fig.3),so as to reproduce the centrifuge test boundary conditions.3.1.2Soil constitutive model and calibrationThe constitutive model adopted for all of the analyses is the standard Mohr-Coulomb for-mulation implemented in PLAXIS.The calibration of the elastic and strength parameters of the soil had been conducted during the earlier phases of the project by means of the FEM code Tochnog(see the developer’s home page ),adopting a rather refined and user-defined constitutive model for sand.This model was calibrated with a set of experimental data available on Fontainebleau sand(Gaudin2002).Oedometer tests (Fig.4a)and drained triaxial compression tests(Fig.4b)have been simulated,and sand model parameters were calibrated to reproduce the experimental results.The user-defined model implemented in Tochnog included a yielding function at the critical state,which corresponds to the Mohr-Coulomb failure criterion.A subset of those parameters was then utilised in the analysis conducted using the simpler Mohr-Coulomb model of PLAXIS:•Angle of frictionϕ=37◦•Young’s Modulus E=675MPa•Poisson’s ratioν=0.35•Angle of Dilationψ=0◦123hFoundation : Elastic Beam ElementsGap Elements Fig.5Method 2(Abaqus)finite element diecretisationThe assumption of ψ=0and ν=0.35,although not intuitively reasonable,was proven to provide the best fit to experimental data,both for normal and reverse faulting.3.2Method 23.2.1Finite element modeling approachThe FE mesh used for the analyses is depicted in Fig.5(for the reverse fault case).The soil is now modelled with quadrilateral plane strain elements of width d FE =1m.The foun-dation,of width B ,is modelled with beam elements.It is placed on top of the soil model and connected through special contact (gap)elements.Such elements are infinitely stiff in compression,but offer no resistance in tension.In shear,their behaviour follows Coulomb’s friction law.3.2.2Soil constitutive modelEarlier studies have shown that soil behaviour after failure plays a major role in problems related to shear-band formation (Bray 1990;Bray et al.1994a ,b ).Relatively simple elasto-plastic constitutive models,with Mohr-Coulomb failure criterion,in combination with strain softening have been shown to be effective in the simulation of fault rupture propagation through soil (Roth et al.1981,1982;Loukidis 1999;Erickson et al.2001),as well as for modelling the failure of embankments and slopes (Potts et al.1990,1997).In this study,we apply a similar elastoplastic constitutive model with Mohr-Coulomb failure criterion and isotropic strain softening (Anastasopoulos 2005).Softening is introduced by reducing the mobilised friction angle ϕmob and the mobilised dilation angle ψmob with the increase of plastic octahedral shear strain:123ϕmob=ϕp−ϕp−ϕresγP fγP oct,for0≤γP oct<γP fϕres,forγP oct≥γP f(1)ψmob=⎧⎨⎩ψp1−γP octγP f,for0≤γP oct<γP fψres,forγP oct≥γP f⎫⎬⎭(2)whereϕp andϕres the ultimate mobilised friction angle and its residual value;ψp the ultimate dilation angle;γP f the plastic octahedral shear strain at the end of softening.3.2.3Constitutive model calibrationConstitutive model parameters are calibrated through the results of direct shear tests.Soil response can be divided in four characteristic phases(Anastasopoulos et al.2007):(a)Quasi-elastic behavior:The soil deforms quasi-elastically(Jewell and Roth1987),upto a horizontal displacementδx y.(b)Plastic behavior:The soil enters the plastic region and dilates,reaching peak conditionsat horizontal displacementδx p.(c)Softening behavior:Right after the peak,a single horizontal shear band develops(Jewelland Roth1987;Gerolymos et al.2007).(d)Residual behavior:Softening is completed at horizontal displacementδx f(δy/δx≈0).Then,deformation is accumulated along the developed shear band.Quasi-elastic behaviour is modelled as linear elastic,with secant modulus G S linearly incre-asing with depth:G S=τyγy(3)whereτy andγy:the shear stress and strain atfirst yield,directly measured from test data.After peak conditions are reached,it is assumed that plastic shear deformation takes placewithin the shear band,while the rest of the specimen remains elastic(Shibuya et al.1997).Scale effects have been shown to play a major role in shear localisation problems(Stone andMuir Wood1992;Muir Wood and Stone1994;Muir Wood2002).Given the unavoidableshortcomings of the FE method,an approximate simplified scaling method(Anastasopouloset al.2007)is employed.The constitutive model was encoded in the FE code ABAQUS(2004).Its capability toreproduce soil behaviour has been validated through a series of FE simulations of the directshear test(Anastasopoulos2005).Figure6depicts the results of such a simulation of denseFontainebleau sand(D r≈80%),and its comparison with experimental data by Gaudin (2002).Despite its simplicity and(perhaps)lack of generality,the employed constitutivemodel captures the predominant mode of deformation of the problem studied herein,provi-ding a reasonable simplification of complex soil behaviour.3.3Method33.3.1Finite element modeling approachThefinite element model used for the analyses is shown for the normal fault case in Fig.7.The soil is modeled with square,quadrilateral,plane strain elements,of width d FE=0.5m. 123Fig.6Method 2:Calibration ofconstitutive model—comparisonbetween laboratory direct sheartests on Fontainebleau sand(Gaudin 2002)and the results ofthe constitutive modelx D v3.3.2Soil constitutive ModelThe constitutive model is the multi-yield constitutive model developed by Prevost (1989,1993).It is a kinematic hardening model,based on a relatively simple plasticity theory (Prevost 1985)and is applicable to both cohesive and cohesionless soils.The concept of a “field of work-hardening moduli”(Iwan 1967;Mróz 1967;Prevost 1977),is used by defining a collection f 0,f 1,...,f n of nested yield surfaces in the stress space.V on Mises type surfaces are employed for cohesive materials,and Drucker-Prager/Mohr-Coulomb type surfaces are employed for frictional materials (sands).The yield surfaces define regions of constant shear moduli in the stress space,and in this manner the model discretises the smooth elastic-plastic stress–strain curve into n linear segments.The outermost surface f n represents a failure surface.In addition,accounting for experimental evidence from tests on frictional materials (de 1987),a non-associative plastic flow rule is used for the dilatational component of the plastic potential.Finally,the material hysteretic behavior and shear stress-induced anisotropic effects are simulated by a kinematic rule .Upon contact,the yield surfaces are translated in the stress space by the stress point,and the direction of translation is selected such that the yield surfaces do not overlap,but remain tangent to each other at the stress point.3.3.3Constitutive model parametersThe required constitutive parameters of the multi-yield constitutive soil model are summari-sed as follows (Popescu and Prevost 1995):a.Initial state parameters :mass density of the solid phase ρs ,and for the case of porous saturated media,porosity n w and permeability k .b.Low strain elastic parameters :low strain moduli G 0and B 0.The dependence of the moduli on the mean effective normal stress p ,is assumed to be of the following form:G =G 0 p p 0 n B =B 0 p p 0n (4)and is accounted for,by introducing two more parameters:the power exponent n and the reference effective mean normal stress p 0.c.Yield and failure parameters :these parameters describe the position a i ,size M i and plastic modulus H i ,corresponding to each yield surface f i ,i =0,1,...n .For the case of pressure sensitive materials,a modified hyperbolic expression proposed by Prevost (1989)and Griffiths and Prévost (1990)is used to simulate soil stress–strain relations.The necessary parameters are:(i)the initial gradient,given by the small strain shear modulus G 0,and (ii)the stress (function of the friction angle at failure ϕand the stress path)and strain,εmax de v ,levels at failure.Hayashi et al.(1992)improved the modified hyperbolic model by introducing a new parameter—a —depending on the maximum grain size D max and uniformity coefficient C u .Finally,the coefficient of lateral stress K 0is necessary to evaluate the initial positions a i of the yield surfaces.d.Dilation parameters :these are used to evaluate the volumetric part of the plastic potentialand consist of:(i)the dilation (or phase transformation)angle ¯ϕ,and (ii)the dilation parameter X pp ,which is the scale parameter for the plastic dilation,and depends basically on relative density and sand type (fabric,grain size).With the exception of the dilation parameter,all the required constitutive model parameters are traditional soil properties,and can be derived from the results of conventional laboratory 123Table1Constitutive model parameters used in method3Number of yield surfaces20Power exponent n0.5Shear modulus G at stress p1 (kPa)75,000Bulk modulus at stress p1(kPa)200,000Unit massρ(t.m−3) 1.63Cohesion0 Reference mean normal stressp1(kPa)100Lateral stress coefficient(K0)0.5Dilation angle in compression (◦)31Dilation angle in extension(◦)31Ultimate friction angle in compression(◦)41.8Ultimate friction angle inextension(◦)41.8Dilation parameter X pp 1.65Max shear strain incompression0.08Max shear strain in extension0.08Generation coefficient in compressionαc 0.098Generation coefficient inextensionαe0.095Generation coefficient in compressionαlc 0.66Generation coefficient inextensionαle0.66Generation coefficient in compressionαuc 1.16Generation coefficient inextensionαue1.16(e.g.triaxial,simple shear)and in situ(e.g.cone penetration,standard penetration,wave velocity)soil tests.The dilational parameter can be evaluated on the basis of results of liquefaction strength analysis,when available;further details can be found in Popescu and Prevost(1995)and Popescu(1995).Since in the present study the sand material is dry,the cohesionless material was modeled as a one-phase material.Therefore neither the soil porosity,n w,nor the permeability,k,are needed.For the shear stress–strain curve generation,given the maximum shear modulus G1,the maximum shear stressτmax and the maximum shear strainγmax,the following functional relationship has been chosen:For y=τ/τmax and x=γ/γr,withγr=τmax/G1,then:y=exp(−ax)f(x,x l)+(1−exp(−ax))f(x,x u)where:f(x,x i)=(2x/x i+1)x i−1/(2x/x i+1)x i+1(5)where a,x l and x u are material parameters.For further details,the reader is referred to Hayashi et al.(1992).The constitutive model is implemented in the computer code DYNAFLOW(Prevost1981) that has been used for the numerical analyses.3.3.4Calibration of model constitutive parametersTo calibrate the values of the constitutive parameters,numerical triaxial tests were simulated with DYNAFLOW at three different confining pressures(30,60,90kPa)and compared with the results of available physical tests conducted on the same material at the same confining pressures.The parameters are defined based on the shear stress versus axial strain curve and volumetric strain versus axial strain curve.Figure8illustrates the comparisons between numerical simulations and physical tests in terms of volumetric strain and shear stress versus123Table2Summary of main attributes of the centrifuge model testsTest Faulting B(m)q(kPa)s(m)g-Level a D r(%)H(m)L(m)W(m)h max(m) 12Normal Free—field11560.224.775.723.53.1528Reverse Free—field11560.815.175.723.52.5914Normal10912.911562.524.675.723.52.4929Reverse10919.211564.115.175.723.53.30a Centrifugal accelerationFig.9Test12—Free-field faultD r=60%Fontainebleau sand(α=60◦):Comparison ofnumerical with experimentalvertical displacement of thesurface for bedrock dislocationh=3.0m(Method1)and2.5m(Method2)[all displacements aregiven in prototype scale]Structure Interaction(FR-SFSI):(i)Test14,normal faulting at60◦;and(ii)Test29,reverse faulting at60◦.In this case,the comparison is conducted for all of the developed numerical analysis approaches.The main attributes of the four centrifuge model tests used for the comparisons are syn-opsised in Table2,while more details can be found in Bransby et al.(2008a,b).4.1Free-field fault rupture propagation4.1.1Test12—normal60◦This test was conducted at115g on medium-loose(D r=60%)Fontainebleau sand,simu-lating normal fault rupture propagation through an H=25m soil deposit.The comparison between analytical predictions and experimental data is depicted in Fig.9in terms of vertical displacement y at the ground surface.All displacements are given in prototype scale.While the analytical prediction of Method1is compared with test data for h=3.0m,in the case of Method2the comparison is conducted at slightly lower imposed bedrock displacement: h=2.5m.This is due to the fact that the numerical analysis with Method2was conducted without knowing the test results,and at that time it had been agreed to set the maximum displacement equal to h max=2.5m.However,when test results were publicised,the actually attained maximum displacement was larger,something that was taken into account in the analyses with Method1.As illustrated in Fig.9,Method2predicts almost correctly the location of fault out-cropping,at about—10m from the“epicenter”,with discrepancies limited to1or2m.The deformation can be seen to be slightly more localised in the centrifuge test,but the comparison between analytical and experimental shear zone thickness is quite satisfactory.The vertical displacement profile predicted by Method1is also qualitatively acceptable.However,the123Method 2Centrifuge Model TestR1S1Method 1(a )(b)(c)Fig.10Test 12—-Normal free-field fault rupture propagation through H =25m D r =60%Fontainebleau sand:Comparison of (a )Centrifuge model test image,compared to FE deformed mesh with shear strain contours of Method 1(b ),and Method 2(c ),for h =2.5mlocation of fault rupture emergence is a few meters to the left compared with the experimen-tal:at about 15m from the “epicenter”(instead of about 10m).In addition,the deformation predicted by Method 1at the ground surface computed using method 1is widespread,instead of localised at a narrow band.FE deformed meshes with superimposed shear strain contours are compared with an image from the experiment in Fig.10,for h =2.5m.In the case of Method 2,the comparison can be seen to be quite satisfactory.However,it is noted that the secondary rupture (S 1)that forms in the experiment to the right of the main shear plane (R 1)is not predicted by Method 2.Also,experimental shear strain contours (not shown herein)are a little more diffuse than the FE prediction.Overall,the comparison is quite satisfactory.In the case of Method 1,the quantitative details are not in satisfactory agreement,but the calculation reveals a secondary rupture to the right of the main shear zone,consistent with the experimental image.4.1.2Test 28—reverse 60◦This test was also conducted at 115g and the sand was of practically the same relative density (D r =61%).Given that reverse fault ruptures require larger normalised bedrock123Fig.11Test28—Reversepropagation through H=15mD r=60%Fontainebleau sand:Comparison of numerical withexperimental verticaldisplacement of the surface forbedrock dislocation h=2.0m(all displacements are given inprototype scale)displacement h/H to propagate all the way to the surface(e.g.Cole and Lade1984;Lade et al.1984;Anastasopoulos et al.2007;Bransby et al.2008b),the soil depth was set at H=15m.This way,a larger h/H could be achieved with the same actuator.Figure11compares the vertical displacement y at the ground surface predicted by the numerical analysis to experimental data,for h=2.0m.This time,both models predict correctly the location of fault outcropping(defined as the point where the steepest gradient is observed).In particular,Method1achieves a slightly better prediction of the outcropping location:−10m from the epicentre(i.e.,a difference of1m only,to the other direction). Method2predicts the fault outbreak at about−7m from the“epicenter”,as opposed to about −9m of the centrifuge model test(i.e.,a discrepancy of about2m).Figure12compares FE deformed meshes with superimposed shear strain contours with an image from the experiment,for h=2.5m.In the case of Method2,the numerical analysis seems to predict a distinct fault scarp,with most of the deformation localised within it.In contrast,the localisation in the experiment is clearly more intense,but the fault scarp at the surface is much less pronounced:the deformation is widespread over a larger area.The analysis with Method1is successful in terms of the outcropping location.However,instead of a single rupture,it predicts the development of two main ruptures(R1and R2),accompanied by a third shear plane in between.Although such soil response has also been demonstrated by other researchers(e.g.Loukidis and Bouckovalas2001),in this case the predicted multiple rupture planes are not consistent with experimental results.4.2Interaction with strip footingsHaving validated the effectiveness of the developed numerical analysis methodologies in simulating fault rupture propagation in the free-field,we proceed to the comparisons of experiments with strip foundations:one for normal(Test14),and one for reverse(Test29) faulting.This time,the comparison is extended to all three methods.4.2.1Test14—normal60◦This test is practically the same with the free-field Test12,with the only difference being the presence of a B=10m strip foundation subjected to a bearing pressure q=90kPa.The foundation is positioned so that the free-field fault rupture would emerge at distance s=2.9m from the left edge of the foundation.123。
fault-tolerant的中文 -回复

fault-tolerant的中文-回复题目:faulttolerant的中文意思及其应用领域的探讨引言:现如今,随着信息技术的高速发展,各行各业对于系统的可靠性要求越来越高。
而faulttolerant作为一种重要的技术手段,在信息领域扮演着重要的角色。
本文将着重探讨faulttolerant的中文意思以及其在不同领域的应用。
第一部分:faulttolerant的中文意思faulttolerant一词源于英文,fault意为“故障”,tolerant则是“容忍”的意思。
结合起来,faulttolerant可以翻译为“容错”或者“故障容忍”。
它指的是一种系统或设备在发生故障时,仍然保持运行,并且不会对整体系统的正常工作产生影响。
第二部分:faulttolerant的应用领域1.计算机科学领域:在计算机科学领域,faulttolerant技术被广泛应用于操作系统、数据库系统、网络通信等方面。
一些关键性的任务,比如银行交易、航空航天系统和核能系统等都需要高度的容错性,以确保任何故障都不会导致系统瘫痪或数据损失。
2.云计算与大数据领域:随着云计算和大数据应用的迅速发展,对于系统的可靠性要求也越来越高。
在这些领域中,faulttolerant被广泛使用以确保系统的高可用性。
例如,分布式存储系统和分布式计算框架通常采用冗余数据和备份策略,以应对节点故障和数据丢失的情况。
3.网络和通信领域:在网络和通信领域,faulttolerant技术用于保证数据的可靠传输。
例如,通过使用冗余的网络链路或路由协议,可以避免单个链路或节点的故障对整个网络的影响。
此外,还有许多基于容错技术的通信协议被应用于提高通信的可靠性。
4.工业自动化领域:在工业自动化领域,faulttolerant技术可应用于保证生产过程的持续运行。
通过使用冗余的传感器、执行器和数据采集设备,可以在故障发生时快速切换到备用设备,避免生产中断和设备损坏。
国际工程承包和管理实务英语_西南交通大学中国大学mooc课后章节答案期末考试题库2023年
国际工程承包和管理实务英语_西南交通大学中国大学mooc课后章节答案期末考试题库2023年1.Which of the following can best demonstrate the recommended sequence ofdisputes events in 1999 FIDIC Red Book?答案:The Engineer => DAB => Amicable Settlement => Arbitration2.What is not required in the exchanges of project correspondence?答案:Description of personal emotions in letters3.我们应以何种心态对待异域文化?答案:假定对方与自己的想法、判断和价值有一定差异4.根据文化的冰山模型,以下哪一项属于文化的深层结构?答案:信仰系统5.在国际工程项目管理工作中,跨文化沟通应该是的工作?答案:全体项目人员6.Why is it necess ary to include project name, reference number, and meeting’stopic at the beginning of a decision memorandum?答案:For filing and retrieval convenience7.“中标函”is translated as in English.答案:Letter of Acceptance8.Which document is a part of the Tender Documents?答案:Form of Tender/Letter of Tender9.Which of the following term is not correctly translated?答案:Tender Bond –投标函10.Which of the following is not the stylistic characteristic prominent in theEnglish for international construction engineering and management?答案:Application of rhetorical devices11.Turnkey Contract is also referred as .答案:EPC Contract12.Normally, which party shall design, execute and complete the works, andremedy the defects arising thereof in a EPC contract?答案:The Contractor13.以下哪一项不利于国际工程管理中的跨文化沟通?答案:坚信冲突对项目是百害而无一利的14.In the 1999 FIDIC Red Book, the Contractor shall give to the Engineer thenotice of a claim not later than _____ after he became aware (or should have become aware) of the event or circumstance giving rise to the claim.答案:28 days15.The Employer’s general obligations do not include .答案:The duty to Construct16.Normally, which party signs the contract with a sub-contractor?答案:The General Contractor17.Which statement about the Engineer is not true?答案:The Engineer is appointed and paid for by both the Employer and the Contractor.18.“工程量清单” is the Chinese translation for .答案:Bill of Quantities19.In general, the stages of project delivery/procurement does not include .答案:The Design Stage20.高语境文化具有的特点是 .答案:交流信息含蓄委婉,字面意思下通常还有隐含的意义21.The contractor may claim for .答案:Extension of Time22.Which of the following marks the beginning of the construction stage?答案:Mobilization and Commencement of Work23.Generally speaking, prequalification is a part of in international projectdelivery/procurement.答案:The Tendering Stage24.Which statement about the “Contract” in international engineering project isnot true?答案:It does not include the technical documents such as the specification and the drawings.25.Normally, the Contractor’s responsibilities do not include .答案:Determine the feasibility of constructing a project.26.Which of the following is not a case of nominalization?答案:To submit the tender27.In general, the stages of project delivery/procurement do not include答案:The Design Stage28.非限定动词的形式主要包括。
Switchtec PSX Gen 4 可编程 PCIe 交换机系列说明书
Switchtec TM PSX Gen 4 Programmable PCIe® Switch Family PM41100, PM41084, PM41068, PM41052, PM41036, PM41028FeaturesHigh-Performance Non-Blocking Gen 4 Switches• 100-lane, 84-lane, 68-lane, 52-lane, 36-lane and 28-lane variants• Ports bifurcate to x11/x2/x4/x8/x16 lanes• Up to 48 NTBs assignable to any port• Logical Non-Transparent (NT) interconnect allows for larger topologies (up to 256 masters)• Supports 1+1 and N+1 failover mechanisms• NT address translation using direct windows and multiple sub-windows per BAR• Supports multicast groups per portDMA Controller• High-performance, ultra-low latency cut-through DMA engine• Up to 64 DMA channels1 x1 natively on four lanes Error Containment• Advanced Error Reporting (AER) on all ports• Downstream Port Containment (DPC) on all downstream ports• Completion Timeout Synthesis (CTS) to prevent an error state in an upstream host due to incomplete non-posted transactions• Upstream Error Containment (UEC), a programmable feature that prevents errors from propagating upstream • Hot- and surprise-plug controllers per port• GPIOs configurable for different cable/connector standardsDiagnostics and Debug• Transaction Layer Packet (TLP) generator for testing and debugging of links and error handling• Real-time eye capture• External loopback capability• Errors, statistics, performance and TLP latency counters PCIe Interfaces• Passive, managed and optical cables• SFF-8644, SFF-8643, SFF-8639, OCuLink and other connectors • SHPC-enabled slot and edge connectorsThe Microchip name and logo and the Microchip logo are registered trademarks and Switchtec is a trademark of MicrochipTechnology Incorporated in the U.S.A. and other countries. All other trademarks mentioned herein are property of their respective companies.© 2021, Microchip Technology Incorporated. All Rights Reserved. 7/21 DS00002867FHighlights• High-reliability PCIe: robust error containment, hot- andsurprise-plug controllers per port, end-to-end dataintegrity protection, ECC protection on RAMs, high-quality, low-power SERDES• PSX Software Development Kit (SDK): enables customer-differentiated solutions in areas such as error contain -ment and surprise-plug• Integrated enclosure management processor, I/O in-terfaces, and SDK for enclosure management firmware development• Comprehensive diagnostics and debugging: PCIe genera-tor and analyzer, per-port performance and error coun-ters, multiple loopback modes and real-time eye capture •Significant power, cost and board space savings with support for:• Up to 52 ports, 48 NTBs, and 26 virtual switch parti-tions• Flexible x11, x2, x4, x8, and x16 port bifurcation with no restrictions on configuring ports as either up -stream or downstream, or on mapping ports to NTBs •NVMe-MI enclosure management:• Integrated NVMe controller• In-band management supporting SES and native NVMe enclosure management stack• Out-of-band management supporting MCTP through I 2C•Secure system solution with boot image authenticationPeripheral I/O Interfaces• Up to 11 Two-Wire Interfaces (TWIs) with SMBus support • Up to 4 SFF-8485-compliant SGPIO ports • Up to 103 GPIO pins• 10/100 Ethernet MAC port (MII/RMII) (PSX 100x/84x/68xG4)• 16-bit parallel local bus interface with ECC protection • Up to 4 UARTs•JTAG and EJTAG interfaceHigh-Speed I/O• PCIe Gen 4 16 GT/s• Supports PCIe-compliant link training and manual PHY configuration•Manual PHY configuration for opticalPower Management• Active State Power Management (ASPM)• Software-controlled power managementChipLink Diagnostic Tools• Extensive debug, diagnostics, configuration and analysis tools with an intuitive GUI• Access to configuration data, management capabilities and signal integrity analysis tools (such as real-time eye capture)•Connects to device over in-band PCIe or sideband signals (UART, TWI and EJTAG)Evaluation KitThe PM42100-KIT Switchtec Gen 4 PCIe Switch Evaluation Kit is a device evaluation environment that supports multiple interfaces.Example Application1x1 natively on four lanes。
ECE_95
ORIGINAL :UNITED NATIONS of July 20, 1995E/ECE/324 )Rev.1/Add.94/Amend.4/Corr.1E/ECE/TRANS/505 )February 21, 2005STATUS OF UNITED NATIONS REGULATIONECE 95UNIFORM PROVISIONS CONCERNING THE APPROVAL OF:VEHICLES WITH REGARD TO THE PROTECTION OF THEOCCUPANTS IN THE EVENT OF A LATERAL COLLISIONIncorporating:00 series of amendments Date of Entry into Force: 06.07.95 Corr. 2 to 00 series of amendments Date of Entry into Force: 10.03.95 01 series of amendments Date of Entry into Force: 12.08.98 Supplement 1 to the 01 series of amendments Date of Entry into Force: 14.11.99 Corr. 1 to the 01 series of amendments Date of Entry into Force: 08.11.00 Corr. 3 to the 00 series of amendments Date of Entry into Force: 26.06.02 02 series of amendments Date of Entry into Force: 16.07.03 Supplement 1 to the 02 series of amendments Date of Entry into Force: 12.08.04ORIGINAL :UNITED NATIONS of July 20, 1995 E/ECE/324)E/ECE/TRANS/505 )Rev.1/Add.94/Amend.4/Corr.1February 21, 2005TITLE:Lateral Collision ProtectionISSUE:3 Regulation No. 95Mar/2005PAGE: IUNITED NATIONS AGREEMENTCONCERNING THE ADOPTION OF UNIFORM TECHNICAL PRESCRIPTIONS FOR WHEELED VEHICLES, EQUIPMENT AND PARTS WHICH CAN BE FITTED AND/OR BE USED ON WHEELED VEHICLES AND THE CONDITIONS FOR RECIPROCAL RECOGNITION OFAPPROVALS GRANTED ON THE BASIS OF THESE PRESCRIPTIONS(*)(Revision 2, including the amendments which entered into force on October 16, 1995)Addendum 94: Regulation No. 95Amendment 4 ErratumUNIFORM PROVISIONS CONCERNING THE APPROVAL OF VEHICLES WITH REGARD TO THEPROTECTION OF THE OCCUPANTS IN THE EVENT OF A LATERAL COLLISION(*)Former title of the Agreement:Agreement Concerning the Adoption of Uniform Conditions of Approval and Reciprocal Recognition of Approval for Motor Vehicle Equipment and Parts, done at Geneva on March 20, 1958.ORIGINAL :UNITED NATIONS of July 20, 1995REGULATION NO. 95UNIFORM PROVISIONS CONCERNING THE APPROVAL OF VEHICLES WITH REGARD TO THE PROTECTION OF THE OCCUPANTS IN THE EVENT OF A LATERAL COLLISIONCONTENTSREGULATION1. Scope2. Definitions3. Application for approval4. Approval5. Specifications and tests6. Modification of the vehicle type7. Conformity of production8. Penalties for non-conformity of production9. Production definitely discontinued10. Transitional provisions11. Names and addresses of technical services responsible for conducting approval tests, and ofadministrative departmentsANNEXESAnnex 1 - Communication concerning the approval or extension or refusal or withdrawal of approval or production definitely discontinued of a vehicle type with regard to protection of occupants inthe event of a lateral collision, pursuant to Regulation No. 95Annex 2 - Arrangements of the approval markAnnex 3 -Procedure for determining the "H" Point and the actual torso angle for seating positions in motor vehiclesAppendix 1 -Description of the three dimensional "H" Point machine (3-D H machine)Appendix 2 -Three dimensional reference systemAppendix 3 -Reference data concerning seating positionsAnnex 4 -Collision test procedureAppendix 1 -Determination of performance dataAppendix 2 -The procedure for calculating the viscous criterion for EUROSID 1 TITLE:Lateral Collision Protection ISSUE:1 Regulation No. 95Oct/2003PAGE: IIORIGINAL :UNITED NATIONS of July 20, 1995REGULATION NO. 95Annex 5 -Mobile deformable barrier characteristicsAppendix 1 - Force-deflection curves for static testsAppendix 2 - Force-deflection curves for dynamic testsAnnex 6 -Technical description of the side impact dummyAnnex 7 -Installation of the side impact dummyAnnex 8 -Partial testTITLE:Lateral Collision Protection ISSUE:1 Regulation No. 95Oct/2003PAGE: IIIORIGINAL :UNITED NATIONS of July 20, 1995REGULATION NO. 951.SCOPEThis Regulation applies to the lateral collision behaviour of the structure of the passengercompartment of M1 and N1 categories of vehicles where the R Point of the lowest seat is notmore than 700 mm from ground level when the vehicle is in the condition corresponding to thereference mass defined in Paragraph 2.10. of this Regulation.2.DEFINITIONSFor the purposes of this Regulation:2.1."Approval of a vehicle" means the approval of a vehicle type with regard to the behaviour ofthe structure of the passenger compartment in a lateral collision;2.2."Vehicle type"means a category of power-driven vehicles which do not differ in suchessential respects as:2.2.1.the length, width and ground clearance of the vehicle, in so far as they have a negative effecton the performance prescribed in this Regulation;2.2.2.the structure, dimensions, lines and materials of the side walls of the passenger compartmentin so far as they have a negative effect on the performance prescribed in this Regulation;2.2.3.the lines and inside dimensions of the passenger compartment and the type of protectivesystems, in so far as they have a negative effect-on the performance prescribed in thisRegulation;2.2.4.the siting of the engine (front, rear or centre);2.2.5.the unladen mass, in so far as there is a negative effect on the performance prescribed in thisRegulation;2.2.6.the optional arrangements or interior fittings in so far as they have a negative effect on theperformance prescribed in this Regulation;2.2.7.the type of front seat(s) and position of the "R" Point in so far as they have a negative effecton the performance prescribed in this Regulation;2.3."Passenger compartment" means the space for occupant accommodation, bounded by theroof, floor, side walls, doors, outside glazing and front bulkhead and the plane of the rearcompartment bulkhead or the plane of the rear-seat back support;2.4."R Point" or "seating reference point" means the reference point specified by the vehiclemanufacturer which:2.4.1.has co-ordinates determined in relation to the vehicle structure;2.4.2.corresponds to the theoretical position of the point of torso/thighs rotation (H Point) for thelowest and most rearward normal driving position or position of use given by the vehiclemanufacturer for each seating position specified by him;TITLE:Lateral Collision Protection ISSUE:1 Regulation No. 95Oct/2003PAGE: 1ORIGINAL :UNITED NATIONS of July 20, 19952.5."H Point" is as established by Annex 3 to this Regulation;2.6."Capacity of the fuel tanks" means the fuel-tank capacity as specified by the manufacturerof the vehicle;2.7."Transverse plane" means a vertical plane perpendicular to the median longitudinal verticalplane of the vehicle;2.8."Protective system" means devices intended to restrain and/or protect the occupants;2.9."Type of protective system" means a category of protective devices which do not differ insuch essential respects as their:technologygeometryconstituent materials;2.10."Reference mass" means the unladen mass of the vehicle increased by a mass of 100 kg(that is the mass of the side impact dummy and its instrumentation);2.11."Unladen mass" means the mass of the vehicle in running order without driver, passengersor load, but with the fuel tank filled to 90% of its capacity and the usual set of tools and sparewheel on board, where applicable;2.12."Mobile deformable barrier" means the apparatus with which the test vehicle is impacted. Itconsists of a trolley and an impactor;2.13."Impactor" means a crushable section mounted on the front of mobile deformable barrier;2.14."Trolley"means a wheeled frame free to travel along its longitudinal axis at the point ofimpact. Its front supports the impactor.3.APPLICATION FOR APPROVAL3.1.The application for approval of a vehicle type with regard to the protection of the occupants inthe event of a lateral collision shall be submitted by the vehicle manufacturer or by his dulyaccredited representative.3.2.It shall be accompanied by the undermentioned documents in triplicate and the followingparticulars:3.2.1. a detailed description of the vehicle type with respect to its structure, dimensions, lines andconstituent materials;3.2.2.photographs and/or diagrams and drawings of the vehicle showing the vehicle type in front,side and rear elevation and design details of the lateral part of the structure;3.2.3.particulars of the vehicle's mass as defined by Paragraph 2.11. of this Regulation;3.2.4.the lines and inside dimensions of the passenger compartment;3.2.5. a description of the relevant side interior fittings and protective systems installed in thevehicle.TITLE:Lateral Collision Protection ISSUE:1 Regulation No. 95Oct/2003PAGE: 2ORIGINAL :UNITED NATIONS of July 20, 1995 TITLE:Lateral Collision ProtectionISSUE:1 Regulation No. 95Oct/2003PAGE: 33.3.The applicant for approval shall be entitled to present any data and results of tests carried out which make it possible to establish that compliance with the requirements can be achieved on prototype vehicles with a sufficient degree of accuracy.3.4. A vehicle which is representative of the type to be approved shall be submitted to the technical service responsible for conducting the approval tests.3.4.1.A vehicle not comprising all the components proper to the type may be accepted for tests provided that it can be shown that the absence of the components omitted has no detrimental effect on the performance prescribed in the requirements of this Regulation.3.4.2. It shall be the responsibility of the applicant for approval to show that the application of Paragraph 3.4.1 is in compliance with the requirements of this Regulation. 4.APPROVAL4.1. If the vehicle type submitted for approval pursuant to this Regulation meets the requirements of Paragraph 5 below, approval of that vehicle type shall be granted.4.2.In case of doubt, account shall be taken, when verifying the conformity of the vehicle to the requirements of this Regulation, of any data or test results provided by the manufacturer which can be taken into consideration in validating the approval test carried out by the technical service.4.3.An approval number shall be assigned to each type approved. Its first two digits (at present 01 corresponding to the 01 series of amendments) shall indicate the series of amendments incorporating the most recent major technical amendments made to the Regulation at the time of issue of the approval. The same Contracting Party may not assign the same approval number to another vehicle type.4.4.Notice of approval or of extension or of refusal of approval of a vehicle type pursuant to this Regulation shall be communicated by the Parties to the Agreement applying this Regulation by means of a form conforming to the model in Annex l to this Regulation and photographs and/or diagrams and drawings supplied by the applicant for approval, in a format not exceeding A4 (210 x 297) mm or folded to that format and on an appropriate scale.4.5.There shall be affixed to every vehicle conforming to a vehicle type approved under this Regulation, conspicuously and in a readily accessible place specified on the approval form, an international approval mark consisting of:4.5.1.a circle surrounding the Letter "E" followed by the distinguishing number of the country whichhas granted approval;(1)(1)1 for Germany,2 for France,3 for Italy,4 for the Netherlands,5 for Sweden,6 for Belgium,7 for Hungary,8 for the Czech Republic,9 for Spain, 10 for Yugoslavia, 11 for the United Kingdom, 12 for Austria, 13 for Luxembourg, 14 for Switzerland, 15 (vacant), 16 for Norway, 17 for Finland, 18 for Denmark, 19 for Romania, 20 for Poland, 21 for Portugal, 22 for the Russian Federation, 23 for Greece, 24 for Ireland, 25 for Croatia, 26 for Slovenia, 27 for Slovakia, 28 for Belarus, 29 for Estonia, 30 (vacant), 31 for Bosnia and Herzegovina, 32 for Latvia, 33 (vacant), 34 for Bulgaria, 35-36 (vacant), 37 for Turkey, 38-39 (vacant), 40 for The former Yugoslav Republic of Macedonia, 41 (vacant), 42 for the European Community (Approvals are granted by its Member States using their respective ECE symbol), 43 for Japan, 44 (vacant), 45 fort Australia and 46 for Ukraine. Subsequent numbers shall be assigned to other countries in the chronological order in which they ratify the Agreement Concerning the Adoption of Uniform Technical Prescriptions for Wheeled Vehicles, Equipment and Parts which can be Fitted and/or be Used on Wheeled Vehicles and the Conditions of for Reciprocal Recognition of Approvals Granted on the Basis of these Prescriptions for Motor Vehicle Equipment and Parts, or in which they accede to that Agreement, and the numbers thus assigned shall be communicated by the Secretary-General of the United Nations to the Contracting Parties to the Agreement.ORIGINAL :UNITED NATIONS of July 20, 1995 TITLE:Lateral Collision ProtectionISSUE:1 Regulation No. 95Oct/2003PAGE: 44.5.2. the number of this Regulation, followed by the Letter "R", a dash and the approval number, to the right of the circle prescribed in Paragraph 4.5.1.4.6.If the vehicle conforms to a vehicle type approved, under one or more other Regulations Annexed to the Agreement, in the country which has granted approval under this Regulation, the symbol prescribed in Paragraph 4.5.1. need not be repeated; in this case the Regulation and approval numbers and the additional symbols of all the Regulations under which approval has been granted in the country which has granted approval under this Regulation shall be placed in vertical columns to the right of the symbol prescribed in Paragraph 4.5.1. 4.7. The approval mark shall be clearly legible and shall be indelible.4.8. The approval mark shall be placed close to or on the vehicle data plate affixed by the manufacturer.4.9. Annex 2 to this Regulation gives examples of approval marks.5.SPECIFICATIONS AND TESTS5.1. The vehicle shall undergo a test in accordance with Annex 4 to this Regulation.5.1.1.The test will be carried out on the driver's side unless asymmetric side structures, if any, are so different as to affect the performance in a side impact. In that case either of the alternatives in Paragraph 5.1.1.1. or 5.1.1.2. may be used by agreement between the manufacturer and test authority.5.1.1.1.The manufacturer will provide the authority responsible for approval with information regarding the compatibility of performances in comparison with the driver's side when the test is being carried out on that side.5.1.1.2. The approval authority, if concerned as to the construction of the vehicle, will decide to have the test performed on the side opposite the driver, this being considered the least favourable. 5.1.2.The Technical Service, after consultation with the manufacturer, may require the test to be carried out with the seat in a position other than the one indicated in Paragraph 5.5.1. ofAnnex 4. This position shall be indicated in the test report.(1)5.1.3.The result of this test shall be considered satisfactory if the conditions set out in Paragraphs 5.2. and 5.3. below are satisfied.(1)Until September 30, 2000, for the purposes of the test requirements, the range of normal longitudinal adjustments shall be limited such that the H-point lies within the length of the door aperture.ORIGINAL :UNITED NATIONS of July 20, 19955.2.Performance criteria5.2.1.The performance criteria, as determined for the collision test in accordance with the Appendixto Annex 4 to this Regulation shall meet the following conditions:5.2.1.1. the head performance criterion (HPC) shall be less than or equal to 1,000; when there is nohead contact, then the HPC shall not be measured or calculated but recorded as "No HeadContact."5.2.1.2. the thorax performance criteria shall be:(a) Rib Deflection Criterion (RDC) less than or equal to 42 mm;(b) Soft Tissue Criterion (VC) less or equal to 1.0 m/sec.For a transitional period of two years after the date specified in Paragraph 10.2. of thisRegulation the V * C value is not a pass/fail criterion for the approval testing, but this valuehas to be recorded in the test report and to be collected by the approval authorities. After thistransitional period, the VC value of 1.0 m/sec shall apply as a pass/fail criterion unless theContracting Parties applying this Regulation decide otherwise.5.2.1.3. the pelvis performance criterion shall be:Pubic Symphysis Peak Force (PSPF) less than or equal to 6 kN.5.2.1.4. the abdomen performance criterion shall be:Abdominal Peak Force (APF) less than or equal to 2.5 kN internal force (equivalent to externalforce of 4.5 kN).5.3.Particular Requirements5.3.1.No door shall open during the test.5.3.2.After the impact, it shall be possible without the use of tools to:5.3.2.1 open a sufficient number of doors provided for normal entry and exit of passengers, and ifnecessary tilt the seat-backs or seats to allow evacuation of all occupants;5 3.2.2. release the dummy from the protective system;5.3.2.3. remove the dummy from the vehicle;5.3.3.no interior device or component shall become detached in such a way as noticeably toincrease the risk of injury from sharp projections or jagged edges;5.3.4.ruptures, resulting from permanent deformation are acceptable, provided these do notincrease the risk of injury;5.3.5.if there is continuous leakage of liquid from the fuel-feed installation after the collision, the rateof leakage shall not exceed 30 g/min; if the liquid from the fuel-feed system mixes with liquidsfrom the other systems and the various liquids cannot easily be separated and identified, allthe liquids collected shall be taken into account in evaluating the continuous leakage. TITLE:Lateral Collision Protection ISSUE:1 Regulation No. 95Oct/2003PAGE: 5ORIGINAL :UNITED NATIONS of July 20, 19956.MODIFICATION OF THE VEHICLE TYPE6.1.Any modification affecting the structure, the number and type of seats, the interior trim orfittings, or the position of the vehicle controls or of mechanical parts which might affect theenergy-absorption capacity of the side of the vehicle, shall be brought to the notice of theadministrative department granting approval. The department may then either:6.1.1.consider that the modifications made are unlikely to have an appreciable adverse effect andthat in any case the vehicle still complies with the requirements, or6.1.2.require a further test report from the technical service responsible for conducting the tests;6.1.2.1. Any modification of the vehicle affecting the general form of the structure of the vehicle or anyvariation in the reference mass greater than 8% which in the judgement of the authority wouldhave a marked influence on the results of the test shall require a repetition of the test asdescribed in Annex 4.6.1.2.2. If the technical service, after consultation with the vehicle manufacturer, considers thatmodifications to a vehicle type are insufficient to warrant a complete retest then a partial testmay be used. This would be the case if the reference mass is not more than 8% differentfrom the original vehicle or the number of front seats is unchanged. Variations of seat type orinterior fittings need not automatically entail a full retest. An example of the approach to thisproblem is given in Annex 8.6.2.Confirmation or refusal of approval, specifying the alteration, shall be communicated by theprocedure specified in Paragraph 4.4. above to the Parties to the Agreement which apply thisRegulation.6.3.The competent authority issuing an extension of approval shall assign a series number toeach communication form drawn up for such an extension.7.CONFORMITY OF PRODUCTIONThe conformity of production procedures shall comply with those set out in the Agreement,Appendix 2 (E/ECE/324-E/ECE/TRANS/505/Rev.2), with the following requirements:7.1.Every vehicle approved under this Regulation shall be so manufactured as to conform to thetype approved by meeting the requirements set out in Paragraph 5 above.7.2.The holder of the approval shall ensure that for each type of vehicle at least the testsconcerning the taking of measurements are carried out.7.3.The authority which has granted type approval may at any time verify the conformity controlmethods applied in each production facility. The normal frequency of these verifications shallbe once every two years.TITLE:Lateral Collision Protection ISSUE:1 Regulation No. 95Oct/2003PAGE: 6ORIGINAL :UNITED NATIONS of July 20, 19958.PENALTIES FOR NON-CONFORMITY OF PRODUCTION8.1.The approval granted in respect of a vehicle type, pursuant to this Regulation, may bewithdrawn if the requirement laid down in Paragraph 7.1. above is not complied with, or if thevehicle or vehicles selected have failed to pass the checks prescribed in Paragraph 7.2.above.8.2.If a Contracting Party to the Agreement applying this Regulation withdraws an approval it haspreviously granted, it shall forthwith so notify the other Contracting Parties applying thisRegulation by means of a communication form conforming to the model in Annex 1 to thisRegulation.9.PRODUCTION DEFINITELY DISCONTINUEDIf the holder of the approval completely ceases to manufacturer a type of vehicle approved inaccordance with this Regulation, he shall so inform the authority which granted theapproval. Upon receiving the relevant communication that authority shall inform thereof theother Parties to the 1958 Agreement applying this Regulation by means of a communicationform conforming to the model in Annex 1 to this Regulation.10. TRANSITIONAL PROVISIONS10.1.As from the official date of entry into force of Supplement 1 to the 02 series of amendments,no Contracting Party applying this Regulation shall refuse to grant ECE approval under thisRegulation as amended by Supplement 1 to the 02 series of amendments.10.2.As from 12 months after the entry into force of the 02 series of amendments ContractingParties applying this Regulation shall grant ECE approvals only to those types of vehicleswhich comply with the requirements of this Regulation as amended by the 02 series ofamendments.10.3.As from 60 months after the entry into service of the 02 series of amendments ContractingParties applying this Regulation may refuse first national registration (first entry into service) ofvehicles which do not meet the requirements of this Regulation as amended by the 02 seriesof amendments.10.4.As from 36 months after the entry into force of Supplement 1 to the 02 series of amendmentsContracting Parties applying this Regulation shall grant ECE approvals only to those types ofvehicles which comply with the requirements of this Regulation, as amended by Supplement 1to the 02 series of amendments.10.5.As from 84 months after the entry into force of Supplement 1 to the 02 series of amendmentsContracting Parties applying this Regulation may refuse first national registration (first entryinto service) of vehicles which do not meet the requirements of this Regulation as amendedby Supplement 1 to the 02 series of amendments.S AND ADDRESSES OF TECHNICAL SERVICES RESPONSIBLE FORCONDUCTING APPROVAL TESTS, AND OF ADMINISTRATIVE DEPARTMENTSThe Contracting Parties to the Agreement applying this Regulation shall communicate to theUnited Nations secretariat the names and addresses of the technical services responsible forconducting approval tests, and of the administrative departments which grant approval and towhich forms certifying approval or extension, or refusal or withdrawal of approval, issued inother countries, are to be sent.TITLE:Lateral Collision Protection ISSUE:2 Regulation No. 95Oct/2004PAGE: 7ORIGINAL :UNITED NATIONS of July 20, 1995TITLE:Lateral Collision Protection ISSUE:2Regulation No. 95 Oct/2004PAGE: 8ANNEX 1(maximum format: A4 (210 x 297 mm))COMMUNICATIONissued by: Name of administration: (1) ............................................................................................................................................................concerning: (2) APPROVAL GRANTEDAPPROVAL EXTENDEDAPPROVAL REFUSEDAPPROVAL WITHDRAWNPRODUCTION DEFINITELY DISCONTINUEDof a vehicle type with regard to protection of occupants in the event of a lateral collision pursuant to Regulation No. 95Approval No. .....Extension No............. l.Trade name or mark of the power-driven vehicle ................................................................................ 2.Vehicle type ......................................................................................................................................... 3.Manufacturer's name and address ...................................................................................................... 4.If applicable name and address of manufacturer's representative ..................................................... 5.Vehicle submitted for approval on ....................................................................................................... 6.Side impact dummy utilized ES-1/ES-2. (2)7.Technical service responsible for conducting approval tests .............................................................. 8.Date of test report ................................................................................................................................ 9.Number of test report .......................................................................................................................... 10. Approval granted/refused/extended/withdrawn. (2) (1)Distinguishing number of the country which has granted/extended/refused/withdrawn approval (see approval provisions in the Regulation).(2)Strike out what does not apply.ORIGINAL :UNITED NATIONS of July 20, 199511. Position of approval mark on the vehicle.............................................................................................12. Place.....................................................................................................................................................13. Date......................................................................................................................................................14. Signature..............................................................................................................................................15. The list of documents deposited with the Administrative Service which has granted approval isAnnexed to this communication and may be obtained on request.TITLE:Lateral Collision Protection ISSUE:2 Regulation No. 95Oct/2004PAGE: 9ÝÑËÒÌÎÇ :E.C.E.© InterRegs Ltd 2004ÑÎ×Ù×ÒßÔ :UNITED NATIONS of July 20, 1995Ì×ÌÔÛæLateral Collision Protection ×ÍÍËÛæ1Regulation No. 95 Oct/2003ÐßÙÛæ 10ANNEX 2ARRANGEMENTS OF THE APPROVAL MARKMODEL AøÍ»» п®¿¹®¿°¸ ìòëò ±º ¬¸·-λ¹«´¿¬·±²÷ ̸» ¿¾±ª» ¿°°®±ª¿´ ³¿®µ ¿ºº·¨»¼ ¬± ¿ ª»¸·½´» -¸±©- ¬¸¿¬ ¬¸» ª»¸·½´» ¬§°» ½±²½»®²»¼ ¸¿-ô ©·¬¸ ®»¹¿®¼ ¬± ¬¸» °®±¬»½¬·±² ±º ¬¸» ±½½«°¿²¬- ·² ¬¸» »ª»²¬ ±º ¿ ´¿¬»®¿´ ½±´´·-·±²ô ¾»»² ¿°°®±ª»¼ ·² ¬¸» Ò»¬¸»®´¿²¼- øÛì÷ °«®-«¿²¬ ¬± λ¹«´¿¬·±² Ò±ò çëò ̸» ¿°°®±ª¿´ ²«³¾»® ·²¼·½¿¬»- ¬¸¿¬ ¬¸» ¿°°®±ª¿´ ©¿- ¹®¿²¬»¼ ·² ¿½½±®¼¿²½» ©·¬¸ ¬¸» ®»¯«·®»³»²¬- ±º λ¹«´¿¬·±² Ò±ò çë ¿- ¿³»²¼»¼ ¾§ ¬¸» ðï -»®·»- ±º ¿³»²¼³»²¬-òMODEL BøÍ»» п®¿¹®¿°¸ ìòêò ±º ¬¸·-λ¹«´¿¬·±²÷̸» ¿¾±ª» ¿°°®±ª¿´ ³¿®µ ¿ºº·¨»¼ ¬± ¿ ª»¸·½´» -¸±©- ¬¸¿¬ ¬¸» ª»¸·½´» ¬§°» ½±²½»®²»¼ ¸¿- ¾»»² ¿°°®±ª»¼ ·² ¬¸» Ò»¬¸»®´¿²¼- øÛì÷ °«®-«¿²¬ ¬± λ¹«´¿¬·±²- Ò±-ò çë ¿²¼ îì (1)øײ ¬¸» ½¿-» ±º ¬¸» ´¿¬¬»® λ¹«´¿¬·±²ô ¬¸» ¿¼¼·¬·±²¿´ -§³¾±´ ©¸·½¸ º±´´±©- ¬¸» λ¹«´¿¬·±² ²«³¾»® ·²¼·½¿¬»- ¬¸¿¬ ¬¸» ½±®®»½¬»¼ ¿¾-±®°¬·±² ½±ó»ºº·½·»²¬ ·- ïòíð ³óï÷ò ̸» º·®-¬ ¬©± ¿°°®±ª¿´ ²«³¾»®- ·²¼·½¿¬» ¬¸¿¬ ¿¬ ¬¸» ¼¿¬» ©¸»² ¬¸» ®»-°»½¬·ª» ¿°°®±ª¿´- ©»®» ¹®¿²¬»¼ô λ¹«´¿¬·±² çë ·²½±®°±®¿¬»¼ ¬¸» ðï -»®·»- ±º ¿³»²¼³»²¬- ¿²¼ λ¹«´¿¬·±² Ò±ò îì ·²½±®°±®¿¬»¼ ¬¸» ðí -»®·»- ±º ¿³»²¼³»²¬-ò øï÷̸» ´¿¬¬»® ²«³¾»® ·- ¹·ª»² ±²´§ ¿- ¿² »¨¿³°´»ò。
ARINC 625-1
QUALITY MANAGEMENT PROCESS FOR TEST PROCEDURE GENERATIONARINC REPORT 625-1PUBLISHED: OCTOBER 15, 1999AN DOCUMENTPrepared byAIRLINES ELECTRONIC ENGINEERING COMMITTEEPublished byAERONAUTICAL RADIO, INC.2551 RIVA ROAD, ANNAPOLIS, MARYLAND 21401Copyright© 1999 byAERONAUTICAL RADIO, INC.2551 Riva RoadAnnapolis, Maryland 21401-7465 USAARINC REPORT 625-1©QUALITY MANAGEMENT PROCESS FOR TEST PROCEDURE GENERATIONPublished: October 15, 1999Prepared by the Airlines Electronic Engineering CommitteeReport 625Adopted by the Airlines Electronic Engineering Committee:January 22, 1996 Report 625Adopted by the Industry: February 25, 1996Summary of Document SupplementsSupplement Adoption Date PublishedReport 625-1September 15, 1999October 15, 1999FOREWORDActivities of AERONAUTICAL RADIO, INC. (ARINC)and thePurpose of ARINC Reports and SpecificationsAeronautical Radio, Inc. is a corporation in which the United States scheduled airlines are the principal stockholders. Other stockholders include a variety of other air transport companies, aircraft manufacturers and non-U.S. airlines.Activities of ARINC include the operation of an extensive system of domestic and overseas aeronautical land radio stations, the fulfillment of systems requirements to accomplish ground and airborne compatibility, the allocation and assignment of frequencies to meet those needs, the coordination incident to standard airborne compatibility, the allocation and assignment of frequencies to meet those needs, the coordination incident to standard airborne communications and electronics systems and the exchange of technical information. ARINC sponsors the Airlines Electronic Engineering Committee (AEEC), composed of airline technical personnel. The AEEC formulates standards for electronic equipment and systems for the airlines. The establishment of Equipment Characteristics is a principal function of this Committee.It is desirable to reference certain general ARINC Specifications or Report which are applicable to more than one type of equipment. These general Specifications and Reports may be considered as supplementary to the Equipment Characteristics in which they are referenced. They are intended to set forth the desires of the airlines pertaining to components and general design, construction and test criteria, in order to insure satisfactory operation and the necessary interchangeability in airline service. The release of a Specification or Equipment Characteristics should not be construed to obligate ARINC or any airline insofar as the purchase of any components or equipment is concerned.An ARINC Report ( Specification or Characteristic) has a twofold purpose, which is:(1)To indicate to the prospective manufacturers of airline electronic equipment theconsidered opinion of the airline technical people, coordinated on an industry basis,concerning requisites of new equipment, and(2)To channel new equipment designs in a direction which can result in the maximumpossible standardization of those physical and electrical characteristics which influenceinterchangeability of equipment without seriously hampering engineering initiative.ii1.0INTRODUCTION1 1.1Overview1 1.2Background1 1.3Goals21.4Related Documents22.0ROLES AND RESPONSIBILITIES3 2.1Introduction3 2.2Airframe Manufacturer3 2.3LRU Manufacturer3 2.3.1TSDP Development Plan3 2.3.2Test Strategy and LRU Testability3 2.3.3Source Documentation3 2.3.4Scope of Return to Service Testing4 2.3.5Configuration Management4 2.3.6Source Documentation Updates4 2.3.7Problem Reporting System4 2.3.8Source Documentation Analysis4 2.4TPS Developer5 2.4.1TPS Development Plan5 2.4.1.1Design and Implementation5 2.4.1.2Verification and Validation5 2.4.1.3TPS Delivery6 2.4.2Quality Assurance Plan6 2.4.2.1Quality Records6 2.4.3Configuration Management Plan6 2.4.4TPS Sustaining Process6 2.5TPS User7 2.5.1Maintain TPS Integrity7 2.5.2Problem Reporting7 2.5.3TPS Conformance Checking7 2.5.4Acceptance of TPS7 2.5.5Configuration Control73.0TECHNICAL SUPPORT AND DATA PACKAGE8 3.1Introduction8 3.2LRU Manufacturer Supplied Data, Software, and Services8 3.2.1Data8 3.2.2Software9 3.2.3Services9 3.3Other Items (Outside TSDP)9 3.4Technical Support and Data Package Quality Attributes103.5The TSDP Checklist104.0TEST SPECIFICATION ATTRIBUTES11 4.1Introduction11 4.2General Requirements11 4.2.1Format11 4.2.2General Organization and Content11 4.2.2.1Configuration Preamble11 4.2.2.2Technical Preamble11 4.2.2.3Detailed Test Specification11 4.2.2.4Other Data11 4.2.3Content Requirements11 4.3Configuration Preamble Data11 4.3.1TS Configuration/Revision Information11 4.3.2Table of Contents11 4.3.3UUT Description12 4.3.4References12 4.4Technical Preamble12 4.4.1Test Strategy/General Information12 4.4.2Detailed UUT Performance Characteristics12 4.4.3Test Equipment Resource Requirements12 4.4.4Special Tool Requirements13 4.4.5Environmental Requirements13 4.4.6Test Vocabulary13 4.4.7Other Requirements13 4.4.8Non-Volatile Memory Requirements13 4.4.9Predefined Functions and Procedures13 4.5Detailed Test Specification13 4.5.1Detailed Test Information13iii4.5.2Detailed Test Requirement Criteria14 4.5.2.1Coverage14 4.5.2.2Purpose14 4.5.2.3Test Approach14 4.5.2.4Initial Conditions14 4.5.2.5Test Requirements14 4.6Test Specification Quality Attributes14 4.7Shop Verification of Test Specification14 4.8The TS Checklist155.0TPS QUALITY FACTORS AND ATTRIBUTES16 5.1Introduction16 5.2Correctness16 5.2.1Traceability Checklist16 5.2.2Safety Checklist16 5.2.3UUT/TUA/ATE Damage Protection16 5.2.4Consistency Checklist17 5.2.5Completeness Checklist17 5.2.6Functionality17 5.3Reliability18 5.3.1Robustness Checklist18 5.3.2Accuracy Checklist18 5.3.3Simplicity Checklist19 5.4Efficiency19 5.4.1Execution Time Checklist19 5.5Usability19 5.5.1Man-Machine Interface Checklist19 5.6Maintainability20 5.6.1Self-Descriptiveness Checklist20 5.6.2TUA Repairability Checklist216.0RECOMMENDED PROGRAMMING PRACTICE22 6.1Introduction22 6.1.1Purpose22 6.1.2Goals22 6.1.3Programming Practice Overview22 6.1.4Relationship Between TS and TPS22 6.2Test Program Development22 6.2.1The Benefits of a Standard Test Program Structure22 6.2.2Description of Operator Interface Procedures22 6.2.3Signal Oriented Procedures22 6.3Design Guidelines22 6.3.1Test Objectives22 6.3.2Preparation of Test Program Development23 6.3.3Proper Test Sequence23 6.3.4Test Program Maintainability23 6.3.4.1Configuration Control23 6.3.4.2Use of Commentary23 6.3.4.3Meaningful Labels23 6.3.4.4Test Organization23 6.3.4.5Data Conversion to Physical Units24 6.3.5Complete and Partial Test24 6.3.6Use of Entry Points24 6.3.7Diagnostics24 6.4Operator Interface24 6.4.1Operator Messages24 6.4.2PASS/FAIL Messages25 6.4.3Test Results Presentation Guideline25 6.4.4Long Test Executive Time257.0TPS CONFORMATION CHECKING PROCESS26 7.1Introduction26 7.2Framework26 7.2.1Error Correction26 7.3TPS Conformance Checking Segments26 7.3.1Phase I Conformance Check26 7.3.1.1Documentation Check26 7.3.1.2Resource Compliance26 7.3.1.3TPS Test Compliance27 7.3.1.4Safety Considerations27 7.3.1.5Deviations27iv7.3.1.6Implementation Details28 7.3.1.7Additional Tests28 7.3.2Phase II Conformance Check28 7.4Life Cycle Issues28 7.5Proof of Conformance28 7.5.1Conformance Checklist28 7.5.2Conformance Certificate29ATTACHMENTS1-1Glossary31-34 1-2TPS Process and Information Flow Diagram351-3Concurrent TPS Process and Information Flow Diagram361-4Data Package Requirements for Third Party ATE Development37-40 2Intentionally Left Blank413-1Technical Support and Data Package Checklist424-1Test Specification Quality Checklist43-49 5-1TPS Quality Checklist50-53 6-1Recommended Structure of TPS547-1Conformance Certificate557-2TPS Conformance Checklist56APPENDICESA Examples of Test Specification57-83B Example Test Specification Checklist84-91vARINC REPORT 625 - Page 1 1.0 INTRODUCTION1.1 OverviewThe purpose of this document is to provide a standard approach for quality management of Test Procedure Generation within the commercial air transport industry.This document defines the data, software, and services required to support development and maintenance of quality test solutions for aircraft components. These data, software, and services comprise the Technical Support and Data Package (TSDP). This document also provides a standard approach for defining a uniform quality management methodology for designing a Test Program Set (TPS) and a standard TPS Conformance Checking Process. A conformance certificate is defined that should be used as an industry standard.Refer to the glossary in Attachment 1-1 for definitions of terms.This document applies to Return-To-Service (RTS) testing and related processes including:ŸRoles and ResponsibilitiesŸTSDP ContentsŸTSDP Quality AttributesŸTPS Quality Factors and AttributesŸTPS ConformanceT he process as shown in Attachment 1-2 is divided into several phases. It shows the idealized flow of TPS development and update as an industrial process. There are standards and procedures defined to control the individual process elements of both a phase-dependent and phase -independent nature. These are shown on top of the TPS Process and Information Flow Diagram.A ll phases of the process are accompanied by quality assurance activities and associated quality records to generate a system of inherent control and monitoring. Quality records should be implemented in a suitable format to facilitate control in an unambiguous, complete, verifiable and consistent manner.A ttachment 1-3, the Concurrent TPS Process and Information Flow Diagram, is another representation of those processes identified in Attachment 1-2. This illustrates the phase dependent nature of a number of the processes when TPS development must be accomplished in conjunction with an airplane development program. In most instances, timely development of the desired TPS will depend on the successful implementation of the concurrent processes depicted.T he top block, labeled as Airframe Manufacturer, is representative of the airplane development process showing the various phases, from the initial definition, through the prototype, ground test, flight test, final development and delivery.T he LRU manufacturer block shows that the TPS development process is conducted multiple times as the design of the LRU evolves during the airframe development.T he TPS User and TPS Developer blocks shows how the original delivery and subsequent updates to the LRU data are used to support specific phases of the test procedure development effort. This figure represents multiple development efforts that may occur simultaneously.T he key to successful implementation of these concurrent processes is continuous flow of data between each party's processes, starting with the initial release of timely, but necessarily incomplete data, and finishing with a complete TSDP.A lthough this document is written with a heavy emphasis towards avionics and avionics ATE, the principals for a quality TPS and specification are applicable to all aircraft components that often need to be maintained beyond the life of the original test equipment, and also to manual tests.1.2 BackgroundTARINC 625 was to provide automatic test information in component maintenance manuals (CMMs) as test specifications written in ATLAS.A test specification, by definition, is a UUT-oriented, test-system-independent test description. It is not a test procedure. It is essential for a successful TPS quality management process to be based on the same test specifications that were used to develop the shop-verified test procedures contained in the CMMs.T esting of modern state-of-the-art avionics is often dependent on the utilization of built-in tests, external test data files, diagnostics/exercisers and other non-ATLAS test routines. Experience has shown that these essential parts of testing information were often missing and not even referenced in the ATLAS or CMMs.P rior to ARINC 625, there were no common guidelines for a quality management process for test procedure generation. This caused a severe quality problem for the aircraft manufacturer, equipment manufacturer, TPS developer, and finally, the airline user. In addition, it increased TPS cycle costs for all parties involved.C OMMENTARYT he automatic test documentation standard required for the CMM test procedures was ATLAS 616/626.The information provided with the ATLAS test specification was generally considered to be sufficient (by the LRU manufacturer and others) for an implementation on alternate test equipment hardware (ATEs). This simple, basic concept is shown in Attachment 1-4 Figure 1.A lternatives to the ATLAS (e.g. “plain English testspecification”) often were not available from, or provided by, LRU manufacturers. Experience has shown that ATLAS procedures or specifications alone cannot represent the complete set ofARINC REPORT 625 - Page 21.0 INTRODUCTION (cont’d)1.2 Background (cont’d)C OMMENTARY (cont’d)i nformation needed as the source documentation fortest procedure rehost.T hese inadequacies resulted in ever-increasing demands on airframe and LRU manufacturer’s for additional data to support both TPS development and the increasing burden of TPS certification. This increasing demand is depicted in Attachment 1-4 Figures 2 through 4.B ased on airline experience, the quality of testspecifications and test information in the CMMs has proven to be, in many cases, insufficient to support test procedure rehost for the following reasons:ŸTest specifications sometimes contained vague test objectives and guidelines and were full oferrors and not mature.ŸSome LRU manufacturers would not supply an internal test specification when ATLAS was notavailable.ŸManufacturing test requirements were sometimes too different from Return-To-Service(RTS) requirements.ŸDissimilar test concepts made communication and understanding difficult.ŸExternal data files were sometimes not available or documented and were not always referencedin the ATLAS test specification or the CMM.ŸATLAS test specifications were not available in time; updates are too late.ŸThe LRU manufacturers found the cost of producing ATLAS excessive.ŸATLAS development was often subcontracted by LRU manufacturers to TPS developers but notsufficiently controlled, verified, and validated.ŸATLAS test specifications were not fully transportable because necessary implementationinformation was missing.ŸAirlines often found the cost of implementing and maintaining ATLAS-based TPSs excessive.1.3 GoalsTest procedure quality is complex and multi-dimensional. The goal of this report is to provide guidelines and standard procedures for both the TSDP and TPS development.These guidelines and procedures are expected to serve as a standard approach for defining a uniform quality management methodology. This report was developed by an industry wide committee with the objective of encouraging conformity at all stages of the LRU life cycle.The application of these guidelines and procedures will improve the overall quality of LRU maintenance and also have the potential to considerably reduce the TPS life cycle cost for all parties involved.COMMENTARYWhile the importance of overall test solution quality management is recognized, this document will emphasize design and documentation quality issues.It will not discuss workmanship quality issues such as soldering or wiring layout.The current standards for documentation, procedures, development, verification, and validation vary throughout industry. Quality problems are typically caused by poor documentation, different methodologies, philosophies, and insufficient communication. The intent of this report is to improve the communication and understanding between airframe manufacturers, LRU manufacturers, TPS suppliers, and airlines. To demonstrate that testing performed by all parties conforms to the same specifications, common rules for development and implementation of alternate tests, and associated quality assurance procedures should be followed.It is expected that all parties involved in testing will benefit from common standards and philosophies.Test procedure quality improvement can only be realized in an industry environment of cooperation regarding test concepts of airframe manufacturers, equipment manufacturers, and airlines.1.4 Related DocumentsATA Specification 100, “Specification for Manufacturers' Technical Data”ATA World Airlines & Suppliers GuideIEEE Standard 100, “Standard Dictionary of Electrical and Electronic Terms”ARINC Specification 616, “Avionics Subset of ATLAS Language”ARINC Specification 626, “Standard ATLAS for Modular Test”ARINC REPORT 625 - Page 3 2.0 ROLES AND RESPONSIBILITIES2.1 IntroductionThe roles and responsibilities as listed in this section do not necessarily coincide with organizational entities. For example, an airline may be both a TPS developer and a TPS user, while airframe manufacturers may serve in all four roles for those LRUs they build themselves.2.2 Airframe ManufacturerThe airframe manufacturer should ensure the LRU manufacturers selected conform to the guidelines of this document. This includes a contractually-defined, supplier provided and airframe manufacturer-approved TSDP Development Plan.The airframe manufacturer should ensure that LRU manufacturers prepare and follow a TSDP Development Plan during the entire LRU lifecycle by the following methods:ŸDocumentation reviewsŸAudits as neededŸProgress report reviewsŸOther communications as necessary (phone, fax, e-mail, visits, etc.).T he intent of the above is to ensure that the airframe manufacturer and the LRU manufacturer work together to produce and deliver a complete, fully supported, TSDP to a customer airline on time.C OMMENTARYA irline experience has shown that firm requirementsfor the level of detail and quality of documentation to be delivered by LRU manufacturers to airlines and TPS developers should be established very early in the aircraft development program, i.e. airframe manufacturers should include relevant clauses in their contracts with the LRU manufacturers. If this opportunity is missed, additional information requested by airlines and TPS developers later in the program is often considered as proprietary data. The information then is either not available or is charged for by the LRU manufacturer. Additionally, the airframe manufacturer should improve vendor monitoring to make sure that contract terms are honored.2.3 LRU ManufacturerT he LRU manufacturer is responsible for the testability of the LRU, test strategies, and for implementing the TSDP Development Plan. The LRU manufacturer should define and document their policy and objectives for, and commitment to, the quality of LRU test data required for TSDP and TPS generation. The LRU manufacturer should ensure that this policy is understood, implemented, and maintained at all levels in their organization.2.3.1 TSDP Development PlanT he TSDP Development Plan should include the following:ŸSufficient resource allocation (facilities, personnel, equipment)ŸReasonable milestones and schedules for releaseŸDefinition of source documentation (data, software, services)Ÿ A quality assurance processŸ A configuration management processŸ A periodic report of progress being made, any projected schedule slips and recovery plan.ŸTSDP sustaining process2.3.2 Test Strategy and LRU TestabilityT he test strategy design should be an integral part of the overall design/development process of the LRU. This ensures that the test specifications and procedures used at the manufacturer for production are not too different from what is needed as source documentation for the later TPS development. This facilitates cost-effective information transfer for the equipment manufacturer and better understanding in case problems may arise during TPS development.T esting technology should be a basic part of the LRU design process. It should include consideration of traditional design for testability techniques, boundary scan, BITE, etc. Design techniques which promote testability should be developed along with the ability to predict and demonstrate testability quantitatively.L RUs that include BITE should be tested in a manner that efficiently utilizes these testing aids, i.e. test sequences should be structured according to the BITE information for more effective troubleshooting. Wherever possible, the manufacturer should design the test strategy such that the return-to-service test is a subset of the procedures developed for the factory acceptance test.2.3.3 Source DocumentationTaccurate, and unambiguous documentation sufficient to implement the LRU return-to-service test. A detailed list of items and attributes needed in the source documentation is contained in Section 3. Emphasis should be placed on the content of the test source documentation rather than the format.T his documentation should be supplied in time for the TPS developer to finish the TPS prior to first LRU delivery to the customer airline. In the special case of a brand new LRU design, or the even more special case of a new aircraft type, the LRU manufacturer should provide preliminary information to the TPS developer. These relationships are illustrated in Attachment 1-3,ARINC REPORT 625 - Page 42.0 ROLES AND RESPONSIBILITIES (cont’d)2.3.3 Source Documentation (cont’d)C oncurrent TPS Process and Information Flow Diagram.C OMMENTARYT he LRU manufacturer, through the contents of the source documentation, establishes the TPS quality potential. A job done poorly on the source documentation will tend to have a negative impact on the cost and quality of the subsequent TPS. It is critical that the source documentation be of the highest possible quality to assure a high quality TPS.For this reason, the LRU manufacturer is responsible for the configuration management of the source documentation. In addition, the LRU manufacturer should have a test problem reporting system to provide TPS developers a forum for data problem resolution.T he LRU manufacturer will ensure that the source documentation is shop-verified and will provide a completed checklist as defined by Section 3.5.C OMMENTARYT he source documentation quality is the most critical issue in the TPS life cycle, since most of the shortfalls of the source documentation are carried through the whole development process and can later be found in the TPS product. Generally, it is very expensive to cure problems late in the development that have been present since the very beginning.S ource documentation quality has been poor and should be improved. When the LRU manufacturer does not supply necessary source data, it must be developed through reverse engineering that is both difficult and expensive.S ome of the information needed for TPS development is often withheld. The rationale for this varies. Some LRU manufacturers believe they are not obligated to spend more effort than their contractual obligations demand. Others are reluctant to provide information because they prefer to promote their own dedicated test equipment.2.3.4 Scope of Return to Service TestingT he purpose of the return-to-service test is limited to determining whether the hardware is working correctly and whether the correct version of software is installed and not corrupted. For modern avionics, the scope for return-to-service tests (RTS) should be limited to hardware testing and software integrity checks. Furthermore, certain manufacturing tests, such as dielectric tests or environmental stress screening tests, should not be part of subsequent return to service testing.I n the interest of minimum testing times, the return-to-service test should not include any steps whose purpose is to verify the LRU design; that should be done only once, prior to LRU certification. Each test requirement should be carefully scrutinized. If a test is needed for design verification rather than for return to service testing, it should be omitted.D epending on the targeted level of maintenance to be provided, extra test steps may be needed to identify the faulty component in an LRU that fails the go/nogo test. These fault isolation steps should be optional and not part of the go/nogo test path. The test specification should be designed to detect any fault capable of being propagated to an output.C OMMENTARYT he terminology for return-to-service testing ranges from “Recertification Test,” “Serviceability Test,” to “Acceptance Test.” There might be even more names for the same thing.S imilar equipment from different LRU manufacturers is sometimes treated with different philosophies and test methods (e.g. different environmental test requirements for engine controls). This should be minimized by making sure that no tests are performed that do not have a specific bearing on the serviceability of the LRU such as weight. Additionally, specify the widest acceptable environmental conditions.2.3.5 Configuration ManagementT he LRU manufacturer should have a configuration management system that controls the source documentation.2.3.6 Source Documentation UpdatesT he LRU manufacturer should ensure that if change occurs in the source documentation that impacts existing TPSs, then this TPS change must be reflected within the TSDP and CMM. Revised source documentation elements should be available on request (to the airline).C OMMENTARYC hanges to source documentation generally are notavailable on time due to the long revision cycle of CMMs. Traceability is often lost without a clear reference to the new test specification or documentation of the changes in the service bulletin.2.3.7 Problem Reporting SystemT he LRU manufacturer should maintain a test problem reporting system that enables users of the source documentation to report problems and request corrective action.2.3.8 Source Documentation AccuracyT he LRU manufacturer is responsible for the technical content and accuracy of the TSDP. Detailed requirements are shown in Section 3 and a checklist is provided in Attachment 3-1. A copy of the checklist should be provided to the TPS developer.C OMMENTARYI t is understood that testing information providedprior to formal certification of the LRU being tested may not be in final form and subject to substantial change. This precertification information is provided with the understanding that the supplier is not obligated for the stability and completeness of the information. It is further understood this information will not be distributed without a direct request from an airline customer.2.4TPS DeveloperT PS developers should define and document their policy and objectives for, and commitment to, TPS quality. TPS developers should ensure that this policy is understood, implemented, and maintained at all levels in their organizations.T he TPS developer is responsible to provide to the user the following:ŸTPS Development PlanŸQuality Assurance PlanŸConfiguration Management PlanŸTPS Sustaining ProcessThe TPS developer should establish and maintain a documented quality system, which should cover quality assurance and configuration management aspects, and should be an integrated process throughout the TPS life cycle, thus ensuring that quality is being built into the TPS product. The prevention of problems should be emphasized rather than the correction of problems after they occur.The TPS developer should ensure the effective implementation of a documented quality system, including procedures for documentation, quality plans, internal quality system audits, configuration management, and problem reporting. Test problem reports should be traceable to the TPS configuration management system and to the TSDP, if applicable.LRU manufacturers providing initial TPSs to the airframe manufacturer and airline customers should produce the test solution based on the LRU manufacturer’s internal quality standards. The LRU manufacturer’s quality system is governed by airframe manufacturer’s quality system requirements. Third party TPS developers typically are not governed by airframe manufacturers quality systems. The roles and responsibilities for the TPS developer outlined in this section refer to third party TPS developers.The TPS developer should offer appropriate training to assure efficient and correct use of the TPS.2.4.1 TPS Development PlanThe TPS developer should begin with a clear understanding of the requirements of the TPS user. The development plan should include at least the following activities:•TPS design•TPS implementation•TPS verification•TPS validation•TPS delivery2.4.1.1 Design and ImplementationDue to the complexity of TPSs, all steps of design and implementation should be performed in a disciplined manner in order to be able to build quality into the product. Feedback from past design experiences is important to improve quality of the new design. The design definition should also recognize the subsequent processes during the TPS life cycle, e.g., TPS maintainability and usability. Guidelines are contained in Section 6.TUA design should strive for minimum complexity. Active circuits should be avoided if at all possible. Usability details such as handles properly located with respect to the center of gravity, proper cable strain relief, ease of maintenance access, etc, should not be overlooked.2.4.1.2 Verification and ValidationVerification and Validation are the processes by which the TPS developer verifies the TPS works correctly. Verification concerns the process of examining the result of each one of the development phases (TPS design, TPS implementation, etc.) to determine conformity with the stated requirements for that activity.Validation is the act of demonstrating that a TPS is capable of fulfilling the requirements for which it has been designed. The minimum requirements are those defined by the Test Specification (TS) but also may include any additional requirements imposed by the TPS User or TPS Developer. The validation process should use a formal procedure and should produce documented test results.COMMENTARYIf possible, validation should involve multiple LRUs tested on multiple ATE stations. (This is normally not possible unless the TPS developer is also the LRU manufacturer and has access to multiple LRU assemblies and multiple test stations.) The procedure and the results should be available to the TPS user, unless otherwise specified in the TPS purchase contract.In some cases, testing an unreleased TPS using a cooperative airline has been shown to strengthen the quality of that TPS.。
- 1、下载文档前请自行甄别文档内容的完整性,平台不提供额外的编辑、内容补充、找答案等附加服务。
- 2、"仅部分预览"的文档,不可在线预览部分如存在完整性等问题,可反馈申请退款(可完整预览的文档不适用该条件!)。
- 3、如文档侵犯您的权益,请联系客服反馈,我们会尽快为您处理(人工客服工作时间:9:00-18:30)。
Fault branching and rupture directivitySonia FlissLaboratoire de Me´canique,Ecole Polytechnique,Palaiseau,FranceHarsha S.BhatDivision of Engineering and Applied Sciences,Harvard University,Cambridge,Massachusetts,USARenata Dmowska and James R.RiceDepartment of Earth and Planetary Sciences and Division of Engineering and Applied Sciences,Harvard University,Cambridge,Massachusetts,USAReceived8August2004;revised10January2005;accepted2March2005;published29June2005.[1]Could the directivity of a complex earthquake be inferred from the ruptured faultbranches it created?Typically,branches develop in forward orientation,making acuteangles relative to the propagation direction.Direct backward branching of the samestyle as the main rupture(e.g.,both right lateral)is disallowed by the stress field at therupture front.Here we propose another mechanism of backward branching.In thatmechanism,rupture stops along one fault strand,radiates stress to a neighboring strand,nucleates there,and develops bilaterally,generating a backward branch.Such makesdiagnosing directivity of a past earthquake difficult without detailed knowledge of thebranching process.As a field example,in the Landers1992earthquake,rupture stopped atthe northern end of the Kickapoo fault,jumped onto the Homestead Valley fault,anddeveloped bilaterally there,NNW to continue the main rupture but also SSE for4kmforming a backward branch.We develop theoretical principles underlying such rupturetransitions,partly from elastostatic stress analysis,and then simulate the Landers examplenumerically using a two-dimensional elastodynamic boundary integral equationformulation incorporating slip-weakening rupture.This reproduces the proposedbackward branching mechanism based on realistic if simplified fault geometries,prestressorientation corresponding to the region,standard lab friction values for peak strength,and fracture energies characteristic of the Landers event.We also show that the seismicS ratio controls the jumpable distance and that curving of a fault toward its compressionalside,like locally along the southeastern Homestead Valley fault,induces near-tipincrease of compressive normal stress that slows rupture propagation.Citation:Fliss,S.,H.S.Bhat,R.Dmowska,and J.R.Rice(2005),Fault branching and rupture directivity,J.Geophys.Res.,110, B06312,doi:10.1029/2004JB003368.1.Introduction[2]The rupture zones of major earthquakes often in-volve geometric complexities including fault bends, branches and step overs.Recently,some understanding of the mechanics underlying dynamic processes of fault branching and jumping has started to emerge.A new question has emerged as well:Is it possible to judge the directivity of a large earthquake from the rupture pattern it left?The answer to that question would be very useful for risk assessment of future earthquakes,even if it is cur-rently unknown if large earthquakes do systematically repeat their rupture direction(while not necessarily the entire rupture pattern).Here we address a particular, narrower version of that question,namely:Could we associate the directivity of a major earthquake with the pattern of branches that it left?[3]That question has been posed by Nakata et al.[1998], who proposed to relate the observed surface branching of fault systems with directivity.Their work assumed that all branches were through acute angles in the direction of rupture propagation.However,Dmowska et al.[2002] pointed out that for at least some field observations,the rupture paths seemed to branch through highly obtuse angles,as if to propagate‘‘backward’’along the branch. In general,there are no observational proofs that this is what really happened in these cases.It is even possible that some obtuse branches are due to early aftershocks.However,in the case examined here involving a particular backward branch in the1992Landers,California,earthquake,Poliakov et al.[2002]showed that the pattern of damage to a single side of the fault clearly indicates such a backward direction of propagation on that branch.Here we analyzeJOURNAL OF GEOPHYSICAL RESEARCH,VOL.110,B06312,doi:10.1029/2004JB003368,2005Copyright2005by the American Geophysical Union.0148-0227/05/2004JB003368$09.00and numerically simulate the mechanics of such backward branching and relate the results to understanding rupture directivity.1.1.Diagnosing Rupture Directivity[4]The basic mechanical questions when relating fault branching to rupture directivity are summarized in Figure1. Figure1a presents the typical fault branching through acute angle,readily observed in the field and recently analyzed by Poliakov et al.[2002]and Kame et al.[2003].The propen-sity of the fault to branch in that way depends on the orientation of the local prestress field relative to that of the main fault,the rupture velocity at branching junction and the geometry of the branch(the angle between the main and branching faults).The turn of rupture path through an obtuse angle while continuing on main fault is illustrated in Figure1b and is never favored by the stress field;see section1.3.What is proposed here as the mechanism of creation of a backward branch is presented in Figure1c and consists of arrest of rupture propagation along an initial fault strand,radiating stress increase and hence jump of the rupture to a subsidiary fault[Harris et al.,1991;Harris and Day,1993]on which it nucleates and then propagates bilaterally.Part of the rupture along the neighboring fault creates the backward branch.[5]Figure1d presents the mechanical dilemma of backward branching:Did the rupture arrive from the right and branch through an acute angle,as illustrated in Figure1d(top)?Or,did it arrive from the left,stop, jump,and nucleate on a neighboring fault,then develop bilaterally,as illustrated in Figure1d(bottom)?The jump here is exaggerated,in real field cases the observation of surface ruptures might not at once provide the rightanswer.The purpose of the present paper is to documenta field example of the latter case as well as to developtheoretical understanding and numerical simulation of theprocess.1.2.Field Examples of Backward Branching[6]We study the transition of the rupture path from theKickapoo to the Homestead Valley faults,Figure2,duringthe1992Landers earthquake,so as to leave a backwardbranch in the rupture path along the southern end ofHomestead Valley fault.The rupture started to the SSE ofthe area covered by the map,along the Johnson Valley fault,and continued far to the NNW,first along the HomesteadValley fault and then the Emerson and Camp Rock faults[Rockwell et al.,2000;Sowers et al.,1994;Spotila andSieh,1995;Zachariasen and Sieh,1995].[7]In the1992Landers earthquake[Sowers et al.,1994],right-lateral slip on the Johnson Valley Fault propagatedfirst along that fault but then,after several aborted attemptssignaled by the short surface breaks shown,it branched tothe dilational side onto the Kickapoo fault,at an angle j%À30°.The rupture also continued a few kilometers to the NNW on the main(Johnson Valley)fault.That exemplifiesthe type of branching typically considered,through an acuteangle relative to the direction of propagation along theprimary fault.(The Johnson Valley and Kickapoo branchhas been analyzed as a field case in support of recenttheoretical work[Poliakov et al.,2002;Kame et al.,2003],explaining how such typical branching depends on prestress state,branch geometry,and rupture propagation speed as the branch junction is approached.)[8]What is of interest here,however,is that the rupture, after propagating along the Kickapoo segment,transitioned to the Homestead Valley fault and progressed not just to the north on that fault,in continuation of the main Landers rupture,but also backward along the Homestead Valley fault where it curves to the SSE.That forms the backward branch(backward relative to the main direction of rupture propagation)that we consider,a prominent feature of4km length.Measurements of surface slip along that backward branch[Sowers et al.,1994]show right-lateral slip,de-creasing toward the SSE.Prominent surface breaks were also observed along the western side of the Homestead Valley fault(Figure2).From those it can be argued [Poliakov et al.,2002;Kame et al.,2003]that given the local principal prestress orientation[Hardebeck and Hauksson,2001],the western side of the southern Home-stead Valley fault should have been the dilational side of the rupture.That,along with the slip pattern,suggests that rupture initiated on the Homestead Valley fault in the region where it is closely approached by the Kickapoo fault,near the northern termination of the latter,and then propagated bilaterally,both north and SSE along the Homestead Valley fault.[9]The following are other cases,also from the Eastern California Shear Zone,of rupture transitions that leave backward branched rupture patterns:As rupture continued along the Homestead Valley fault,NNW of theregion Figure1.Issues in fault branching(see text).Figure2.Map from Sowers et al.[1994]showing region of transition from the Johnson Valley to the Kickapoo and to the Homestead Valley faults during the1992Landers earthquake.The thickest linesshow fault breaks with surface slip>1m,intermediate lines>0.05m,and thinnest lines>0.01m.mapped in Figure2,there was a transition of the rupture path to the Emerson fault,but while primarily propagating to the NW,the rupture also progressed backward along different SSE splays of the Emerson fault[Zachariasen and Sieh,1995].The rupture path next transitioned from the Emerson to the Camp Rock fault,and in doing so again generated a backward branch to the SSE on the Camp Rock fault.Another case is in the1999Hector Mine earthquake.Rupture originated on a buried fault without surface trace[Li et al.,2002;Hauksson et al.,2002; Oglesby et al.,2003a]and progressed bilaterally south and north.In the south it met the Lavic Lake fault and progressed a large distance south on it but also progressed backward,i.e.,NNW,along the northern stretch of the Lavic Lake fault.The angle between the buried fault and the northern Lavic Lake fault is j%À160°,and that NNW stretch extends around15km,defining a major backward branch.1.3.Backward Branching Mechanisms[10]Such examples with highly obtuse branch angles (backward branching)suggest that there may be no simple correlation between fault geometry and directivity. An important question is whether those obtuse branches actually involved a rupture path which directly turned through an obtuse angle(while continuing also on the main fault)like in Figure1b,or rather involved arrest by a barrier on the original fault and jumping to a neigh-boring fault,on which rupture propagated bilaterally (Figure1c).The importance of stopping on the main fault to making the jumping mechanism possible will be discussed later.[11]Stress fields around a dynamically moving mode II crack tip with right-lateral slip have been reported by Poliakov et al.[2002].At the obtuse angles considered, they predict strongly left-lateral shear stress and hence are inconsistent with having the rupture path directly turn through highly obtuse angles like in Figure1b if slip is to remain right lateral on the branch.Thus we discount that mechanism.Note that there is no inhibition to obtuse angle branching with left-lateral slip on the branch;that situation was observed in lab experiments under impact loading [Rousseau and Rosakis,2003].Rousseau and Rosakis diagnosed small tensile fracture arrays along the extensional side of the rupture where the slip was right versus left lateral.[12]On the other hand,there is evidence that the Kick-apoo and Homestead Valley faults are disjoint from one another,so that the transition fits the stopping and jumping scenario of Figure1c.First,mapping of observable fault slip (>10mm)in the vicinity of the transition[Sowers et al., 1994](see Figure2)suggests that the faults do not actually intersect one another at the surface.Second,Li et al.[1994] used studies of fault zone trapped waves to show that there was transmission in a channel along the southern Johnson Valley and Kickapoo faults and in another channel along the Homestead Valley fault but no communication between those channels.Those results suggest that the Kickapoo and Homestead Valley faults do not join,at least at the possibly shallow depths controlling the observations.Finally, precise relative relocations of Landers aftershocks have been used to image the fault strands at depth[Felzer and Beroza,1999]and suggest that they form two discrete structures throughout the seismogenic depth range.1.4.Branching and Rupture Directivity[13]If such a jumping mechanism turns out to be a reasonably general mechanism of backward branching,then an implication for the Nakata et al.[1998]aim of inferring rupture directivity from branch geometry is that such will be possible only when rather detailed characterization of fault connectivity(by surface geology,microearthquakes reloca-tion,trapped waves)can be carried out in the vicinity of the branching junction.Such studies must ascertain whether direct turning of the rupture path through an angle,or jumping and then propagating bilaterally,were involved in prior events.Those two possibilities have opposite impli-cations(Figure1d)for how to associate directivity with a (nominally)branched fault geometry.[14]In the following sections of the paper,we analyze the mechanics of rupture propagation and slip transfer for faults with complex geometries similar to those near the Kickapoo to Homestead Valley transition.We show that these consid-erations strongly support the possibility that the backward branch formed by the jumping and bilateral propagation mechanism of Figure1c.(Further,we note that Aochi and Fukuyama[2002]tried to simulate the Kickapoo to Home-stead Valley rupture transition by assuming that the faults were actually connected in an inverted‘‘y’’type of branch junction,rather than forming the step over configuration that we assume here.They could then achieve rupture continuation from Kickapoo onto the northern Homestead Valley fault,but not onto the southeastern part of the Homestead Valley fault which is the object of our study here,and which hosted the backward branch of rupture observed.)2.Choice of Prestress and Modeling Parameters 2.1.Parameters[15]For convenience,we treat the Kickapoo fault near its northern termination as being straight and coincident with the x axis,which runs south to north(like the fault itself does approximately in that region;Figure2).The fault plane is y=0,with the y axis positive to the west,and we perform two-dimensional(2-D)modeling in that x,y plane.Here and later,all faults are considered to undergo right-lateral strike slip.[16]The prestress,i.e.,the tectonic stress in the region, has the forms0ij¼s0xxs0xys0yxs0yy!ð1Þas regards in-plane components,where normal stresses are positive if tensile.We should actually think of these as effective stresses(s ij0)tot+p0d ij,where p0denotes initial fluid pore pressure.As in the work by Kame et al.[2003],in which the branching from the Johnson Valley to Kickapoo faults during this earthquake was studied,the static friction coefficient tan(F s)=m s is taken as0.6,generally consistent with laboratory values,and cohesion is neglected.It is less clear what to take for the dynamic coefficient tan(F d)=m d after slip weakening,or how reasonable it is to regard it asactually constant at large earthquake slip,especially when thermal weakening and possible fluidization is considered.Values of m d /m s =0.8and 0.2have been tested and the results do not show significant differences.Only the results for m d /m s =0.2will be shown here.We choose the shear modulus m =30GPa and the Poisson ratio n =0.25(l =m ).[17]Most of our results can be expressed in nondimen-sional form but when necessary for numerical illustrations here,we have used G =1MJ/m 2for the crack energyrelease rate and s yy 0=À50MPa.For the corresponding s xx 0,to be discussed subsequently,the in-plane invariant (s xx 0+s yy 0)/2=À59.5MPa.Assuming ideal strike-slip rupture (i.e.,vanishing intermediate deviatoric stress),that invariant is equal to the effective overburden,and assuming hydro-static pore pressure,that corresponds to a depth of 3.3km.Given the nondimensionalization of our problem,features of the solution such as the speed of rupture propagation and its time evolution,and details of if,where and how slip transfers between faults,would be unchanged for the choice of parameters G =4MJ/m 2and s yy 0=À100MPa.That change,which keeps the slip-weakening zone length R at the same (time-dependent)size throughout the rupture as for the above case,would correspond to a depth of 6.6km.Such depth is a reasonable estimate of the centroidal depth of rupture during the Landers event,and the fracture energy is close to the 5MJ/m 2inferred for it by seismic slip inversions,fitted to 3-D analyses of slip-weakening rupture [Olsen et al.,1997;Peyrat et al.,2001].[18]To properly determine the in plane prestress field around the faults,if all the stresses are normalized by Às yy 0,two further quantities have to be specified.First,on the basis of inference of principal stress directions from micro-seismicity by Hardebeck and Hauksson [2001],the maxi-mum principal compressive stress direction around the faults is approximately 30°east of north.Because the tangent direction to the Kickapoo fault is about north.Thus there is an angle É%30°between the most compressive stress and that fault (Figure 3).[19]We have to specify one more value,for example theshear stress ratio,s yx 0/(Às yy 0).There is no rigorous way to specify that.We choose it according to considerations of rupture propagation velocity v r .Supershear v r is sometimes,but only relatively rarely,inferred for natural events.Thus we choose parameters so that v r remains sub-Rayleigh.Andrews [1976]shows the influence on v r of the ratioS ¼t p Às 0yx =s 0yx Àt rð2Þwhere t p =Àm s s yy 0is the peak strength and t r =Àm d s yy 0is the residual strength after slip weakening.When S is small enough,a transition from sub-Rayleigh to supershear propagation will occur,so we do not want S to be so small as to allow that in our modeling.However,in a simple static study to follow,we show that the smaller is the value of S ,the larger is the maximum distance that can be jumped,and vice versa.So it won’t do to make S too large,and a compromise has to be ing Figure 9of Andrews [1976](which shows the v r achieved as a function of S and the ratio of the length L of the ruptured zone to the minimum unstable crack length L c ),and the static study,we have chosen S =1.3.For that,v r remains sub-Rayleigh inour configuration.It leads to s yx 0/(Às yy 0)=0.33.[20]Given the principal direction at É=30°,we can thencalculate,the remaining in-plane stress ratio as s xx 0/s yy 0=1.38.That corresponds to the in-plane invariant (s xx 0+s yy 0)/2=1.19s yy 0.2.2.Strength Constraints on Prestress[21]In order to make the prestress field realistic we have to satisfy some mechanical conditions.Since large regions of earth cannot sustain tensile stresses,no principal stress should be tensile.Also,the prestress field should not violate the Mohr-Coulomb criterion for onset of frictional rupture.[22]With the two parameters,Éand s yx 0/(Às yy 0),the condition to avoid tension is:s 0yxÀs yytan ÉðÞ<1ð3Þwhich is respected with our parameters.Second,to makesure that the prestress does not violate the Coulomb failurecondition,i.e.,that j s 210j <Àm s s 220,for any orientation of the faults (Figure 4),s yx 0/s yy 0has to satisfys 0yxÀs yy<sin F s ðÞsin 2ÉðÞ1Àsin F s ðÞcos 2ÉðÞð4ÞIn this case,the condition is s yx 0/(Às yy 0)<0.60which is also respected.3.Elastostatic Singular Crack Modeling[23]The goal of this section is to give a general idea of stressing near the end of an arrested rupture,to begin to determine conditions so that a rupture can jump to another fault,parallel [Harris and Day ,1993]or not.For simplicity,we start with the study of an elastostatic singular crack model of a mode II rupture.[24]We suppose that the two ends of a finite rupture have finished their motion and that all along the crack there is sustained a stress equal to the residual shear strength,s yx =t r =Àm d s yy 0(as represented in Figure 5).This static study can be understood as a study after the motion.It is suggestive only,because we cannot preclude the possibility that dynamic stresses very close to the stopped rupture tip were higher than in the final static field;they cannot be on the crack plane itself,from basic results on unsteady crack dynamics [Fossum and Freund ,1975],but the situationisFigure 3.Simple modeling of the faults involved in the 1992Landers earthquake.more complex in the near tip field at other orientations relative to the rupture,as well as at more distant locations.3.1.Faults[25]In the branching transition from the Johnson Valley to the Kickapoo faults,we will neglect the few km contin-uation along the former,and consider it and the Kickapoo fault as one,and only one,main fault,whose length is 15km.(Of course the actual length is longer,but we do not want to allow crack lengths in a 2-D model which are much greater than the seismogenic thickness of the crust.From 3-D con-siderations that thickness sets a limit,which is not contained in 2-D models,on how much further increase of crack length along strike can increase the stress concentration at the crack ends.)To determine the stress distribution due to the crack for the singular static model,the Johnson Valley and Kickapoo faults are represented,just here but not in the elastodynamic study to follow,as a straight fault of 15km length.Figure 3gives one simple modeling of the faults,with the Homestead Valley fault at orientation angles w =0°and 30°,in pieces,relative to the straight fault.Actually,the smallest distance between the Kickapoo and Homestead Valley fault is a few hundred meters (between 200and 300m)[Sowers et al.,1994],and the orientation angle w of the closest parts of the latter fault,relative to Kickapoo is between 0°and 10°.3.2.Static Stress Distribution[26]Consider a single straight crack extending from x =ÀX to 0on the x axis,with X =15km,in the infinite x ,y plane,in a mode II configuration.We study the stress distribution near the crack tip x =0.As explained by Rice[1980]and Poliakov et al.[2002],the final stress s ij is the sum of the initial stress s ij 0and stress change D s ij due to introduction of the crack,and is given bys ij ¼K IIffiffiffiffiffiffiffiffi2p rp S ij q ðÞþs 0xx t r t rs 0yyþO ffiffirp ÀÁð5Þwhere (r ,q )are the polar coordinates (the origin is the crack tip),the S ij (q )are certain universal functions normalized to S yx (0)=1(see,e.g.,Lawn and Wilshaw [1993]or Rice [1968]or other sources on elastic crack theory)and t r =Àm d s yy 0the residual shear strength.In the present case the stress intensity factor isK II ¼s 0xy Àt rffiffiffiffiffiffiffiffiffiffiffiffip X =2p ð6Þand O (ffiffir p )denotes term which vanish in proportion to ffiffir p or faster as r !0.[27]The full representation of the stress field,effectively identifying explicitly all terms in equation (5)including those denoted O (ffiffir p ),may be done using standard tech-niques in the 2-D elasticity analysis of cracked solids [e.g.,Rice ,1968]to solve for D s ij .Thus letting the complex position be denoted by z =X /2+x +iy ,s xx þs yy ¼s 0xx þs 0yy þ4Re f 0z ðÞ½s yy Às xx þ2i s yx ¼s 0yy Às 0xx þ2i s 0yx þ2z f 00z ðÞþy 0z ðÞ½ð7Þwhere for our mode II problemf 0z ðÞ¼s 0yx Àt r2iz z 2ÀX 2=4ðÞ1=2À1"#;y 0z ðÞ¼À2f 0z ðÞÀz f 00z ðÞð8Þ[28]Representation of the stress field for purposes of our plots in Figure 6is done using the full equations (7)and (8),although the plots are very similar in appearance when we use equation (5)and simply neglect the terms denoted O (ffiffir p ).3.3.Conditions for Rupture Nucleation on a Nearby Fault[29]In the Coulomb friction model,rupture can nucleate at any point if the shear stress is higher that thestaticFigure 5.Singular elastic crack model (mode II shear)for static rupture.Stress state shown (left)behind the tip,near the fault surface,and (right)far ahead,where it coincides with theprestress.Figure 4.Mohr circle of the prestress.Conditions required to not violate the failure conditions in any orientation and to favor the propagation of the rupture for some orientations.friction strength.So,it is relevant to consider the normal and shear stresses (s 22,s 21)at a point on a potential fault,whose polar coordinates are (r ,q ).Different orientation angles w given to the second fault are analyzed,and different situations of nucleation may arise as follows:[30] 1.If s 22<0and s 21>m s (Às 22),right-lateral slip nucleates.The area where this condition is met is repre-sented in medium gray.[31] 2.If s 22<0and s 21<Àm s (Às 22),left-lateral slip nucleates.The area where the condition is met is repre-sented in light gray.In fact,we’ll find none such for our w range studied.[32] 3.If s 22>0,the area is represented in dark pressional remote stress fields only are studied so that the faults remained closed but it is interesting to test if there are local areas where the normal stress is predicted to be extensional.[33]With these different representations,we analyze where a nearby nucleation on a second fault could occur,at least as based on the static field.This allows a preliminary estimate of the influence of different parameters:character-istics of the step over (width and overlap of the second fault,its local orientation w ),prestress,stress drop s yx 0Àt r ,and ratio S =(t p Às yx 0)/(s yx 0Àt r ).3.4.Results for Some Second-Fault Orientations[34]Results based on our model parameters as in sections 2and 3.1are shown in Figure 6for local w =0°,5°and 10°.We see that this simple static analysis is consistent with some conclusions of the Harris and Day [1993]dynamic study of step overs between parallel fault strands (case w =0°).First is the difference between the compressional and the dilational sides.Indeed,there is no symmetry,and the areas of possible nucleation and the maximum ‘‘jumpable’’distance are very different accord-ing to the overlap.[35]Moreover,for these orientations only right-lateral slip is possible;there are no light gray regions signaling left-lateral slip.The higher is the orientation of the second fault the smaller are the maximum jumpable distance and the area where the nucleation is possible.[36]There are very small regions adjoining the crack tip on the dilational side where the normal stress is positive,signaled by dark gray shading.That means a possible opening of the secondary fault,but strong conclusions cannot be drawn because this is particularly near the crack tip (where the simple model adopted has a singularity of the stress),and also because we have not analyzed effects on the stress field of plastic yielding in the Coulomb failure regions shown to envelop those zones.[37]Comparing the stress distribution calculations for several orientations which represent where the nucleation of a rupture is possible,given the position of the curved Homestead Valley fault and its orientations,we can antic-ipate that the rupture should jump from Kickapoo fault and might nucleate in several positions along theHomesteadFigure 6.Areas where nucleation of a rupture is possible,for various orientation angles w of the second fault.Angles w =0°,5°and 10°,are chosen with reference to the geometry of the Homestead Valley fault.The medium gray regions are those for which s coul =s 21+m s s 22>0on a fault trace with orientation w (i.e.,areas where right-lateral failure nucleation is possible).Small,dark gray regions near the crack tip are areas where the elastically calculated normal stress on the second fault is tensile (s 22>0);see enlarged view of region,for the w =0°case,in top right.The black lines in the upper two panels,for the w =0°case,represent the points where,for each fixed y ,s coul attains its maximum with respect to x .。