ESR1卫星
牟乃夏-esri大赛一等奖-崂山森林火灾扩散模拟分析与决策系统

崂山森林火灾扩散模拟分析与决策系统1开发背景与设计思想1)开发背景随着信息化建设的不断深入,信息产业成为社会经济增长的新的驱动力,信息技术的迅猛发展和广泛应用,从根本上改变了现代社会的生存和发展环境。
世界各国愈来愈把发展信息产业及相关技术放到重要战略地位上来考虑。
地理信息系统(Geographical Information System,简称GIS)是反映人们赖以生存的现实世界(资源与环境)的现势和变迁的各类空间数据及描述这些空间数据特征的属性数据,在计算机软件和硬件支持下,以一定的格式输入、存储、检索、显示和综合分析应用的技术系统。
GIS是一门工程应用型学科,是计算机科学、地理学、测量学、地图学等多门学科综合的技术。
GIS技术在国民经济建设中发挥着越来越重要的作用,广泛应用于城市建设、环境监测、土地管理、交通运输、水利、林业矿产等领域。
近年来,许多应用领域对地理信息系统提出了更高的要求,促进了GIS技术的迅速发展。
许多计算机领域的新技术,如网络技术、面向对象技术、图形图像和人工智能等技术都被应用到GIS领域。
在森林林业领域中,数字林业建设成为国家林业局确定的“十二五”期间重大科技项目。
我国数字林业建设的总体目标是:以林业重点工程为切入点,创建数字林业中心,研究数字林业构建中的关键技术,建设数字林业工程,最终形成整合集成的数字林业。
数字林业主要有两方面的涵义,一是基于3S(遥感RS、地理信息系统GIS、全球定位系统GPS)技术的林业信息数字化;二是对这些数字信息的储存、处理、传输和应用。
也就是说,数字林业不仅可以将林业的各种特征用数字化的形式表述,还可对这些数字进行处理。
以GIS及RS、GPS为代表的新技术将在森林资源监测、营林规划设计、森林灾害预警、科学宏观辅助决策等方面带来巨大的变革和深远的影响。
林业领域采用GIS的重要目的是辅助解决与空间相关的问题,其核心功能是空间分析,通过空间分析为各类用户提供管理上的辅助决策。
利用GOME卫星资料分析北京大气NO2污染变化

第1 7卷 1期 20 0 6年 2月
应 用 气 象 学 报
J OURNAL OF A PPL E M ETE I D OROL OGI CAL S ENC CI E
Vo . 7.No 1 11 . F b u r 0 6 e r ay2 0
利 用 GOME卫 星 资料 分 析 北 京 大气 N 污 染 变 化 O2
’ desRi e。 h 江 文华 2 马 建 中 ’ 颜 鹏 An ra c tr’ ) ’
n r N B ) k 3 Jh o n P.B ro 3 He d i u rws)
1( 中国 气 象 科 学 研 究 院 , 京 10 8 ) 北 0 0 1 ’重 庆 市 气 象 台 , 庆 4 14 ) ( 重 0 1 7
柱浓度月平均卫星遥感资料以及根据北京市 2 0 年 1月 1日一2 0 01 02年 1 2月 3 1日 N 2 O 污染指数数据计算 出的地 面N O,日均质量浓度值 , 分析 了北京市城市大气 NO 污染 变化的季节 变化 特征 以及 年际变 化 , 将 2 0 2 并 0 1年 1 月
一
在 日光 照 射下很 快达 到稳态 平衡 I 。 近年来 , 随着 我 国产 业 结 构 由粗 放 型 向集 约 型
的转变 和 能源 消耗 结 构 的 优化 调 整 , 源 消耗 导致 能
及O 污 染 造 成 重 要 的 影 响 。2 0 0 1年 1月 一3月 3 个不 同时段 在北 京城 市地 区大气 边 界层 进行 的大气 化学 和气象 现 场观测 表 明lJ北 京城 市 冬季 、 春低 8, 初 层大气 中主要 的气体 污 染物 为 N 在 逆温 、 O, 大气层 结稳 定 天 气 条 件 下 , 发 生 严 重 的 N 污 染 , 易 O 2月
Landsat 、MSS、TM和ETM+简介和应用
LandsatMSS/TM/ETM简介和应用LANDSAT是美国NASA的陆地卫星计划(1975年前称“地球资源技术卫星-ERTS”),从1972年(一1SLC)的Landsat7ETM+影像数据包括8个波段(波段设计),band1-band5和band7的空间分辨率为30米,band6的空间分辨率为60米,band8的空间分辨率为15米,南北的扫描范围大约为170km,东西的扫描范围大约为183km。
L7SLC-on是指日Landsat7SLC故障之前的数据产品。
L7SLC-off是指日Landsat7SLC故障之后的异常数据产品。
(二)Landsat4-5TM1、产品描述Landsat主题成像仪(TM)是Landsat4和Landsat5携带的传感器,从1982年发射至今,其工作状态良好,几乎实现了连续的获得地球影像。
Landsat-4和Landsat5同样每16天扫瞄同一地区,即其16天覆盖全球一次。
LandsatTM影像包含7个波段,波段1-5和波段7的空间分辨率为30米,波段6(热红外波段)的空间分辨率为120米。
南北的扫描范围大约为170km,东西的扫描范围大约为(三)Landsat1-5MSS1、产品描述LandsatMSS是由Landsat1-5卫星携带的传感器,他几乎获得了1972年7月至1992年10月期间的连续地球影像。
Landsat-1,Landsat-2,andsat-3每18天扫瞄同一地区,即其18天可以覆盖全球一次。
Landsat-4和Landsat5每16天扫瞄同一地区。
LandsatMSS影像数据有四个波段(如下),所有波段的分辨率为79米,南北的扫描范围大约为170km,东西的扫描范围大约为183km。
二、常用波段组合:(一)321:真彩色合成,即3、2、1波段分别赋予红、绿、蓝色,则获得自然彩色合成图像,图像的色彩与原地区或景物的实际色彩一致,适合于非遥感应用专业人员使用。
STK10的新特性
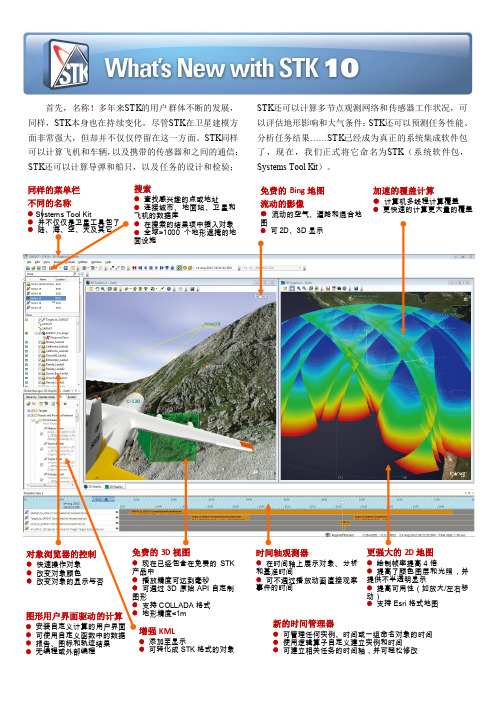
STK还可以计算多 节点观测网络和 传感器工作状况,可 以评估地形影响和大气条件;STK还可以预测任务性能、 分析任务结果……ST K已经成为真正的系统集成软件包 了 , 现 在 , 我 们正 式 将 它 命 名为 STK( 系 统 软 件包 , Systems Tool Kit)。
北京三信时代信息公司
地址:北京市海淀区西三环北路27号 北科大厦7层西侧(100089) 电话:010-51659322 18611927561 Email: lptiger@126.com Website: www.ciii.com.cn
3D 显示的增强——现在的 3D 地图可实现单像素光照、COLLADA FX 模式,支持<1m 地形,你可以看到一个 更加真实的 3D 世界。相比较原来使用单顶点光照的版本,STK 10 下的地球、地形和模型在光影下更加柔和。同 时,支持 COLLADA FX 模式使得任何模型表面在光影下更加栩栩如生。 覆盖品质因子外形显示的增强——我们彻底增强了覆盖品质因子(FOM)显示的效率和弹性。覆盖 FOM 外形可 以和动画一同显示在任何表面上(在地球表面、覆盖在地形上、或者在任意高度的一处表面上),可以以块状或 平滑填充模式显示,而且极大的提升了现实的帧率。
我们重组了STK,以适 应不同用户使用领域之 间的差异。新版本是 一个综合了陆、海、 空、天各系统的大系统 工具包,这一系统为我们提供了大量的数据,同 时建立了集建模、分析、可视化 为一体的构架来评估这一庞杂 系统 的任务效能。
MO概述及MO程序设计入门

IMPELL
BIL
IMPELL bitmap
Band interleaved by line
*.rls
*.bil
*.rlw
*.blw
BIP BSQ
Band interleaved by pixel Band sequential
*.bip *.bsq
*.bpw *.bqw
数据表
在基于MapObjects编写的应用程序中,通过ODBC(开 放数据库连接)驱动程序,可以访问外部的数据表,
ActiveX 自动对象——通过ActiveX 自动操作接口,提 供给其它应用程序或编程工具使用的一种对象。
MO的组成
数据访问对象: 存取地图数据库的一组对象 地图显示对象: 用来显示电子地图及符号化地图要素 的一组控件(Map,Legend,ScaleBar)和对象 几何对象:点,线,面等用来与图层要素进行互操作的对 象
ESRI MapObjects 控件
安装 ESRI MapObjects
可在这里下载到最新版本的MapObjects 产品(试 用期3个月)
• /software/mapobjects/download.h tml
• 在下载之前需要注册一个用户帐号,但注册是免费 的.
帮助系统 中的例子 代码
添加地图控件及数据
Map控件用来显示地图,将地图控件放置到窗体上 1. 双击工具箱上的地图控件按钮来将新地图控件 增加到窗体中 2. 调整地图控件的尺寸使其充满窗体
你可以通过地图控件的属性页上的属性设置功能,指定 将被显示在地图上的数据 1. 在地图控件上方点击右键,出现右键菜单. 2. 在出现的右键菜单中选择“Properties„”命令,以 显示地图控件的属性页。
ESRI ArcGIS Pro 3.1 用户指南说明书
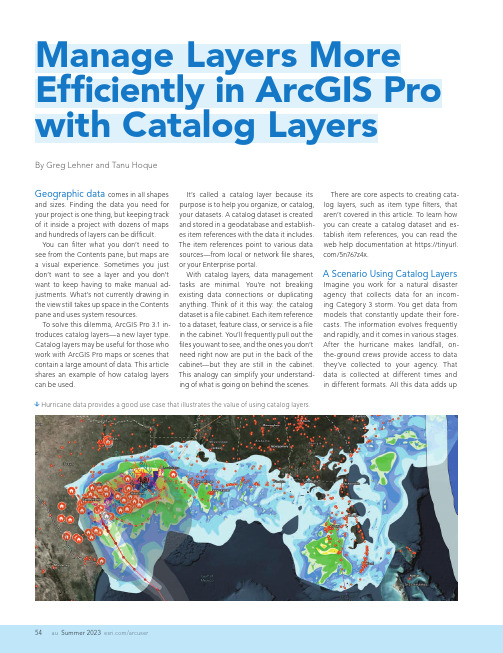
Summer 2023 /arcuserGeographic data comes in all shapesand sizes. Finding the data you need for your project is one thing, but keeping track of it inside a project with dozens of maps and hundreds of layers can be difficult.You can filter what you don’t need to see from the Contents pane, but maps are a visual experience. Sometimes you just don’t want to see a layer and you don’t want to keep having to make manual ad-justments. What’s not currently drawing in the view still takes up space in the Contents pane and uses system resources.To solve this dilemma, ArcGIS Pro 3.1 in-troduces catalog layers—a new layer type. Catalog layers may be useful for those who work with ArcGIS Pro maps or scenes that contain a large amount of data. This article shares an example of how catalog layers can be used.By Greg Lehner and Tanu HoqueIt’s called a catalog layer because its purpose is to help you organize, or catalog, your datasets. A catalog dataset is created and stored in a geodatabase and establish-es item references with the data it includes. The item references point to various data sources—from local or network file shares, or your Enterprise portal.With catalog layers, data management tasks are minimal. You’re not breaking existing data connections or duplicating anything. Think of it this way: the catalog dataset is a file cabinet. Each item reference to a dataset, feature class, or service is a file in the cabinet. You’ll frequently pull out the files you want to see, and the ones you don’t need right now are put in the back of the cabinet—but they are still in the cabinet. This analogy can simplify your understand-ing of what is going on behind the scenes.â Hurricane data provides a good use case that illustrates the value of using catalog layers.There are core aspects to creating cata-log layers, such as item type filters, that aren’t covered in this article. To learn how you can create a catalog dataset and es-tablish item references, you can read the web help documentation at https:///5n767z4x.A Scenario Using Catalog LayersImagine you work for a natural disaster agency that collects data for an incom-ing Category 3 storm. You get data from models that constantly update their fore-casts. The information evolves frequently and rapidly, and it comes in various stages. After the hurricane makes landfall, on-the-ground crews provide access to data they’ve collected to your agency. That data is collected at different times and in different formats. All this data adds upManage Layers More Efficiently in ArcGIS Pro with Catalog LayersSummer 2023auHands Onquickly. Every piece of data is important, but consuming all this data is a different story. Everyone involved in collecting, ed-iting, and uploading the data has done their work, but now you must make some-thing from it.The file cabinet is overflowing—but you can manage it. In any map with a catalog layer, one of the two sublayers you will see is a Footprints layer. When the catalog dataset is created, it builds convex hull polygons of each item’s footprint and puts them into one feature layer. The footprints show the spatial extent of every item (like the footprints in a mosaic dataset). Any given layer’s spatial extent isn’t immedi-ately clear when looking at a geodatabase or a service layer in a file directory.If you right-click the catalog layer in the Contents pane and open its attribute table, you will see that each item is a record in the table. The Item Source field stores the path of the item. Meanwhile, the Item Type field tells you what kind of data it is. It’s like áá The Footprints layer shows the extent of each sublayer.á When viewing the catalog layer’s attribute table, you will see that each item is a record in the table. The Item Source field stores the pathof the item. The Item Type field tells you what kind of data it is.the files in your file cabinet tell you what’s inside without needing to open them. The other fields you see are detailed in the help documentation. You can also add fields. The second layer in the catalog layer’s structure is named Layers In View. It is a composite sublayer that does exactly what the name implies. Catalog layers dynamically load layers in your map based on spatial, tem-poral, or range filters. If an item in your cata-log layer is in view, it is listed in the Contents pane under the Layers In View heading.Summer 2023/arcuserItems in the catalog layer appear in the Contents pane as you pan around the map. But which layers get drawn? That’s where the Feature Order Weight field in the cata-log layer attribute table comes into play. Feature drawing order was introduced with the release of ArcGIS Pro 3.1. Catalog layers are included as one of the default fields. You can edit which items are drawn on top by giving them a larger value—like keeping your most important files toward the front of the file cabinet.There are other ways to limit what gets drawn as well. You can modify the layer limit, or you can also set scale ranges for each item in your dataset. These settings will be reflected in your map as you change scales. Lastly, the contents of a catalog dataset include feature classes, BIM files, and LAS datasets. Because each of these items are references to the data—not the actual items—there are limitations with what you can do with them. In almost all cases, con-sider catalog layer contents as read-only. That means you cannot view a sublayer’s at-tribute table, make edits to its features, or make changes to the symbology.However, there is one solution. You can right-click any item reference in the catalog layer and choose Make Layer from Catalog D ataset Item. This builds the item as a separate layer in your map with all the func-tionality that normally comes along with it.Meanwhile, the item remains a member of the catalog dataset.TakeawaysTo summarize, consider adding catalog layers into your current workflows. Read the help documentation (https:///5n767z4x) to learn more, and share your thoughts or use cases on the ArcGIS Pro page on Esri Community (https:///2p8yvn94).About the AuthorsGreg Lehner is a product engineer for the mapping team on ArcGIS Pro. His interests include cartography, symbology, data visualization, and technical writing. He is a Wisconsin native and started his Esri jour-ney in 2013.T anu Hoque is a product engineer on Esri's mapping team, focusing on map service, print service, and ArcGIS Pro. He also works on spatiotemporal analysis, spatial aggregation, and real-time data. Hoque’s background includes earning a master’s degree in urban planning from the University of Akron, Ohio, and a bachelor’s degree from Khulna University, Bangladesh. Prior to coming to Esri, he worked as GIS coordinator for the City of West Springfield, Massachusetts, and a GIS specialist in a hydrology modeling center in Bangladesh.á Make Layer From Catalog Dataset Itembuilds and adds the selected sublayer to the map with normal functionality, while the item remains a member of the catalog dataset.á Use a definition query to filter catalog layer data by category to display only the items ofinterest and limit what gets drawn in the view. In this case, only Hurricane Irma data is displayed.。
二级GIS信息工程师考试试题
二级GIS信息工程师考试试题一、单选题1、在现代地理信息系统中,空间数据是应用最广泛的数据类型,下列关于空间数据库的描述中错误的是:(B)A、空间数据库所存储的数据量一般都比较大,通常会达到GB级别,甚至TB级别。
B、空间数据库中仅存放着大量的空间数据。
C、商用关系型数据库管理系统Oracle也可作为空间数据库使用。
D、空间数据库有多种连接方式,如本地连接,ODBC连接等。
2、把GIS分为专题地理信息系统、区域地理信息系统与地理信息系统工具是按______划分。
(C)A、数据容量B、用户类型C、内容D、用途3、根据应用层次的高低,应用型GIS可分为:(C)A、空间管理信息系统、空间事务处理系统、空间决策支持系统B、空间管理信息系统、空间数据处理系统、空间决策支持系统C、空间事务处理系统、空间管理信息系统、空间决策支持系统D、空间数据处理系统、空间管理信息系统、空间决策支持系统4、在GIS项目开发时,深刻理解客户需求很关键。
以下不属于客户需求的特征的是:(C)A、客户需求很难系统化B、客户需求是一个逐渐清晰化的过程C、客户需求不会产生冲突D、客户需求经常发生遗漏5、在GIS项目投标中,项目投标人的下列投标行为中不违反招标投标法的是:(D)A、相互窜通投标报价B、以其他人名义投标C、投标人以低于成本的报价竞标D、法人联合体以一个投标人的身份共同投标6、IPv6地址的长度为:(D)A、32位B、48位C、64位D、128位7、下列有关GIS在监测森林火灾中的应用,说法正确的是:(A)A、及时了解火灾发生的地点、范围,分析火势蔓延方向,制定灭火方案。
B、用来分析,判断引起火灾的原因。
C、通过GIS的分析功能,预测森林火灾的发生地点。
D、由于GIS拥有数据库和数据管理功能等,可以很方便地在空间,属性数据的基础上建立预测,决策模型。
通过对各种过程进行模拟,比较合评价,选择出最优决策方案,所以GIS可以代替决策者成为完全智能化的火灾监测系统。
遥感及其相关术语中英文对照
遥感及其相关术语中英文对照AAddress matching 一种用来在两个使用地址的文件将进行关联的机制。
地理坐标和属性可以从一个地址转换成另一个。
举例来说,一个学生包含地址的文件可以映射到一个街道图层上,该图层包含了学生居住点的点图层的地址。
ADS 弧段数字化系统。
一种数字化和编辑的简单系统,用来向图层上添加弧段和标签点。
Aerophotograph 航片Aerophotographical Scale 航空摄影比例尺Allocation 在最大阻抗或资源容量范围内于网络终止拍到最近中心的弧段的过程。
AM/FM 是英文Automated Mapping/Facilities Management的缩写,是一种基于地理信息上的设备和生产技术管理的计算机图文交互系统,也是一种将图形技术与数据库管理技术相结合的计算机应用软件系统,采用AM/FM系统,能实现输配电网络系统的规划、建设、报装、调度、运行、检修和营业用电的计算机辅助管理,是目前在公共事业单位对分散设备(相对发电厂、钢厂等在地理上相对集中的集中设备而言)进行计算机辅助管理的先进、实用和理想的应用软件系统。
AM/FM系统是在地理信息系统(GIS)的基础上,根据设备工程管理的需要和生产技术管理的要求而开发的一种用于生产运行单位的新的信息管理系统,在很多场合也用AM/FM/GIS来代表AM/FM系统。
Annotation 注释1.对图层特征物进行描述的文本,用来显示而不用于分析.2.在图层中用来标签其他特征物的一个特征类。
其信息包含一个字符串,字符串显示位置和文本特征信息(颜色,字体,大小等)。
又见 TAT。
ANSI 美国国家标准组织是一个全国性的标准化协调组织。
也是一个批准与撤消公认标准的组织,ANSI 与国际标准组织关系密切,尤其是ISO,共同致力于发展国际标准,因其在当今社会的方方面面的影响,他们在SQL 与空间扩展SQL方面的工作引起了GIS 界的极大关注。
一种卫星固定业务上行频段无授权接入方案
摘 要 :为了提高卫星固定业 务上行频段的频谱利用效率 , 出了一种无授权接人该 频段 的方案. 提 利用卫 星的“ 空 闲” 信道构建认知无线 电业务信道 , 同时采用宽带扩频信号 , 构建具有较低功率谱密度和较强抗 干扰 能力的公共协 调信道. 给出 了 A o dH e和星型两种基本的无授权接入模型 , 重点分 析 了认知无 线电对卫星 可能造成的 干扰 . 理论 分析 和仿真结 果表 明, 众多感知用户 可以利用该方 案, 以低于 l %的干扰概率避免对卫 星接 收机 造成有害 干扰 , 实
Z A uw n , Z O h-e , MI O Z i i H O L — e H U Z ii j A h. n m
( .Istt o o ui t nE gnei , 1 ntu i e fCmm n ai nier g c o n
2 ntue o m n uo t n .Istto C m a A tm i , i f d a o
A s a t I re rv eset m uaeo eu —ad o x dst lesri bt c : nod roi oet p c u sg fh pbn f e ae i ev e( S ) n u l esd r t mp h r t i f lt c F S ,a ni ne c
维普资讯
第2卷 第3 6 期
20 0 8年 5月
应
用
科
学
学
报
V 1 6 N .3 o .2 o Ma 0 8 V2 o
J R A FA P I DS IN E —l t nc n nom t nE gneig OU N LO P LE C E C SEe r i a dIf ai n i r co s r o e n
卫星SAR数据读取与保存方法与软件实现
卫星SAR 数据读取与保存方法研究与软件实现刘元廷,赵朝方,王志雄,马佑军(中国海洋大学海洋遥感研究所,山东青岛266100)摘要:基于GDAL 、OpenGL 、TinyXML 和HDF5等开源库,对目前主要的卫星SAR 传感器-ENVISAT 、ERS 、Radarsat 、TerraSAR-X 、CosmoSkyMed 产品的数据及其属性进行读取、显示和保存的关键技术研究及其软件实现。
对自主研发SAR 数据处理软件的开发有一定的参考和借鉴意义。
关键词:SAR ;GDAL ;HDF5;读取保存中图分类号:TP311文献标识码:A文章编号:1674-6236(2012)23-0063-04Methods research and software implementation of data reading and saving for SARLIU Yuan -ting ,ZHAO Chao -fang ,WANG Zhi -xiong ,MA You -jun(Ocean Remote Sensing Institute ,Ocean University of China ,Qingdao 266100,China )Abstract:Based on GDAL ,OpenGL ,TinyXML ,HDF5and other open source libraries ,the article researches the key technology and software implementation about reading ,displaying and saving data along with its attributes from the main satellite SAR sensors such as ENVISAT ,ERS ,Radarsat ,TerraSAR -X and CosmoSkyMed.The paper has reference value for independent researching and developing software for SAR data processing.Key words:SAR ;GDAL ;HDF5;reading saving收稿日期:2012-08-23稿件编号:201208120作者简介:刘元廷(1987—),男,山东安丘人,硕士研究生。
- 1、下载文档前请自行甄别文档内容的完整性,平台不提供额外的编辑、内容补充、找答案等附加服务。
- 2、"仅部分预览"的文档,不可在线预览部分如存在完整性等问题,可反馈申请退款(可完整预览的文档不适用该条件!)。
- 3、如文档侵犯您的权益,请联系客服反馈,我们会尽快为您处理(人工客服工作时间:9:00-18:30)。
ERS卫星
一.卫星简介
ERS-1欧空局于1991年发射。携带有多种有效载荷,包括侧视合成
孔径雷达(SAR)和风向散射计等装置),由于ERS-1采用了先进的
微波遥感技术来获取全天候与全天时的图象,比起传统的光学遥感图
象有着独特的优点。随着欧洲遥感卫星(ERS)和美国防卫气象卫星
计划(DMSP)的全球观测,星载微波遥感取得了很大的进展.ERS
-l和ERS-2上载有C波段(5.3Gth)垂直极化主动散射计,其3
个天线沿卫星飞行方向分别成前向45"、侧向和后向45",视角从180
到57"空对地测量后向散射系数 .
卫星采用法国Spot.I和Spot一Ⅱ卫星使用的MK-1平台,装载了C波段
SAR,天线波束指向固定,并采用w极化方式,可以获得30 m空间分辨
率和100 km观测带宽的高质量图像。
二.卫星参数:
椭圆形太阳同步轨道
轨道高度:780公里
半长轴:7153.135公里
轨道倾角:98.52o
飞行周期:100.465分钟
每天运行轨道数:14 -1/3
降交点的当地太阳时:10:30
空间分辨率:方位方向<30米
距离方向<26.3米
幅宽:100公里
三.合成孔径雷达(SAR)介绍
由于其技术特点而受到普遍重视,成为军、民两用普遍关注和重点发
展的遥感设备。星载SAR不受气象和光照条件的限制,能实现全天时、
全空域、大面积、高分辨对地观测,在农、林、地质、水域等民用领
域具有广泛的应用前景,尤其是在军用测绘、情报侦察等方面具有独
特的优点。
以下是各国主要合成孔径雷达卫星参数简表
图表 1 各国主要合成孔径雷达卫星参数简表
四.ESR-1地面系统的构成:
! % 卫星任务管理控制中心MMCC
2 % 测控站TTC
3% 数据采集处理站DAPF
4 % 数据处理归档站PAF
5. 独立台站
6.用户
五卫星应用
A.遥感技术在防洪抗旱领域中的应用
实践证明,卫星遥感在减轻洪涝灾害损失方面是可以发挥重大作用的,
特别是在降水遥感监测、洪水灾情监测与评估、紧急救灾和灾后重建,
以及区域旱情监测与评估等方面,卫星提供的灾情信息比其他常规手
段有着更快速、客观和全面等优越。
以下是遥感技术监测洪水灾害适宜性分析
图表 2 遥感技术监测洪水灾害适宜性分析
在旱灾的监测评估方面,国外开始采用多种遥感数据源,包括雷达遥
感进行旱情的监测与预警。在国内,在旱情遥感监测评估方面已初步
具备了建立旱情遥感监测评估业务运行系统的条件和能力,并在部分
地区的到了试点应用。
B. 遥感在水资源管理调度和生态保护中的应用
(1)土地利用状况分析
(2)生态环境变迁分析
(3)生态耗水分析
(4)水资源评价
(5)精细农业灌溉系统的应用
C.遥感在水土保持规划和治理工作中的应用
D.遥感在湖泊水库河流水环境监测的应用
E.遥感在水利工程建设与管理等其他业务应用
(1)河道动态变化的遥感监测
(2)水利工程建设环境影响分析评价
(3)大型水利工程的建设施工的跟踪监测
存在问题和展望
近年来投入应用的SAR 遥感数据有加拿大的Radarsat、欧空局的
ENVISAT、日本的ALOS、ADEOS-2 等。对于不同类型SAR数据的
处理方式和信息提取很难寻找普遍适用的模型,需要分别对各种类型
的数据进行研究。需要对地面上不同洪涝灾害类型在SAR 影像上的
表现特征应着重研究。由于欧空局ENVISAT 具有多极化和多入射角
成像能力,将是今后重点研究对象。除了SAR 以外,EOS的MODIS 遥
感数据源也是项目进行洪涝灾害遥感监测的重要数据源。MODIS 数
据具有高时间分辨率、监测范围大等特点,可以弥补SAR 数据在时
间分辨率上的不足。
遥感信息资源共享已经成为一个必然的发展趋势,欧空局已经建立了
遥感卫星地面段管理中心(ESRIN),协调欧洲国家地面站建设,实
现遥感数据资源的共享。根据我国民用航天“十五”计划和10 年规
划的思路,将发展风云三号极轨气象卫星、风云四号静止气象卫星、
海洋卫星、资源卫星和环境与灾害卫星系列,对地观测的信息资源将
极大丰富。目前需要建立国家和行业的应用和信息共享机制。水利领
域则应加强水利部与流域或地方水利管理机构的信息资源平台建设。