Colorscope Inc Solution - Final Draft
第一章final
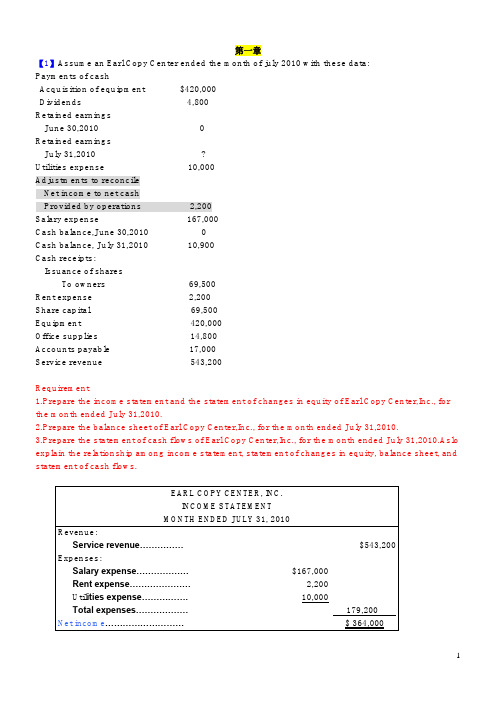
1 第一章 【1】Assume an Earl Copy Center ended the month of july 2010 with these data: Payments of cash Acquisition of equipment $420,000 Dividends 4,800 Retained earnings June 30,2010 0 Retained earnings July 31,2010 ? Utilities expense 10,000 Adjustments to reconcile Net income to net cash Provided by operations 2,200 Salary expense 167,000 Cash balance,June 30,2010 0 Cash balance, July 31,2010 10,900 Cash receipts: Issuance of shares To owners 69,500 Rent expense 2,200 Share capital 69,500 Equipment 420,000 Office supplies 14,800 Accounts payable 17,000 Service revenue 543,200
Requirement 1.Prepare the income statement and the statement of changes in equity of Earl Copy Center,Inc., for the month ended July 31,2010. 2.Prepare the balance sheet of Earl Copy Center,Inc., for the month ended July 31,2010. 3.Prepare the statement of cash flows of Earl Copy Center,Inc., for the month ended July 31,2010.Aslo explain the relationship among income statement, statement of changes in equity, balance sheet, and statement of cash flows.
达肝素钠标准(USP 39)

Ratio: A240/A445, 1.30–1.50for Labeling 〈7〉, Labels and Labeling for Injectable Prod-•B. The retention time of the major peak of the Sample ucts•(CN 1-May-2016).solution corresponds to that of the Standard solution, asADDITIONAL REQUIREMENTS obtained in the Assay.ASSAYChange to read:•P ROCEDURE[N OTE—Use freshly prepared Standard solution and Sam-•P ACKAGING AND S TORAGE:•Preserve as described in Pack-ple solution, protected from light.]aging and Storage Requirements 〈659〉, Injection Packaging, Mobile phase: Acetonitrile and water (3:2)Sterile solids packaging; protect from light.•(CN 1-May-2016).Standard solution: 250µg/mL of USP Dactinomycin RS•L ABELING: Label it to include the statement “Protect from in Mobile phaselight.”Sample solution: 250µg/mL of dactinomycin from•USP R EFERENCE S TANDARDS〈11〉Dactinomycin for Injection diluted with Mobile phase.USP Dactinomycin RSFilter, if necessary, to obtain a clear solution. [N OTE—USP Endotoxin RSPrepare the solution by adding a suitable aliquot of Mo-bile phase to one container of Dactinomycin forInjection.]Chromatographic system(See Chromatography 〈621〉, System Suitability.)Mode: LC Add the following:Detector: UV 254 nmColumn: 3.9-mm × 30-cm; packing L1Flow rate: 2.5mL/minv Dalteparin SodiumInjection size: 10µLSystem suitability [9041-08-1].Sample:Standard solution[N OTE—The retention time for dactinomycin is 6 min.]Suitability requirementsColumn efficiency: NLT 1200 theoretical platesTailing factor: NMT 2Relative standard deviation: NMT 3.0%AnalysisSamples:Standard solution and Sample solutionCalculate the percentage of C62H86N12O16 in the por-tion of Dactinomycin for Injection taken:Result = (r U/r S) × (C S/C U) × 100r U= peak response from the Sample solutionr S= peak response from the Standard solutionC S= concentration of USP Dactinomycin RS in theStandard solution (µg/mL)DEFINITIONC U= nominal concentration of dactinomycin in the Dalteparin Sodium is the sodium salt of a low molecularSample solution (µg/mL)weight heparin obtained by nitrous acid depolymerization Acceptance criteria: 90.0%–120.0%of heparin from porcine intestine or intestinal mucosa.Heparin source material used in the manufacture of SPECIFIC TESTSDalteparin Sodium complies with the compendial require-•P H 〈791〉: 5.5–7.5, in the solution constituted as directedments stated in the Heparin Sodium monograph.in the labelingDalteparin Sodium is produced by a validated manufac-•L OSS ON D RYING〈731〉: Dry a portion in vacuum at aturing and purification procedure under conditions shown pressure not exceeding 5mm of mercury at 60° for 3 h:to minimize the presence of species containing the N–NO it loses NMT 4.0% of its weight.group. The majority of the components have a 2-O-sulfo-α-L-idopyranosuronic acid structure at the non-reducing Change to read:end and a 6-O-sulfo-2,5-anhydro-D-mannitol structure atthe reducing end of their chains. The weight-average mo-•O THER R EQUIREMENTS: It meets the requirements under lecular weight (M w) ranges between 5600 Da and 6400•Injections and Implanted Drug Products 〈1〉•(CN 1-May-2016).Da, with a characteristic value of about 6000 Da. The •B ACTERIAL E NDOTOXINS T EST〈85〉: NMT 100.0 USP Endo-percentage of chains lower than molecular weight 3000 toxin Units/mg of dactinomycin.Da is NMT 13.0%, and the percentage of chains higher •S TERILITY T ESTS〈71〉: Meets the requirements when than molecular weight 8000 Da ranges between 15.0% tested as directed for Test for Sterility of the Product to be and 25.0%. The degree of sulfation is NLT 1.8/disaccha-Examined, Membrane Filtration, each container being con-ride unit. The potency is NLT 110 and NMT 210 Anti-stituted aseptically by injecting Sterile Water for Injection Factor X a International Units (IU)/mg of activity, calculated through the stopper, and the entire contents of all the on the dried basis. The anti-factor IIa activity is NLT 35 containers being collected aseptically with the aid of IU/mg and NMT 100 IU/mg, calculated on the dried ba-200mL of Fluid A before filtering.sis. The ratio of anti-factor Xa activity to anti-factor IIaactivity is between 1.9 and 3.2.Change to read:IDENTIFICATION•A.1H NMR S PECTRUM•C ONSTITUTED S OLUTION: At the time of use, it meets the Standard solution: Dissolve 15mg of USP Dalteparin requirements for •Injections and Implanted Drug Products Sodium RS in 0.7mL of deuterium oxide with deuter-〈1〉, Specific Tests, Completeness and clarity of solutions and ated trimethylsilylpropionic (TSP) acid sodium salt. Thesample is freeze-dried to remove exchangeable P MonographsRedissolve the sample and repeat the freeze-drying step centage of chains lower than the molecular weight twice more before transferring the sample into an NMR3000 Da (M3000) is NMT 13.0%, and the percentage of tube.chains higher than the molecular weight 8000 Da Sample solution: Dissolve 15mg of Dalteparin Sodium(M8000) ranges between 15.0% and 25.0%.in 0.7mL of deuterium oxide (99.9%) with deuterated•C. A NTI-F ACTOR X A TO A NTI-F ACTOR II A R ATIOTSP. The sample is freeze-dried to remove exchangea-(See Anti-Factor Xa and Anti-Factor IIa Assays for Unfrac-ble protons. Redissolve the sample and repeat the tionated and Low Molecular Weight Heparins 〈208〉, Anti-freeze-drying step twice more before transferring the Factor Xa and Anti-Factor IIa Assays for Low Molecular sample into an NMR tube.Weight Heparins.)Instrumental conditions Acceptance criteria: The ratio of the numerical value of (See Nuclear Magnetic Resonance Spectroscopy 〈761〉.)the anti-factor Xa activity, in Anti-Factor X a IU/mg, to Mode: NMR, pulsed (Fourier transform)the numerical value of the anti-factor IIa activity, in Frequency: NLT 500MHz for 1H Anti-Factor II a IU/mg, as determined by the Anti-Factor Temperature: 30°Xa Activity and Anti-Factor IIa Activity assays, is NLT 1.9 System suitability and NMT 3.2, respectively.Samples:Standard solution and Sample solution•D. I DENTIFICATION T ESTS—G ENERAL: Meets the require-Transfer the Standard solution and the Sample solution to ments for Sodium ContentNMR tubes of 5mm in diameter. Using a pulsedASSAY(Fourier transform) NMR spectrometer operating at•A NTI-F ACTOR X A A CTIVITYNLT 500MHz for 1H, acquire a free induction decay(See Anti-Factor Xa and Anti-Factor IIa Assays for Unfrac-(FID) with NLT 32 scans using a 90° pulse, an acquisi-tionated and Low Molecular Weight Heparins 〈208〉, Anti-tion time of NLT 2 s, and at least a 10-s delay. ForFactor Xa and Anti-Factor IIa Assays for Low Molecular each sample, an initial short spectrum is collected (1Weight Heparins, Anti-Factor Xa Activity for Low Molecular scan), and the water resonance is then suppressed byWeight Heparin.)selective irradiation during the relaxation delay. FinalAnalysis: Proceed as directed in the chapter.spectra are recorded over 32 scans. For all samples,Acceptance criteria: The potency is NLT 110 and NMT the TSP methyl signal should be set to 0.00ppm. Re-210 Anti-Factor X a IU/mg on the dried basis.cord the 1H NMR spectrum of the Standard solution.Collect the 1H NMR spectrum with a spectral window OTHER COMPONENTSof at least 10 to −2ppm and without spinning. The•N ITROGEN D ETERMINATION, Method II 〈461〉: 1.5%–2.5% Standard solution shall be run at least daily when the on the dried basisSample solution is being run. All spectra are phased,•S ODIUM C ONTENTand linear baseline correction is applied to all spectra Cesium chloride solution: 1.27mg/mL of cesium chlo-before peak identification.ride in 0.1 M hydrochloric acidSuitability requirements Standard solution A: 0.0025% of sodium chloride in Chemical shift: The TSP methyl signal should be set Cesium chloride solutionto 0.00ppm for all samples.Standard solution B: 0.0050% of sodium chloride in Chemical shifts for system suitability: The ppm val-Cesium chloride solutionues for the methyl group of N-acetyl, the H-2 of N-Standard solution C: 0.0075% of sodium chloride in sulfo glucosamine, the H-2 of glucuronic acid plus Cesium chloride solution3-O-sulfo glucosamine, the H-1 of iduronic acid, and Sample solution: Transfer 50.0mg of Dalteparin So-the H-1 of 3-O sulfo glucosamine of dalteparin in the dium to a 100-mL volumetric flask, and dissolve in and Standard solution are present at 2.05, 3.28, 3.39,dilute with Cesium chloride solution to volume.5.01, and 5.51, respectively. Two additional signals,Analysiscorresponding to the H-1 of the 2-O-sulfo iduronic Samples:Cesium chloride solution, Standard solution A, acid linked to the terminal 2, 5-anhydromannitol and Standard solution B, Standard solution C, and Sample the H-1 of 2-O-sulfo iduronic acid are located at solution5.18–5.22ppm. The ppm values of these signals do Concomitantly determine the absorbances of the Ce-not differ by more than ±0.03ppm, Standard solution.sium chloride solution (blank), the Sample solution, and [N OTE—Depending on specific sample makeup and the Standard solutions at 330.3 nm, using a sodium instrument parameters, including the field strength hollow-cathode lamp and an air–acetylene flame. Us-of the NMR instrument, the two signals associated ing the absorbances of Standard solutions A, B, and C, with the H-1 of 2-O-sulfo iduronic acid at determine the sodium content in the Sample solution5.18–5.22ppm may appear well separated or as a after an appropriate blank correction.main signal with a shoulder.]Acceptance criteria: 10.5%–13.5% on the dried basis AnalysisSample:Sample solution IMPURITIESRecord the 1H NMR spectra of the Sample solution.•L IMIT OF N ITRITESAcceptance criteria: The ppm values for the methyl Mobile phase: Dissolve 13.6g of sodium acetate trihy-group of N-acetyl, the H-2 of N-sulfo glucosamine, the drate in 900mL of water in a 1000-mL volumetric flask.H-2 of glucuronic acid plus 3-O-sulfo glucosamine, the Adjust with orthophosphoric acid to a pH of 4.3, and H-1 of iduronic acid and the H-1 of the 2-O-sulfo dilute with water to 1000mL. Filter through a 0.45-µm iduronic acid linked to the terminal anhydromannitol,membrane.the H-1 of 2-O-sulfo iduronic acid and the H-1 of 3-O Nitrite stock standard solution: Dissolve 0.075g of so-sulfo glucosamine of dalteparin in the Sample solution dium nitrite in a 1000-mL volumetric flask with carbon are present at 2.05, 3.28, 3.39, 5.01, 5.18–5.22, and dioxide-free water (0.05g/L of nitrite).5.51, respectively. The ppm values of these signals do Nitrite standard solution: Dilute 1mL of Nitrite stocknot differ by more than ±0.03ppm.standard solution in a 100-mL volumetric flask with car-•B. M OLECULAR W EIGHT D ISTRIBUTION AND W EIGHT-A VERAGE bon dioxide-free water (500 ng/mL of nitrite).M OLECULAR W EIGHT Calibration standard solutions: Dilute Nitrite standard (See Low Molecular Weight Heparin Molecular Weight De-solution in carbon dioxide-free water to prepare four so-terminations 〈209〉.)lutions with the final nitrite concentrations of 2.5, 5, Acceptance criteria: The weight-average molecular15, and 25 ng/mL.weight (M w) ranges between 5600 Da and 6400 Da,with a characteristic value of about 6000 Da. The per-Sample solution: Weigh 80.0mg of Dalteparin Sodium r SA= response of boron from Standard solution A into a 20-mL volumetric flask, and dissolve in carbon r C= response of boron from the Calibration solution dioxide-free water.r B= response of boron from the BlankChromatographic system Acceptance criteria: NMT 1ppm(See Chromatography 〈621〉, System Suitability.)SPECIFIC TESTSMode: LC•A NTI-F ACTOR II A A CTIVITYDetector: Electrochemical detector containing a work-(See Anti-Factor Xa and Anti-Factor IIa Assays for Unfrac-ing electrode (glassy carbon type) with the potentialtionated and Low Molecular Weight Heparins, 〈208〉, Anti-of +1.00 V against a silver–silver chloride referenceFactor Xa and Anti-Factor IIa Assays for Low Molecular electrodeWeight Heparins, Anti-Factor IIa Activity for Low Molecular Column: 3-mm × 15-cm; 5-µm packing L92Weight Heparin.)Column temperature: 30±5°Acceptance criteria: NLT 35 and NMT 100 Anti-Factor Column regeneration: 1M sodium chloride (NaCl) atII a IU/mg on the dried basis0.5mL/min for about 1 h. After regeneration, wash•M OLAR R ATIO OF S ULFATE TO C ARBOXYLATE the column with water and re-equilibrate with MobileMobile phase: Carbon dioxide-free water phase.Sample solution: 50mg of Dalteparin Sodium in 10mL Flow rate: 0.5mL/minof carbon dioxide-free waterInjection volume: 25µLChromatographic systemRun time: 10 min(See Chromatography 〈621〉, System Suitability.) System suitabilityMode: LCSamples:Calibration standard solutions and SampleDetector: IonsolutionColumn: Two columns: one 1.5-cm × 2.5-cm column, Suitability requirementspacked with an anion-exchange resin L64packing, and Column efficiency: NLT 4000 theoretical plates forone 1.5-cm × 7.5-cm column, packed with a cation-the nitrite peak for all Calibration solutions and Sampleexchange resin L65packing.1 The outlet of the anion-solution runsexchange column is connected to the inlet of the cat-Tailing factor: Between 0.8 and 1.2 for all Calibrationion-exchange column.solutions and Sample solution runsFlow rate: 1mL/minRelative standard deviation: Inject Calibration stan-Analysisdard solutions with 25 ng/mL concentration at leastSample:Sample solutionsix times. Calculate the relative standard deviation %[N OTE—Regenerate the anion-exchange column and the (%RSD) of the nitrite peak areas of the last six injec-cation-exchange column with 1N sodium hydroxide tions. The %RSD is NMT 2%.and 1N hydrochloric acid, respectively, between two Analysisinjections.]Samples:Calibration standard solutions and SampleWith the valve in the inject position, inject the Sample solutionsolution into the anion-exchange column, and collect Plot the areas of the nitrite peaks from the chromato-the eluate from the cation-exchange column in a grams of the Calibration standard solutions against re-beaker at the outlet until the ion detector reading re-spective concentrations of nitrite. Draw a best-fit re-turns to the baseline value. Quantitatively transfer the gression line through the points. The correlationeluate to a titration vessel containing a magnetic stir-coefficient is NLT 0.995. Calculate the concentrationring bar, and dilute with carbon dioxide-free water to of nitrite from the areas of the nitrite peak in theabout 60mL. Position the titration vessel on a mag-chromatogram of the Sample solution.netic stirrer, and immerse the electrodes. Note the ini-Acceptance criteria: NMT 5ppmtial conductivity reading, and titrate with approxi-•B ORONmately 0.1 N sodium hydroxide added in 100-µL [N OTE—Use only plastic labware, avoid glass.]portions. [N OTE—Prepare the sodium hydroxide solu-Blank: 1% (v/v) solution of nitric acid in watertion in carbon dioxide-free water.] Record the buret Calibration solution: Prepare a 11.4-µg/mL solution ofreading and the conductivity meter reading after each USP Boric Acid RS in the Blank.addition of the sodium hydroxide solution.Standard solution A: Dissolve 0.2500g of USP LowPlot the conductivity measurements on the y-axis Molecular Weight Heparin for Boron Analysis RS inagainst the volumes of sodium hydroxide added on about 2mL of water, add 100µL of nitric acid, andthe x-axis. The graph will have three linear sections—dilute with the Blank to 10.00mL.an initial downward slope, a middle slight rise, and a Standard solution B: Dissolve 0.2500g of USP Lowfinal rise. For each of these sections, draw the best-fit Molecular Weight Heparin for Boron Analysis RS instraight lines using linear regression analysis. At the about 2mL of Blank, add 10µL of a 5.7-mg/mL solu-points where the first and second straight lines inter-tion of USP Boric Acid RS, and dilute with the Blank tosect and where the second and third lines intersect,10.00mL. This solution contains 1µg/mL of boron.draw perpendiculars to the x-axis to determine the Sample solution: Dissolve 0.2500g of Dalteparin So-volumes of sodium hydroxide taken up by the sample dium in about 2mL of water, add 100µL of nitric acid,at those points. The point where the first and second and dilute with the Blank to 10.00mL.lines intersect corresponds to the volume of sodium Analysishydroxide taken up by the sulfate groups (V S). The Samples:Blank, Calibration solution, Standard solutionpoint where the second and third lines intersect corre-A, Standard solution B, and Sample solutionsponds to the volume of sodium hydroxide consumed Boron is determined by measurement of the emissionby the sulfate and the carboxylate groups together from inductively coupled plasma (ICP) at 249.733 nm(V T).or a suitable wavelength. Use an appropriate appara-Calculate the molar ratio of sulfate to carboxylate: tus with settings that have been optimized as directedby the manufacturer.Result = V S/(V T−V S) Calculate the content of boron in Dalteparin Sodiumusing the following correction factor:1The procedure is based on analyses performed with two columns: one 1.5-cm × 2.5-cm packed with anion-exchange resin Dowex 1X8 (200–400 mesh)and the other 1.5-cm × 7.5-cm packed with cation-exchange resin DowexF = (r SB – r SA) × 2/(r C – r B)50WX2 (100–200 mesh).r SB= response of boron from Standard solution BAcceptance criteria: The molar ratio of sulfate to car-Percentageboxylate is NLT 1.8.Concentra-(%,•P H 〈791〉: 5.5–8.0 for a 1.0% solution in water tion for comparison•L OSS ON D RYING 〈731〉Standard (µg RS perwith test Sample: 1gsolutionDilution mL)specimen)Analysis: Dry the Sample under vacuum at 70° for 6 h.A (1 in 2)500 1.0Acceptance criteria: NMT 10%B (1 in 4)2500.5•B ACTERIAL E NDOTOXINS T EST 〈85〉: It contains NMT 0.01C (1 in 10)1000.2USP Endotoxin Unit/IU of anti-factor Xa activity.D(1 in 20)500.1ADDITIONAL REQUIREMENTS•P ACKAGING AND S TORAGE : Preserve in tight, light-resistant Test solution—Dissolve an accurately weighed quantity of containers, and store below 40°, preferably at room Danazol in Solvent to obtain a solution containing 50mg temperature.per mL.•L ABELING : Label to state the number of Anti-factor X a In-Procedure—Apply separately 5µL of the Test solution and ternational Units of activity per mg.5µL of each Standard solution to a suitable thin-layer chro-•USP R EFERENCE S TANDARDS 〈11〉matographic plate (see Chromatography 〈621〉) coated with USP Boric Acid RSa 0.25-mm layer of chromatographic silica gel mixture. Posi-USP Dalteparin Sodium RS tion the plate in a chromatographic chamber and develop USP Endotoxin RSthe chromatograms in a solvent system consisting of a mix-USP Low Molecular Weight Heparin for Bioassays RSture of cyclohexane and ethyl acetate (7:3) until the solvent USP Low Molecular Weight Heparin for Boron Analysis RS front has moved about three-fourths of the length of the USP Low Molecular Weight Heparin Molecular Weight plate. Remove the plate from the developing chamber, mark Calibrant RSthe solvent front, and allow the solvent to evaporate in v USP39warm, circulating air. Examine the plate under short-wave-length UV light. Expose the plate to iodine vapors for 5min-utes. Compare the intensities of any secondary spots ob-served in the chromatogram of the Test solution with those of the principal spots in the chromatograms of the Standard solutions: the sum of the intensities of secondary spots ob-Danazoltained from the Test solution corresponds to not more than 1.0% of related compounds, with no single impurity corre-sponding to more than 0.5%.Assay—Dissolve about 100mg of Danazol, accuratelyweighed and previously dried, in about 50mL of alcohol ina 100-mL volumetric flask, swirl until dissolved, dilute with alcohol to volume, and mix. Transfer 2.0mL of this solution C 22H 27NO 2337.46to a 100-mL volumetric flask, dilute with alcohol to volume,Pregna-2,4-dien-20-yno[2,3-d ]isoxazol-17-ol, (17α)-.and mix. Similarly, dissolve an accurately weighed quantity 17α-Pregna-2,4-dien-20-yno[2,3-d ]isoxazol-17-ol of USP Danazol RS in alcohol to obtain a Standard solution [17230-88-5].having a known concentration of about 20µg per mL. Con-comitantly determine the absorbances of both solutions in » Danazol contains not less than 97.0percent 1-cm cells at the wavelength of maximum absorbance at and not more than 102.0percent of C 22H 27NO 2,about 285 nm, using alcohol as the blank. Calculate the quantity, in mg, of C 22H 27NO 2 in the portion of Danazol calculated on the dried basis.taken by the formula:Packaging and storage—Preserve in tight, light-resistant containers.5C (A U /A S )USP Reference standards 〈11〉—in which C is the concentration, in µg per mL, of USPUSP Danazol RS Danazol RS in the Standard solution; and A U and A S are the Identification—absorbances of the solution of Danazol and the Standard A: Infrared Absorption 〈197K 〉.solution, respectively.B: Ultraviolet Absorption 〈197U 〉—Solution: prepared as directed in the Assay .Specific rotation 〈781S 〉: between +21° and +27°.Test solution: 10mg per mL, in chloroform.Danazol CapsulesLoss on drying 〈731〉—Dry it at a pressure not exceeding 5mm of mercury at 60° to constant weight: it loses not » Danazol Capsules contain not less thanmore than 2.0% of its weight.90.0percent and not more than 110.0percent of Chromatographic purity—the labeled amount of C 22H 27NO 2.Solvent—Prepare a mixture of chloroform and methanol (9:1).Packaging and storage—Preserve in well-closed contain-Standard solutions—Dissolve an accurately weighed quan-ers.tity of USP Danazol RS in Solvent to obtain a solution having USP Reference standards 〈11〉—a known concentration of 1mg per mL. Dilute quantita-USP Danazol RStively with Solvent to obtain Standard solutions having the Identification—Shake the contents of a sufficient number following compositions:of Capsules, equivalent to about 50mg of Danazol, with 50mL of chloroform, and filter. Evaporate the filtrate on a steam bath with the aid of a stream of nitrogen to dryness:the IR absorption spectrum of a potassium bromide disper-sion of the residue, previously dried, exhibits maxima at the。
肝素钠_usp33
Record the H NMR spectra of the Standard solution and System suitability solution at 25 . 1 Collect the H NMR spectrum with a spectral window of at least 10 to 2 ppm and without spinning. The number of transients should be adjusted until the signal-to-noise ratio of the Nacetyl heparin signal in the Standard solution is at least 1000/1 in the region near 2 ppm. The Standard solution shall be run at least daily when Sample solutions are being run. For all samples, the TSP methyl signal should be set to 0.00 ppm. The chemical shift for the Nacetyl resonance of heparin and oversulfated chondroitin sulfate in the System suitability solution should be observed at 2.05 ± 0.02 and 2.16 ± 0.03 ppm, respectively. Record the H NMR spectrum of the Sample solution at 25 . Draw a baseline from 8.00 ppm to 0.10 ppm. The ppm values for H1 of GlcNAc/GlcNS, 6S (signal 1), H1 of IdoA2S (signal 2), the H2 of GlcNS (signal 3), and the methyl of GlcNAc (signal 4) of heparin are present at 5.42, 5.21, 3.28 (doublet centered at 3.28 ppm), and 2.05 ppm, respectively.1 The ppm values of these signals do not differ by more than ±0.03 ppm. Measure the signal heights above the baseline of signal 1 and signal 2, and calculate the mean of these signal heights. Other signals of variable heights and ppm values, attributable to heparin and HOD, may be seen between signal 2 and 4.55 ppm. Residual solvent signals may be observed in the 0.10–3.00 range. Heparin Sodium must meet the requirements stated in Residual Solvents 467 . Suitability requirements Number of transients: Adjust until the signal-to-noise ratio of the N-acetyl heparin signal in the Standard solution is at least 1000/1 in the region near 2 ppm. Chemical shift: The TSP methyl signal should be set to 0.00 ppm for all samples. Chemical shifts (for the N-acetyl resonance of heparin and oversulfated chondroitin sulfate): Should be observed at 2.05 ± 0.02 and 2.16 ± 0.03 ppm, respectively, System suitability solution Analysis Sample: Sample solution Acceptance criteria: No unidentified signals greater than 4% of the mean of signal height of 1 and 2 are present in the following ranges: 0.10–2.00, 2.10–3.20, and 5.70–8.00 ppm. No signals greater than 200% signal height of the mean of the signal height of 1 and 2 are present in the 3.35–4.55 ppm for porcine heparin . • B. CHROMATOGRAPHIC IDENTITY Solution A: Dissolve 0.8 g of monobasic sodium phosphate dihydrate in 2 L of water and adjust with phosphoric acid to a pH of 3.0. Pass the solution through a filter membrane with pore sizes of 0.45 µm and degas before use. Solution B: Dissolve 0.8 g of monobasic sodium phosphate dihydrate and 280 g of sodium perchlorate monohydrate in 2 L of water and adjust with phosphoric acid to a pH of 3.0. Pass the solution through a filter membrane with pore sizes of 0.45 µm and degas before use. Mobile phase: See the gradient table below. Time (min) 0 60 61 Solution A (%) 80 10 80 Solution B (%) 20 90 20 Elution Equilibration Linear gradient Linear gradient
1 Gel Filtration凝胶过滤

12
Group separation
The media suitable for group separations:
5
2. Gel filtration is well suited for biomolecules that may be sensitive to changes in pH, concentration of metal ions or co-factors and harsh environmental conditions.
Sephadex G-10, G-25 and G-50 .
Sampling volume for group separation: Large
sample volumes up to 30% of the total column volume (packed bed) can be applied at high flow rates using broad, short columns. Figure 4 shows the elution profile (chromatogram) of a typical group separation.
The goal may be to isolate one or more of the
components, to determine molecular weight, or to analyze the molecular weight distribution in the sample.
磺达肝癸钠原料药USP38标准

Chromatographic systemAdd the following:(See Chromatography 〈621〉, System Suitability .)Mode: LCDetector: UV 254 nmvFondaparinux SodiumColumn: 4.6-mm × 25-cm; packing L1Flow rate: 1mL/min Injection size: 25µLSystem suitabilitySamples: System suitability solution and Standard solutionSuitability requirementsResolution: NLT 3.6 between folic acid related com-pound A (calcium formyltetrahydrofolate) and folic acid, System suitability solutionRelative standard deviation: NMT 2.0%, Standard solution C 31H 43N 3O 49S 8Na 101728.08Analysisα-D -Glucopyranoside, methyl O -2-deoxy-6-O -sulfo-Samples: Standard solution and Sample solution 2-(sulfoamino)-α-D -glucopyranosyl-(1→4)-O -β-D -Calculate the percentage of the labeled amount ofglucopyranuronosyl-(1→4)-O -2-deoxy-3,6-di-O -sulfo-folic acid (C 19H 19N 7O 6) in the portion of Tablets taken:2-(sulfoamino)-α-D -glucopyranosyl-(1→4)-O -2-O -sulfo-α-L -Result = (r U /r S ) × (C S /C U ) × 100idopyranuronosyl-(1→4)-2-deoxy-2-(sulfoamino)-, 6-(hy-drogen sulfate), decasodium salt;r U= peak area of folic acid from the SampleMethyl O -2-deoxy-6-O -sulfo-2-(sulfoamino)-α-D -glucopyra-solutionnosyl-(1→4)-O -β-D -glucopyranuronosyl-(1→4)-O -2-deoxy-r S = peak area of folic acid from the Standard3,6-di-O -sulfo-2-(sulfoamino)-α-D -glucopyranosyl-(1→4)-O -solution2-O -sulfo-α-L -idopyranuronosyl-(1→4)-2-deoxy-6-O -sulfo-C S = concentration of USP Folic Acid RS in the2-(sulfoamino)-α-D -glucopyranoside, decasodium salt Standard solution (mg/mL)[114870-03-0].C U = nominal concentration of folic acid in theDEFINITIONSample solution (mg/mL)Fondaparinux Sodium is the sodium salt of a syntheticAcceptance criteria: 90.0%–115.0%sulfated pentasaccharide anticoagulant based on the anti-PERFORMANCE TESTS thrombin binding moiety of heparin. It is synthesized •D ISSOLUTION 〈711〉from a natural source of chirally pure sugars (mono- and Medium: Water; 500mL di-saccharides). A range of coupling, (de)protection and Apparatus 2: 50 rpm functionalization reactions leads to crude fondaparinux so-Time: 45 mindium, which is further purified to yield the drug sub-Standard solution: Solution having a known concentra-stance. Fondaparinux Sodium contains NLT 95.0% and tion of USP Folic Acid RS, corrected for water content,NMT 103.0% of fondaparinux sodium, calculated on the in Mediumanhydrous and solvent-free basis. Fondaparinux Sodium is Sample solution: Filtered portion of the solution under a white to off-white powder.test, suitably diluted with the Medium if necessary IDENTIFICATIONAnalysis•A . 13C NMR S PECTRUMSamples: Standard solution and Sample solutionNMR reference: Dissolve in 1mL of deuterium oxide Proceed as directed in the Assay , making any necessary 20mg of (2,2,3,3-(d4)-3-(trimethylsilyl)propionic acid modifications.sodium salt (TSP), enriched to 98% deuterated or Calculate the percentage of the labeled amount of equivalent, as a chemical shift reference.folic acid (C 19H 19N 7O 6) dissolved:Standard solution: NLT 40mg/mL of USPResult = (r U /r S ) × (C S × D × V /L ) × 100Fondaparinux Sodium Identification RS in deuterium oxider U= peak area of folic acid from the SampleSample solution: NLT 40mg/mL of Fondaparinux So-solutiondium in deuterium oxide r S = peak area of folic acid from the StandardInstrumental conditionssolution(See Nuclear Magnetic Resonance 〈761〉.)C S = concentration of USP Folic Acid RS in theMode: NMR, pulsed (Fourier transform)Standard solution (mg/mL)Frequency: NLT 100MHz (for 13C)D = dilution factor for the Sample solution Temperature: 40°V = volume of Medium , 500mL System suitabilityL = label claim (mg/Tablet)Sample: Standard solutionTolerances: NLT 75% (Q ) of the labeled amount of folic Using a pulsed (Fourier transform) NMR spectrometer acid (C 19H 19N 7O 6) is dissolved.operating at NLT 100MHz for 13C, acquire a free in-•U NIFORMITY OF D OSAGE U NITS 〈905〉: Meet the duction decay (FID) using a 90° pulse and a 5-s delay.requirements Record the 13C NMR spectra of the NMR reference at 40°, and set the trimethylsilyl resonance to 0.0ppm.ADDITIONAL REQUIREMENTSCollect the 13C NMR spectrum with a spectral window •P ACKAGING AND S TORAGE : Preserve in well-closed of at least 235 to −10ppm with spinning at 20 Hz,containers.using line broadening of NLT 1. The number of tran-•USP R EFERENCE S TANDARDS 〈11〉sients should be adjusted until the signal-to-noise ratio USP Folic Acid RSof the signal for the C-1 in the β-D -glucopyra-USP Folic Acid Related Compound A RS nosyluronic acid ring of fondaparinux sodium in the Calcium formyltetrahydrofolate.Standard solution meets the suitability requirements.The Standard solution shall be run at least daily when the Sample solution is being run. The chemical shift forthe C-1 resonance of the β-D-glucopyranosyluronic Standard solution: 5.0mg/mL of USP Fondaparinux acid ring of fondaparinux sodium in the Standard solu-Sodium for Assay RS in water. Prepare in duplicate.tion should be observed at 103.9 ± 0.1ppm. Record Sensitivity check solution: 0.01mg/mL of USPthe 13C NMR spectrum of the Sample solution at 40°Fondaparinux Sodium for Assay RS in water from the using the same conditions.Standard solutionSuitability requirements Sample solution: 5.0mg/mL of fondaparinux sodium Number of transients: The signal-to-noise of the β-D-in water. Prepare in at least duplicate.glucopyranosyluronic acid ring of fondaparinux so-Blank: Waterdium in the Standard solution is at least 20/1 in the Chromatographic systemregion near 103.9ppm.(See Chromatography 〈621〉, System Suitability.)Chemical shift: The trimethylsilyl resonance for the Mode: LCNMR reference should be set to 0.0ppm, which acts Detector: UV 210 nmas an external calibration for all samples.Column: 4-mm × 25-cm; packing L46Chemical shifts for system suitability: The O-methyl Column temperature: 25°and two carbonyl carbons of fondaparinux sodium Flow rate: 1.0mL/minshould be observed at 58.2, 176.7, and 178.0ppm,Injection volume: 100µLall ± 0.3ppm, respectively, in the Standard solution.System suitabilityAnalysis Samples:System suitability solution, Standard solution, Sample:Sample solution Sensitivity check solution, and BlankAcceptance criteria: Resonances for fondaparinux so-Inject the Blank in duplicate, the Sensitivity check solu-dium should be observed at 58.2, 59.5, 60.5, 60.8,tion, and the System suitability solution. Inject the Stan-68.9, 69.2, 69.6, 98.9, 100.4, 101.1, 102.4, 103.9,dard solution at least six times consecutively.176.7, and 178.0ppm. The chemical shifts of these sig-Suitability requirementsnals do not differ by more than ±0.3ppm. Other sig-Specificity and baseline driftnals of variable heights and chemical shifts, attributable The chromatogram of the second Blank injection to fondaparinux sodium, may be seen between shows a baseline drift between 0.00 and 0.02 AU58.0–80.5ppm and 98.7–104.5ppm.over 30 min. If necessary, adjust the DMSO content •B. C HROMATOGRAPHIC I DENTITY of the Mobile phase until an acceptable baseline is Analysis: Proceed as directed in the Assay.achieved.Acceptance criteria: The retention time of the major The chromatogram of the second Blank injection does peak of the Sample solution corresponds to ±5% of that not contain peaks between 3.00 and 30.00 min.of the Standard solution.Signal-to-noise ratio: NLT 10 for the fondaparinux •C. S ODIUM D ETERMINATION peak in the chromatogram of the Sensitivity check Analysis: Proceed as directed in Sodium Determination.solutionAcceptance criteria: It meets the requirements.Chromatogram similarity: The chromatogram of theSystem suitability solution corresponds to that of the ASSAY chromatogram provided with USP Fondaparinux So-•P ROCEDURE dium System Suitability Mixture A RS.5 mM phosphate solution: Dissolve 0.210g of mono-Relative standard deviation: For six consecutive in-basic sodium phosphate dihydrate and 0.650g of diba-jections of the Standard solution, the calculated % sic sodium phosphate dihydrate in water, and dilute RSD of the area of the fondaparinux peak is NMT with water to 1000mL. pH of solution is approximately 2.0%. The retention time of the fondaparinux peak7.3.should be ±5% of the mean value. The calculated %Solution A: 15±10 ppm dimethylsulfoxide (DMSO) in RSD of the response factors for all replicate injections5 mM phosphate solution (1 in 67000, v/v). Filter before of the Standard solution is NMT 2.0%. The calculateduse.% RSD of the pooled response factors for all injec-Solution B: 2.0 M sodium chloride solution with 5 mM tions of the Standard solution is NMT 2.0%. The % phosphate solution RSD of the mean response factors for each duplicate Mobile phase: See Table 1.Standard solution is NMT 2.0%.[N OTE—Make adjustments to Solution A as necessary,Analysisand degas the Mobile phase and the sample before Samples:Standard solution and Sample solutionuse. Dissolved gas in the injected solution may lead to Inject the Standard solution at least six times consecu-baseline interference. Degassing of the Mobile phase is tively and the Sample solution in duplicate. Record the critical to obtain a suitable signal-to-noise ratio and chromatograms and measure the retention times and higher sensitivity. An eluant generator1 installed be-areas for the major peaks (excluding peaks before 3.00 tween the injector and the column may reduce the and after 30.00 min).baseline interference.]For each injection of the Standard solution, calculate aresponse factor (F R):Table 1F R = (C S/r S)Time Solution A Solution B(min)(%)(%)C S= concentration of fondaparinux sodium in the05050Standard solution (mg/mL)r S= peak response of fondaparinux sodium from 55050the Standard solution25595Calculate the mean response factor (F M) for each 30595duplicate injection, and determine the % RSD for the 355050peak areas of fondaparinux sodium (rS) for six 505050consecutive injections of the Standard solution.Using the mean response factor, calculate the System suitability solution: 5.0mg/mL of USP percentage of fondaparinux in the portion of sample Fondaparinux Sodium System Suitability Mixture A RS taken:1One suitable eluant generator is Dionex DEGAS EG40/50 (12×17 cm, thick-ness 2.2cm).Result (% w/w) = (F M× r U×D× 100)/WF M= mean response factor for each duplicateChromatographic systeminjection(See Chromatography 〈621〉, System Suitability .) r U = peak response of fondaparinux sodium in theMode: LCSample solutionDetector: Conductivity (range 200 µS, suppressor cur-D = dilution factor for the sample (mL)rent 300mA)W = weight of fondaparinux sodium taken toColumn: 4.6-mm × 5-cm; packing L23, coupled with a prepare the Sample solution (mg)neutralization micromembrane suppressor 2Acceptance criteria: 95.0%–103.0% on an anhydrous Regenerating solvent for the suppressor: Ultrapuri-and solvent-free basisfied water in a counter current direction Column temperature: Ambient OTHER COMPONENTS Flow rate: 1.0mL/min •S ODIUM D ETERMINATIONInjection volume: 50µL (See Spectrophotometry and Light-Scattering 〈851〉.)Run time: 24 min 2% Nitric acid solution: 21mL nitric acid diluted with System suitabilitywater to 1000mLSamples: Calibration standard solutions and Resolution Sodium solution: 1000ppm sodium in 2% Nitric acid solutionsolutionSuitability requirementsStandard solutions: Prepare Standard solutions contain-Resolution: NLT 2 between the chloride and nitrite ing 20, 30, 40, 50, and 60ppm of sodium ion from the ion peaks, Resolution solutionSodium solution , diluting with 2% Nitric acid solution .Response stability: ±5% between injections of 5ppm Sample solution: 0.3mg/mL of Fondaparinux Sodium of each of the Calibration standard solutions before in 2% Nitric acid solutionand after the Sample solutionAnalysis: Concomitantly determine the absorbances of Relative standard deviation: NMT 3% for NLT 5 in-the Sample solution and Standard solutions at 330.2 nm jections of 5-ppm Calibration standard solutions by using a sodium hollow-cathode lamp and anAnalysisair–acetylene flame. Using the absorbances of the Stan-Sample: Sample solutiondard solutions , determine the sodium content in the [N OTE —Regenerate the anion-exchange column for 15Sample solution after appropriate blank correction.min with 0.1 M sodium hydroxide after each injection Acceptance criteria: 11.5%–15.0% on the anhydrous of fondaparinux sample, followed by equilibration with and solvent-free basis Mobile phase for 21 min.]Inject 50µL of each of the Calibration standard solutions IMPURITIESand 50µL of the Sample solution in triplicate. The peak •F REE S ULFATE AND R ESIDUAL C HLORIDE D ETERMINATIONarea responses for the chloride and sulfate ion peaks in Mobile phase: 3 mM carbonate solution containing the chromatograms obtained with the Calibration stan-0.106g of sodium carbonate and 0.168g of sodium dard solutions show two peaks corresponding respec-hydrogen carbonate in 1000mL of watertively to chloride ions at a retention time of approxi-Standard solution 1: Dissolve 164.9mg of sodium mately 3.6 min and to sulfate ions at a retention time chloride in 80mL of water, and dilute with water to of approximately 14.1 min. The Calibration standard 100.0mL.solutions and the corresponding standard concentra-Standard solution 2: Dissolve 147.9mg of anhydrous tions are used to construct five-point calibration curves sodium sulfate in 80mL of water, and dilute with water for both chloride and sulfate ions. The concentrations to 100.0mL.of sulfate and chloride ions in the Sample solutions are Standard solution 3: Dilute 1.0mL of Standard solution calculated using the standard curves.1 with water to 100.0mL.Calculations: Calculate the free sulfate and residual Standard solution 4: Dilute 1.0mL of Standard solution chloride ion contents in % w/w of fondaparinux so-2 with water to 100.0mL.dium in the solution to be examined:Calibration standard solutions: Using appropriate volumes of the Standard solutions , prepare calibration Result = C S × F × (1/C U ) × 100standards as shown in Table 2.C S= concentration of the ion calculated from thequadratic calibration equation (µg/mL)Table 2F = conversion factor (µg/mL to mg/mL)Volume of Volume of C U = concentration of Fondaparinux Sodium in theSulfate Chloride Sample solution (mg/mL)Concentra-Solution Solution Final VolumeReport the average of the triplicate determinations.tion (mL)(mL)(mL)Acceptance criteria: NMT 0.30% free sulfate; NMT 5.0, Standard 10.0, Standard 0.5 ppm SO 4−21.0% chloride /1 ppm Cl −solution 4solution 3100.0•O RGANIC I MPURITIES0.50, Standard 0.50, Standard Analysis: Proceed as directed in the Assay .2.5 ppm SO 4−2/2.5 ppm Cl −solution 2solution 1200.0Samples: System suitability solution , Standard solution ,Sensitivity check solution , Sample solution , and Blank 0.50, Standard 0.50, Standard 5.0 ppm SO 4−2Calculate the percentage of each individual impurity in /5.0 ppm Cl −solution 2solution 1100.0the portion of Fondaparinux Sodium taken:20.0 ppm 2.0, Standard 2.0, Standard SO 4−2/20 ppmResult (% area/area) = [r U /(r S + r T )] × 100Cl −solution 2solution 1100.050.0 ppm r U= peak response of each impurity from the5.0, Standard 5.0, Standard SO 4−2/50 ppmSample solutionCl −solution 2solution 1100.0r S = peak response of fondaparinux sodium fromthe Sample solutionResolution solution: Dissolve 150mg of sodium nitrite r T= sum of all peak responses for impurities fromin 100.0mL of water. Combine 2.0mL of this solution the Sample solutionand 2.0mL of Standard solution 1 in 80mL of water,and dilute with water to 100.0mL.2One suitable suppressor is Dionex ASRS 300 4mm.Sample solution: 3mg/mL of Fondaparinux Sodium in waterThe total impurities content (% area/area) is the sum of Table 4all mean unrounded contents of an individual impurityHold Time that are NLT 0.200%.Initial at Final Acceptance criteria: See Table 3.Tempera-Temperature Final Tempera-ture Ramp Temperature tureTable 3(°)(°/min)(°) (min)40—4020Relative Acceptance40102400Retention Criteria,Name Time NMT (%)240—2405 Impurity peak A a0.930.8 (a/a)Carrier gas: Helium with a linear velocity ofImpurity peak B a 1.2b0.6 (a/a)20–30cm/sAny unspecified im-Injection type: Split ratio, 1:7—purity0.3Head space autosamplerTotal impurities—NMT 2.0%Sample equilibration temperature: 80°a Impurity peak A contains two structures: Methyl (2-deoxy-2-sodium Sample equilibration time: 60 minsulfoamino-6-O-sodium sulfonato-α-D-glucopyranosyl)-(1→4)-(sodium β-D-Transfer line temperature: 110°glucopyranosyluronate)-(1→4)-(2-deoxy-2-sodium sulfoamino-3,6-di-O-so-System suitabilitydium sulfonato-α-D-glucopyranosyl)-(1→4)-(sodium 2,3-di-O-sodiumsulfonato-α-L-idopyranosyluronate)-2-deoxy-2-sodium sulfoamino-6-O-sodi-Samples:Standard solution 2 (A and B) and Blankum sulfonato-α-D-glucopyranoside; and Methyl (2-deoxy-2-formylamino-6-Assay a water Blank followed by six consecutive samples O-sodium sulfonato-α-D-glucopyranosyl)-(1→4)-(sodium-β-D-glucopyra-of Standard solution 2(A), followed by a single injection nosyluronate)-(1→4)-(2-deoxy-2-sodium sulfoamino-3,6-di-O-sodiumof Standard solution 2(B).sulfonato-α-D-glucopyranosyl)-(1→4)-(sodium 2-O-sodium sulfonato-α-L-idopyranosyluronate)-2-deoxy-2-sodium sulfoamino-6-O-sodium sulfonato-Suitability requirementsα-D-glucopyranoside.Blank: The chromatogram of the water Blank should b Impurity peak B can appear as a complex set of peaks and not fully not present a peak corresponding to ethanol or resolved. In such a case, the integration should be performed such that all pyridine.such peaks are combined.Signal-to-noise ratio: NLT 40 of the pyridine peak in •P YRIDINE AND E THANOL D ETERMINATION the chromatogram of Standard solution 2(A) (See Residual Solvents 〈467〉.)Relative standard deviation: NMT 5% for the aver-Pyridine standard solution: In a 100-mL volumetric age areas of the chromatographic peaks for ethanol flask containing about 20mL of water, transfer 101.8µL and pyridine in six consecutive assaysof pyridine accurately. Dilute with water to 100mL.AnalysisInternal standard solution: 500-µg/mL solution of Samples:Internal standard solution, Standard solution 1-butanol in water2(A), and Sample solutionStandard solution 1: In a 100-mL volumetric flask con-Calculations: Calculate the ethanol and pyridine con-taining about 20mL of water, transfer accurately tent in ppm (µg/g) in the portion of Fondaparinux So-1.27mL of ethanol and 1.0mL of Pyridine standard so-dium taken:lution. Dilute with water to 100.0mL.Standard solution 2:Standard solution 1 and water Result = C S× (R U/R S) × (V/M) ×D(1:100). Prepare in duplicate (A and B).C S= concentration of Standard solution 2 (µg/mL)Sample stock solution: 10mg/mL of Fondaparinux So-R U= peak response ratio of solvent “s” in the dium in water in triplicateSample solution to solvent “s” in the Internal Sample solution: 2mg/mL of Fondaparinux Sodium instandard solutionwater from the Sample stock solutionR S= peak response ratio of solvent “s” in Standard Blank: Watersolution 2 to solvent “s” in the Internal Sample preparation: For the Blank, transfer 5.0mL ofstandard solutionwater and 5g of potassium carbonate to an appropriateV= volume of solution used to prepare the Sample headspace vial, apply stopper, cap, and mix. For sam-solution (mL)ples and standards, add 5.0mL of the Sample solutionM= mass of sample dissolved to prepare the or Standard solution 2 with 5g of potassium carbonateSample solution (g)and 0.1mL of the Internal standard solution to an ap-D= dilution factor of the Sample solution propriate headspace vial, apply stopper, cap, and mix.The average of three independent assays constitutes Chromatographic systemthe results.(See Chromatography 〈621〉, System Suitability.)Acceptance criteria: NMT 5×10⁴ ppm for ethanol and Mode: GC with headspace sampler50ppm for pyridineDetector: Flame ionizationColumn: 0.32-mm × 30-m fused silica, 1.8-µm filmSPECIFIC TESTSthickness; support G43•B ACTERIAL E NDOTOXINS T EST〈85〉: It contains NMT 25 TemperaturesUSP Endotoxin Units/mg.[N OTE—At initial temperature NLT 3 min between•P H 〈791〉: 6.0–8.0, in a solution, at 20°–25° (2.5% w/v) injections.]•M ICROBIAL E NUMERATION T ESTS〈61〉: NMT 350 cfu/g Injector: 140°•W ATER D ETERMINATION, Method Ic〈921〉: It contains NMT Detector: 250°20.0% (w/w).Column: See Table 4.ADDITIONAL REQUIREMENTS•P ACKAGING AND S TORAGE: Preserve in tight containers,and store at or below 25° in a dry environment.•L ABELING: Label to indicate mass of active drug substanceper container.•USP R EFERENCE S TANDARDS〈11〉Blank: WaterUSP Endotoxin RS Chromatographic systemUSP Fondaparinux Sodium for Assay RS(See Chromatography 〈621〉, System Suitability.)USP Fondaparinux Sodium Identification RS Mode: LCUSP Fondaparinux Sodium System Suitability Mixture A Detector: UV 210 nmRS v USP38Column: 4-mm × 25-cm; packing L46Column temperature: 25°Flow rate: 1.0mL/minInjection volume: 100µLSystem suitabilitySamples:System suitability solution, Standard solution, Add the following:Sensitivity check solution, and BlankInject the Blank in duplicate, the Sensitivity check solu-tion, and the System suitability solution. Inject thev Fondaparinux Sodium Injection Standard solution at least six times consecutively.Suitability requirementsDEFINITION Specificity and baseline drift: The chromatogram of Fondaparinux Sodium Injection is a sterile solution of a second Blank injection shows a baseline drift be-Fondaparinux Sodium in Water for Injection with sodium tween 0.00 and 0.02 AU over 30 min. If necessary, chloride added for isotonicity. It is a clear, colorless to adjust the DMSO content of the Mobile phase until an slightly yellow solution.acceptable baseline is achieved. The chromatogramof a second Blank injection does not contain peaks IDENTIFICATION between 3.00 and 30.00 min.•A. The retention time of the major peak of the Sample Chromatogram similarity: The chromatogram of the solution corresponds to that of the Standard solution, as System suitability solution corresponds to that of the obtained in the Assay.reference chromatogram provided with USP•B. I DENTIFICATION T ESTS—G ENERAL, Chloride 〈191〉: Pro-Fondaparinux Sodium System Suitability Mixture B ceed as directed in the chapter. Meets the requirements RS.of the Chloride and Sulfate 〈221〉 test.Signal-to-noise ratio: NLT 10 for the fondaparinuxpeak in the chromatogram of the Sensitivity check ASSAY solution•P ROCEDURE Resolution: NLT 1.2 between fondaparinux related5 mM phosphate solution: 0.210g of monobasic so-compound C and fondaparinux related compound D,dium phosphate dihydrate and 0.650g of dibasic so-System suitability solution; NLT 1.1 betweendium phosphate dihydrate. Dissolve in and dilute with fondaparinux related compound F and fondaparinux water to 1000mL. pH is approximately 7.3.related compound G (see Table 2), System suitability Solution A: 15±10 ppm of dimethylsulfoxide (DMSO)solutionin 5 mM phosphate solution (1 in 67000, v/v)Standard agreement: The difference in the mean re-Solution B: 2.0 M sodium chloride solution in 5 mM sponse factors for each Standard solution is NMT phosphate solution 2.0%.Mobile phase: See Table 1. [N OTE—Make adjustments Relative standard deviation: For six consecutive in-to Solution A as necessary, and degas the Mobile phase jections of the Standard solution the calculated % RSD before use. Dissolved gas in the injected solution may of the area of the fondaparinux peak is NMT 2.0%.lead to baseline interference. Degassing of the Mobile The retention time of the fondaparinux peak should phase is critical to obtain a suitable signal-to-noise ratio be ±5% of the mean value. The calculated % RSD of and higher sensitivity. An eluant generator1 installed be-the response factors for six consecutive injections of tween the injector and the column may reduce the the Standard solution is NMT 2.0%. The calculated % baseline interference.]RSD of the pooled response factors for all injectionsof the Standard solution is NMT 2.0%. The % RSD of Table 1the mean response factors for the duplicate prepara-tions of the duplicate Standard solutions is NMT Time Solution A Solution B2.0%.(min)(%)(%)Analysis05050Samples:Standard solution and Sample solution55050Inject the Standard solution at least six times consecu-25595tively. Inject duplicate preparations of the Sample solu-tion. Record the chromatograms, and measure the re-30595tention times and areas for the major peaks (excluding 355050peaks before 3.00 and after 30.00 min).505050Calculations: For each injection of the Standard solu-tion calculate a response factor (F R): System suitability solution: 5.0mg/mL of USPFondaparinux Sodium System Suitability Mixture B RSF R = (C S/r S)Standard solution: 5.0mg/mL of USP FondaparinuxSodium for Assay RS in water. Prepare in duplicate.C S= concentration of fondaparinux sodium in theSensitivity check solution: 0.01mg/mL of USPStandard solution (mg/mL) Fondaparinux Sodium for Assay RS in water from ther S= peak response of fondaparinux sodium from Standard solutionthe Standard solution Sample solution: Transfer the contents of prefilled sy-Relative retention times (RRT) are calculated by ringes to a suitable container, and mix well. Dilute withdividing the retention time of the peak by the water, if needed, to obtain a 5.0-mg/mL solution ofretention time of fondaparinux established by the fondaparinux sodium.Standard solution. Using the mean response factor1One suitable eluant generator is Dionex DEGAS EG40/50 (12×17 cm, thick-(F M), calculate the concentration (mg/mL) ofness 2.2cm).。
version 1
McMaster UniversityDepartment of EconomicsECON 1B03Midterm Test #2VERSION 1Instructor: Professor H HolmesDuration: 2 hoursTotal Number of Pages: 14INSTRUCTIONS:Answer all questions on the scan sheets. USE AN HB PENCIL ONLY. Make sure you carefully fill in the bubbles. YOU MUST FILL IN YOUR STUDENT NUMBER, AND VERSION NUMBER ON THE SCAN SHEET OR YOUR GRADE WILL NOT BE RECORDED.You may use the Casio FX calculator.Hand in the scan sheet and this test copy.TOTAL MARKS AVAILABLE: 50NAME:____________________________________________________STUDENT #: _______________________________________________MUGSI ID: ________________________________________________SECTION: Circle One: 9:30-10:20 11:30-12:20 Wednesday NightMultiple ChoiceIdentify the letter of the choice that best completes the statement or answers the question.____ 1. Externalities cause markets toa. fail to allocate resources efficiently.b. cause price to be different than the equilibrium price.c. benefit producers at the expense of consumers.d. cause markets to operate more equitably.____ 2. When negative externalities are present in a marketa. producers will be affected, but not consumers.b. overproduction will occur.c. demand will be too high.d. the market will still maximize total benefits.Figure 1____ 3. Refer to Figure 1. Which price and quantity combination represents the social optimum for this market?a. P1 and Q1.b. P2 and Q2.c. P2 and Q1.d. P3 and Q1.____ 4. Which of the following is true of the Coase theorem?a. Interested parties can reach an outcome in which everyone is better off.b. The outcome reached will be inefficient.c. Interested parties will need an arbitrator in order to reach an agreement that is efficient.d. None of the above is correct.Figure 2____ 5. Refer to Figure 2. If the government imposes a binding price floor of $14.00 in this market, the result would be aa. surplus of 20.b. surplus of 40.c. shortage of 20.d. shortage of 40.Figure 3____ 6. Refer to Figure 3. With a price ceiling present in this market, when the supply curve for gasoline shifts from S1 to S2a. the price will increase to P3.b. a surplus will occur at the new market price of P2.c. the market price will stay at P1 due to the price ceiling.d. a shortage will occur at the price ceiling of P2.____ 7. Assume that the demand and supply curves for cars are elastic. If the government imposed a $500 tax on the buyer of each car, we can assume that thea. equilibrium price of a car would decrease by less than $500.b. price of a car would decrease by exactly $500.c. price of a car would decrease by more than $500.d. price of a car would not change if both curves were elastic.Figure 4____ 8. Refer to Figure 4. The price sellers receive after the tax is imposed isa. $18.00.b. $14.00.c. $12.00.d. $8.00.____ 9. Refer to Figure 4. The amount of the tax that buyers would pay would bea. $10.00.b. $6.00.c. $4.00.d. $2.00.Figure 5____ 10. Refer to Figure 5. The price sellers receive after the tax is imposed isa. $1.00.b. $3.50.c. $5.00.d. $6.00.____ 11. Refer to Figure 5. The amount of the tax that sellers would pay would bea. $1.00.b. $1.50.c. $2.50.d. $3.00.Continued on the next page…Figure 6____ 12. Refer to Figure 6. In which market will the majority of a tax be paid by the buyer?a. market (a)b. market (b)c. market (c)d. All of the above are correct.____ 13. If a tax is imposed on a market with inelastic demand and elastic supply,a. buyers will bear most of the burden of the tax.b. sellers will bear most of the burden of the tax.c. the burden of the tax will be shared equally between buyers and sellers.d. it is impossible to determine how the burden of the tax will be shared.____ 14. When evaluating the size of the deadweight loss due to a tax we know that thea. greater the elasticities of supply and demand, the greater the deadweight loss.b. smaller the elasticities of supply and demand, the greater the deadweight loss.c. smaller the decrease in both quantity demanded and quantity supplied, the greater thedeadweight loss.d. primary factor that determines the size of the deadweight loss in the percentage the tax isof price.Figure 7____ 15. Refer to Figure 7. The deadweight loss in this market as a result of a tax would bea. $600.b. $900.c. $1500.d. $1800.Figure 8____ 16. Refer to Figure 8. After the tax is levied, consumer surplus is represented by areaa. Ab. A + B + Cc. D + E + Fd. F____ 17. Market demand is given by Qd = 1450 - 2P and market supply is given by Qs = 15P - 100. The government imposes a tax of $10 per unit on suppliers. The new, after-tax supply curve is given by Qs* =15P - 250. Suppliers receive a price ofa. $100.00 c. $91.18b. $90.00 d. none of the above.____ 18. Market demand is given by Qd = 1450 - 2P and market supply is given by Qs = 15P - 100. The government imposes a tax of $10 per unit on suppliers. The new, after-tax supply curve is given by Qs* =15P - 250. The deadweight loss due to taxation is approximatelya. $12,500.00 c. $88.20b. $176.40 d. none of the above.____ 19. Market demand is given by Qd = 1450 - 2P and market supply is given by Qs = 15P - 100. The government imposes a tax of $10 per unit on suppliers. The new, after-tax supply curve is given by Qs* =15P - 250. Complete the following sentence:“Since the _________ burden of the tax falls on __________, the ________ curve is ___________________ than the _________ curve.”a. larger; firm; demand; less elastic; supply c. smaller; consumer; demand; less elastic;supplyd. larger; firm; supply; less elastic; demand.b. smaller; firm; supply; more elastic;demand____ 20. The marginal product of labour is equal to thea. incremental cost associated with a one unit increase in labour.b. incremental profit associated with a one unit increase in labour.c. increase in labour necessary to generate a one unit increase in output.d. increase in output obtained from a one unit increase in labour.____ 21. Which of these assumptions is often realistic for a firm in the short run?a. The firm can vary both the size of its factory and the number of workers it employs.b. The firm can vary the size of its factory, but not the number of workers it employs.c. The firm can vary the number of workers it employs, but not the size of its factory.d. The firm can vary neither the size of its factory nor the number of workers it employs.____ 22. Let L represent the number of workers hired by a firm and let Q represent that firm's quantity of output.Assume two points on the firm's production function are (L = 12, Q = 122) and (L = 13, Q = 130). Thenthe marginal product of the 13th worker isa. 8 units of output.b. 10 units of output.c. 122 units of output.d. 130 units of output.____ 23. If marginal cost is rising,a. average variable cost must be falling.b. average fixed cost must be rising.c. marginal product must be falling.d. marginal product must be rising.____ 24. When marginal cost is less than average total cost,a. marginal cost must be falling.b. average variable cost must be falling.c. average total cost is falling.d. average total cost is rising.____ 25. The marginal cost curve crosses the average total cost curve ata. the efficient scale.b. the minimum point on the average total cost curve.c. a point where the marginal cost curve is rising.d. All of the above are correct.Scenario 1A certain firm produces and sells staplers. Last year, it produced 5,000 staplers and sold each stapler for$8. In producing the 5,000 staplers, it incurred variable costs of $30,000 and a total cost of $45,000.____ 26. Refer to Scenario 1. In producing the 5,000 staplers, the firm's average fixed cost wasa. $3.b. $4.c. $5.d. $7.____ 27. Refer to Scenario 1. In producing the 5,000 staplers, the firm's average total cost wasa. $6.b. $7.c. $8.d. $9.Table 1Measures of Cost for ABC Inc. Widget FactoryQuantity of Widgets VariableCostsTotalCostsFixedCosts0 $101 $ 12 $3 $133 $ 6 $164 $105 $256 $21 $10____ 28. Refer to Table 1. The average total cost of producing one widget isa. $1.00.b. $10.00.c. $11.00.d. $22.00.____ 29. Refer to Table 1 on the previous page. The marginal cost of producing the sixth widget isa. $1.00.b. $3.50.c. $5.00.d. $6.00.____ 30. Consider the following information about bread production at Beth's Bakery:Worker Marginal Product1 52 73 104 115 86 67 4Beth pays all her workers the same wage and labour is her only variable cost. From this information wecan conclude that Beth's marginal costa. declines as output increases from 0 to 33, but increases after that.b. declines as output increases from 0 to 11, but increases after that.c. increases as output increases from 0 to 11, but declines after that.d. continually increases as output rises.____ 31. In a competitive market,a. no single buyer or seller can influence the price of the product.b. there is a small number of sellers.c. the goods offered by the different sellers are markedly different.d. All of the above are correct.____ 32. For a competitive firm,a. Total revenue = Average revenue.b. Total revenue = Marginal revenue.c. Total cost = Marginal revenue.d. Average revenue = Marginal revenue.Table 2Quantity Total Revenue Total Cost0 $0 $101 9 142 18 193 27 254 36 325 45 406 54 497 63 598 72 709 81 82____ 33. Refer to Table 2 on the previous page. At which quantity of output is marginal revenue equal to marginal cost?a. 3b. 6c. 8d. All of the above are correct.____ 34. Refer to Table 2 on the previous page. If the firm finds that its marginal cost is $11, it shoulda. increase production to maximize profit.b. increase the price of the product to maximize profit.c. advertise to attract additional buyers to maximize profit.d. None of the above are correct.____ 35. If marginal cost exceeds marginal revenue, the firma. is most likely to be at a profit-maximizing level of output.b. should increase the level of production to maximize its profit.c. must be experiencing losses.d. may still be earning a profit..Figure 9____ 36. Refer to Figure 9. When price rises from P2 to P3, the firm finds thata. marginal cost exceeds marginal revenue at a production level of Q2.b. if it produces at output level Q3 it will earn a positive profit.c. expanding output to Q4 would leave the firm with losses.d. All of the above are correct.____ 37. A profit-maximizing firm in a competitive market produces small rubber balls. When the market price for small rubber balls falls below the minimum of its average total cost, but still lies above the minimum ofaverage variable cost, the firma. will experience losses but it will continue to produce rubber balls.b. will shut down.c. will be earning both economic and accounting profits.d. should raise the price of its product.Figure 10____ 38. Refer to Figure 10. When market price is P1, a profit-maximizing firm's total profit or loss can be represented by which area?a. P1× Q3; profitb. (P3 - P1) × Q2 ; lossc. (P2 - P1) × Q1; lossd. We can't tell because we don't know fixed costs.____ 39. When an industry is a natural monopoly,a. it is characterized by constant returns to scale.b. it is characterized by diseconomies of scale.c. a larger number of firms may lead to a lower average cost.d. a larger number of firms will lead to a higher average cost.____ 40. A monopolist's marginal revenue is less than price because(i) to sell additional units of the good, the price charged on all units must decrease.(ii) with the sale of an additional unit, the monopolist receives less revenue for each of the previous units it planned to sell.(iii) of the upward-sloping average revenue curve.a. (i) and (ii)b. (ii) and (iii)c. (i) and (iii)d. All of the above are correct.Figure 11____ 41. Refer to Figure 11. A profit-maximizing monopoly's profit is equal toa. P3× Q2.b. P2× Q4.c. (P3 - P0) × Q2.d. (P3 - P0) × Q4.____ 42. The price of a good sold in a perfectly competitive market is $8. Each identical firm has a marginal cost function MC = 4Q. A profit-maximizing firm will producea. Q = 2 c. Q = 8b. Q = 5 d. Q = 10.____ 43. The price of a good sold in a perfectly competitive market is $8. Each identical firm has a marginal cost function MC = 4Q. The firm’s marginal revenue isa. $2 c. $5b. $10 d. $8.____ 44. In a perfectly competitive market, market demand is given by Qd = 50 - .5P and market supply is given by Qs = P - 10. Each identical firm has a MC = 4Q. Each firm is currently producing 5 units of output.Each firm is:a. producing too little. c. maximizing profit.b. producing too much. d. none of the above.____ 45. In a perfectly competitive market, market demand is given by Qd = 50 - .5P and market supply is given by Qs = P - 10. Each identical firm has a MC = 4Q. The individual firm’s supply curve (above minimumAVC) is given by the equationa. Q = .25P c. Q = 5b. Q = .P - 10 d. none of the above.____ 46. In a perfectly competitive market, market demand is given by Qd = 50 - .5P and market supply is given by Qs = P - 10. Each identical firm has a MC = 4Q. In the long run, if minimum LRAC = 40,a. firms will enter the market. c. firms will earn zero economic profit.b. firms will exit the market. d. firms will incur economic losses.____ 47. Suppose the market described in Question #46 above is served by a monopolist with MR = 100 - 4Q. The monopolist’s demand curve would bea. P = 100 - 4Q c. Q = 10 - Pb. P = 40 d. Q = 50 - .5P____ 48. Suppose the market described in Question #46 above is served by a monopolist with MR = 100 - 4Q. The monopolist’s marginal cost curve would bea. the market supply curve d. both A and Bb. MC = 10 + Q e. both A and C.c. MC = 4Q____ 49. Suppose the market described in Question #46 above is served by a monopolist with MR = 100 - 4Q. The deadweight loss due to monopoly isa. $432 c. $324b. $648 d. $216.____ 50. Suppose the market described in Question #46 above is served by a monopolist with MR = 100 - 4Q. If the monopolist’s average total costs were constant at $28 (that is, ATC = 28), its profit would bea. $432 c. $324b. $648 d. $$216.____ 51. Who bought 90 head of cattle from Professor Holmes’ farmer friend?a. Kevin Costner c. John Lennonb. Donald Trump d. Brett Favre。
GMW15777 Material Specification
Zone A: Very High Visibility
Description All very highly visible exterior surfaces (horizontal and vertical) above an imaginary line drawn between the top of the front and rear bumpers as indicated in Appendix A. When in doubt, Zone A is any area 50 to 190 cm from the ground. All highly visible exterior surfaces below an imaginary line drawn between the top of the front and rear bumpers as indicated in Appendix A. When in doubt, Zone B is any area 0 to 50 cm and >190 cm from the ground. Moderately surfaces. visible exterior clearly
3.1.4 Inspection for Color Matching. For color evaluation, lighting should conform to SAE J361 or VDA-16. The inspection area shall be painted a low reflectivity light grey color. A match to Munsell number 8 is recommended. Munsell number 8 color chips are available from Munsell Color/Macbeth Corp., 2442 N. Calvert, Baltimore, MD 21218. 3.1.5 Inspection Devices. The following inspection devices are approved for use in measuring the following appearance attributes: 3.1.5.1 Color. GM Color Standards or Color Masters can be obtained from Thierry Corporation (). 3.1.5.2 Gloss. BYK-Gardner gloss meter, Hunter Dor-I-Gon, ATI, or equivalent per ASTM D523. Start with the 20 setting. If the gloss is ≥ 60 with the 20 setting, continue to use the 20 setting. If <60 gloss, change to the 60 setting for measurements. 3.1.5.3 Orange Peel. BYK-Gardner DOI Model 4816 and Wave Scan Micro 4846 are approved for high gloss (gloss >60) only. BYK-Gardner Dual Wave Scan Model AW4840 can measure high and low gloss and is preferred. Available from BYKGardner at 9104 Guilford Road, Columbia, MD 21046, Phone 800-343-7721. For parts that cannot be measured by the BYK-Gardner dual wave scan meter due to size or shape, Visual Orange Peel standards may be obtained from ACT Laboratories, Hillsdale, MI 49242, (517) 439-1485. 3.1.5.4 Dirt. Dirt inspection templates may be obtained from Quality Metals, at (248) 589-0505. 3.1.6 Additional Requirements. Appearance must be consistent over the entire part. Maximum variation on any individual part for a specific attribute is as follows: 3.1.6.1 Gloss. See Table A1 or parts drawing. 3.1.6.2 Orange Peel. Specific values will be detailed in the Statements of Requirements (SOR) and Math Files for components and will include requirements for R value as well as Wb, Wc, and Wd. See Table A1 for minimum default Orange Peel values if not specified in Vehicle Technical Specification (VTS), SOR and Math File documents. For R value, within a panel or part, a maximum of one unit variation within a 120 mm span is allowed. For R value, between panels or parts that are oriented similarly (both vertical and both horizontal), a maximum of 1.5 units variation is allowed. Specific values in SORs or from program teams may supplement or supersede this requirement. Values shall be an average of three points spread over the part. The variation and Page 2 of 13
最全美国Cree公司大功率LED全套芯片产品规格说明书
This document is provided for informational purposes only and is not a warranty or a specification. For product specifications, please see the data sheets available at . For warranty information, please contact Cree Sales at sales@. Copyright © 2008-2010 Cree, Inc. All rights reserved. The information in this document is subject to change without notice. Cree, the Cree logo and XLamp arenc.
Cree® XLamp® XP Family LED
Binning and Labeling
Introduction
This document describes the product nomenclature required to select and order Cree’s XLamp XP Family LEDs. XLamp XP Family LEDs are tested and sorted into bins which are then combined into orderable kits identified by an order code.
Table of Contents
Bin and Order-Code Format....................................................................................................................... 2 Performance Groups – Brightness............................................................................................................... 3 Performance Groups – Chromaticity............................................................................................................ 4 Performance Groups – Dominant Wavelength............................................................................................... 8 Performance Groups – Forward Voltage....................................................................................................... 8 Cree’s Standard Chromaticity Regions Plotted on the 1931 CIE Curve.............................................................. 9 Standard Order Codes and Bins (XP-C Cool White). ..................................................................................... 12 Standard Order Codes and Bins (XP-C ANSI Cool White). ............................................................................. 12 Standard Order Codes and Bins (XP-C Neutral White). ................................................................................. 13 Standard Order Codes and Bins (XP-C Warm White). ................................................................................... 14 Standard Order Codes and Bins (XP-C Color). ............................................................................................. 15 Standard Order Codes and Bins (XP-E Cool White)...................................................................................... 17 Standard Order Codes and Bins (XP-E Outdoor White). ................................................................................ 19 Standard Order Codes and Bins (XP-E Neutral White).................................................................................. 20 Standard Order Codes and Bins (XP-E Warm White).................................................................................... 21 Standard Order Codes and Bins (XP-E Color). ............................................................................................. 22 Standard Order Codes and Bins (XP-G ANSI Cool White). ............................................................................. 23 Standard Order Codes and Bins (XP-G Outdoor White)................................................................................ 24 Standard Order Codes and Bins (XP-G Neutral White). ................................................................................. 25 Standard Order Codes and Bins (XP-G Warm White). ................................................................................... 26
Draft Report 150500775SHA-001
Listing Constructional Data Report (CDR)Report Number150500775SHA-001DRAFT Issued:6-Aug-2015For Review and CommentStandard(s)ApplicantManufacturerAddress AddressCountry Country Contact Contact Phone Phone FAX FAX Email EmailClass 2 Power Units – UL 1310 Sixth Edition Dated August 26, 2011 including Revisions through and including December 12, 2014.Power Supplies with Extra-low Voltage Class 2 Outputs – CSA C22.2 No.223-M91 Dated June 1991, Reaffirmed 2013 with General Instruction No. 1 Dated June 1991 and Update No. 2 Dated September 20091.0 Reference and Address East Industrial Road, LinjiangIndustrial Park (Dawang) New High-Tech Industrial Development Zone, ZHAOQING Guangdong 52623886-758-398281086-758-3982810East Industrial Road, LinjiangIndustrial Park (Dawang) New High-Tech Industrial Development Zone, ZHAOQING Guangdong 526238GUANGDONG MARSHELL ELECTRIC VEHICLE CO., LTD.dong.zhonghua@86-758-3982819dong.zhonghua@GUANGDONG MARSHELL ELECTRIC VEHICLE CO., LTD.86-758-3982819Dong Zhonghua Dong Zhonghua ChinaChinaPage 1 of 24Product Brand nameModelsModel Similarity RatingsOther Ratings LC-2279, LC-2280, LC-2281, LC-2282, LC-2283, LC-2284, DRBM1A, DRBM2A, DRBM3A, DRBM4ANAAll models in this report have the same technical construction including circuit diagram, PCB layout, components, component layout, all electrical construction and mechanical construction. Only the transformer secondary winding is different.Models with the same output ratings are totally identical except the model name and brand name.Input: 100-240VAC, 50/60Hz, 75W;Output: 24VDC, 1.0A (for model LC-2279)24VDC, 2.0A (for model LC-2280)12VDC, 1.0A (for model LC-2281, DRBM1A)12VDC, 2.0A (for model LC-2282, DRBM2A)12VDC, 3.0A (for model LC-2283, DRBM3A)12VDC, 4.0A (for model LC-2284, DRBM4A)2.0 Product DescriptionClass 2 Battery ChargerMARSHELL, DURACELLDescription The products covered by this report are Class 2 Battery Chargers that are intended to be used for charging 24V, 6-22AH and 12V, 12-40AH lead acid batteries. The products are connected to 100-240VAC 50/60Hz supply source.Photo 1 - External viewPhoto 2 - Internal View3.0 Product Photographs 4321611713143.0 Product Photographs Photo 3 - PCBPhoto 3 - Transformer Photo 4 - Transformer 12 10 958 1516Photo #Itemno.1 Name Manufacturer/ trademark 2Type / model 2Technical data and securement meansMark(s) of conformity311EnclosureBAYERMATERIALSCIEN CE AG 6267 + (z)Rated V-0, 115 degree C,minimum 1.5 mm thickness. UL E41613cURus DONGGUAN KENTAT ELECTRIC CO.,LTD SPT-22X18AWG, 300V, 105°C, VW-1Length including plug: not less than 1.8m as measured from the face of the attachment plug to the point of entry; UL E245568cURus DONG GUAN YONG SHENG CABLESTECHNOLOGY CO LTDSPT-22X18AWG, 300V, 105°C, VW-1Length including plug: not less than 1.8m as measured from the face of the attachment plug to the point of entry; UL E310857cURus HUNAN AOMENG ELECTRICALAPPLIANCES CO LTDSPT-22X18AWG, 300V, 105°C, VW-1Length including plug: not less than 1.8m as measured from the face of the attachment plug to the point of entry; UL E202351cURus Various SPT-22X18AWG, 300V, 105°C, VW-1Length including plug: not less than 1.8m as measured from the face of the attachment plug to the point of entry;cURus DONGGUAN KENTAT ELECTRIC CO.,LTDKE-01PRated 125VAC, 10A, 1-15P type,polarized plug. UL E318998cURusDONG GUAN YONG SHENG CABLESTECHNOLOGY CO LTD YS-02Rated 125VAC, 10A, 1-15P type,polarized plug. UL E318166cURusVarious VariousRated 125VAC, 10A, 1-15P type,polarized plug.cURusDONGGUAN KENTAT ELECTRIC CO.,LTDSPT-22X18AWG, 300V, 105°C, VW-1 Length: not less than 1.8m UL E245568cULusDONG GUAN YONG SHENG CABLESTECHNOLOGY CO LTDSPT-22X18AWG, 300V, 105°C, VW-1Length: not less than 1.8m UL E310857cULusHUNAN AOMENG ELECTRICALAPPLIANCES CO LTD SPT-22X18AWG, 300V, 105°C, VW-1Length: not less than 1.8m UL E202351cULusVariousSPT-22X18AWG, 300V, 105°C, VW-1Length: not less than 1.8mcULus4.0 Critical Components4112Power cordPlug31Output cordPhoto #Itemno.1Name Manufacturer/ trademark 2Type / model 2Technical data and securement meansMark(s) of conformity34.0 Critical ComponentsDONGDUAN ANDUELECTRONICS CO LTD3GTU Rated: 250VAC, 3.15A; UL E317400cURusDONGDUAN BETTERELECTRONICS 332Rated: 250VAC, 3.15A; UL E300003cURusXCELECTRONICS (SHENZHEN) CORP LTD 3T Rated: 250VAC, 3.15A;UL E249609cURusDONGDUAN ANDUELECTRONICS CO LTD ATCRated: 32VDC, 10A;UL E317400cURusDONGDUAN BETTERELECTRONICS718Rated: 32VDC, 10A;UL E300003cURusSHENZHEN JINGHAOCAPACITOR CO LTDCBB62B0.33uF, 250Vac, 110°C, X2 type UL E252286cURusFARADELECTRONICS CO LTD PXK0.33uF, 250Vac, 110°C, X2 type UL E247953cURusJIMSONELECTRONICS CO LTDMKP 0.33uF, 250Vac, 110°C, X2 type UL E152288cURusSHENZHEN SURONGCAPACITORS CO LTDMPX/MKP0.33uF, 250Vac, 110°C, X2 type UL E246678cURusTENTA ELECTRICINDUSTRIAL CO LTDMEX0.33uF, 250Vac, 110°C, X2 type UL E222911cURusSHENZHENCHUANGSHUOD A ELECTRONICS CO LTD MPX 0.33uF, 250Vac, 110°C, X2 type UL E326938cURusKUNSHAN WANSHENG ELECTRONICS CO LTD CT73300pF, 250V, Y1 type,125°C UL E249006cURusJYH CHUNG ELECTRONICS CO LTDJD3300pF, 250V, Y1 type,125°C UL E187963cURusY-capacitors (CY1, CY2)361Fuse on Output Cord8X-capacitors (CX1)72Fuse (F1)53Photo #Itemno.1Name Manufacturer/ trademark 2Type / model 2Technical data and securement meansMark(s) of conformity34.0 Critical ComponentsLite-On Technology Corporation LTV-817Double protection optical isolated switches, providing 5000 Vac isolation UL E113898cURusSHARP CORP ELECTRONIC COMPONENTS AND DEVICES GROUPPC817 Double protection optical isolated switches, providing 5000 Vac isolation UL E64380cURusCHANGYUAN ELECTRONICS CO.LTD CB-HFT Rated: 300V, 125°C, VW-1; UL E180908cURus VariousVariousRated: 300V, 125°C, VW-1; cURus DONGGUANSHI XINGLIANELECTRONIC CO LTD XL01Rated: V-0,130°C; Min. thickness: 2.0mm. UL E346387cURusVariousVariousRated: V-0,130°C; Min. thickness: 2.0mm.cURus CERGLASS MFGINC14D471K85°C, For use in SPD Type 3 applications UL E317616cURusHONGZHIENTERPRISES LTDHEL14D471K 85°C, For use in SPD Type 3 applications UL E324904cURus213Insulation tape used in Heatsink JINGJIANG YAHUAPRESSURE SENSITIVE GLUE CO.LTDPZ Insulating tape, 130°C; UL E165111cURus214Silicone Molding Resin FilmSHENZHEN BORNSUNINDUSTRIAL CO LTD HN-400V-0, 150°C UL E256822cURus 315Bridge rectifier VariousVariousRated 600VAC, 4AcETLus cURus cCSAus 416Transformer (T1)JEPULSTECHNOLOGY(SHENZHEN) CO LTDPQ2620Class B with ElectricalInsulation System of JEPULS-UL-001; UL E306571See 5.0117Label (not shown)Various VariousMin. temperature 60°C;cURus10Heat shrink tube (F1)312Varistor (VAR1)323Optocoupler (U2)93) Indicates specific marks to be verified, which assures the agreed level of surveillance for the component. "NR" - indicates Unlisted and only visual examination is necessary. "See 5.0" indicates Unlisted components or assemblies to be evaluated periodically refer to section 5.0 for details.2) “Various“ means any type, from any manufacturer that complies with the "Technical data and securement means" and meets the "Mark(s) of conformity" can be used.1) Not all item numbers are indicated (called out) in the photos, as their location is obvious.NOTES:PCB11Photo #Item no.416130XIAMEN RISESELECTRONIC CO LTDReinforced insulation rated 130°C (Class B); UL E345298TIW-B Magnet Wire Rated: 300V, 200°C,VW-1E156256MW75-C, Rated: 130°C E239508*UEW/130, QA-*/130FURUKAWA ELECTRIC CO LTDTEX-EReinforced insulation rated 130°C (Class B); UL E206440Component PTFE tubingGREAT HOLDINGINDUSTRIAL CO LTDTFT Triple insulation wireVariousSHANTOU SHENGANGELECTRICAL5.0 Critical Unlisted CEC Components CONTACTS Name Manufacturer/Trademark Type / model Transformer(T1)JEPULS TECHNOLOGY (SHENZHEN) CO LTDPQ2620Electrical Rating:Input: 100-240VAC, 50/60Hz, 75WInsulation classComponent Standard used:UL 1310 Sixth Edition Dated August 26, 2011 including Revisions through and including December 12, 2014.CSA C22.2 No.223-M91 Dated June 1991, Reaffirmed 2013 with General Instruction No. 1 Dated June 1991 and Update No. 2 Dated September 2009Rated: 130°C, PET film tape E165111MATERIALS LIST (refer to illustration 3 for assembly drawing) SHENZHEN CHENGWEIINDUSTRY CO LTD2UEWMW75-C, Rated: 130°CInsulation tapeJINGJIANG YAHUAPRESSURESENSITIVE GLUE CO LTDCT Manufacturer Type/modelDimensions/thickness/assembly information MW75-C, Rated: 130°C E227475Various4130Bobbin Phenolic. Minimum 0.7 mm thick, V-0, 140 degree C. UL E59481CHANG CHUNPLASTICS COLTD5.0 Critical Unlisted CEC ComponentsTurns Volts Amps22/////10/5//10/5/////11//6/7//Frequency:Annual1///////N5Φ0.55/2 x Φ0.55Φ0.55/2 x Φ0.55/N3(Output 24V/12V)N4(Output 24V/12V)N7(Output 24V/12V)WP-2952F-2G Minimum 130 degree C UL E72979Minimum 130 degree C UL E335405E962/Winding information See winding information above.Wire Type DC resistance(Ω) +/- 5%:N2N6/2UEW 2 x Φ0.20N1 2 x Φ0.372UEW Winding Designation Wire Size (mm)2UEW /2 x Φ0.37TIW-B TIW-B WINDING(S) TURNSHITACHICHEMICAL CO LTDVarnishesGUANGZHOU BETTER NEW MATERIALS CO LTDBETTER 116 (n)VERIFICATION PROCESS60sSecondary to core 1480Dielectric Strength Apply voltage Between 60sTest Name Primary to secondary Number of samples to test:1480CEC Test Voltage ZHUHAICHANGXIANNEW MATERIALS TECHNOLOGY CO LTDTest TimeTest Site:Test Parameters Minimum 130 degree C UL E2300676.0 Critical FeaturesRecognized Component - A component part, which has been previously evaluated by an accredited certification body with restrictions and must be evaluated as part of the basic product considering the restrictions as specified by the Conditions of Acceptability.Listed Component - A component part, which has been previously Listed or Certified by an accredited Certification Organization with no restrictions and is used in the intended application within its ratings.Unlisted Component - A part that has not been previously evaluated to the appropriate designated component standard. It may also be a Listed or Recognized component that is being used outside of its evaluated Listing or component recognition.Critical Features/Components - An essential part, material, subassembly, system, software, or accessory of a product that has a direct bearing on the product’s conformance to applicable requirements of the product standard.Construction Details - For specific construction details, reference should be made to the photographs and descriptions. All dimensions are approximate unless specified as exact or within a tolerance. In addition to the specific construction details described in this Report, the following general requirements also apply.1.Spacing - In primary circuits, 4.8 mm minimum spacing is maintained through air and over surfaces ofinsulating material between primary circuits and secondary circuits and between primary circuits andexternal plastic enclosure which is evaluated by UL840. 9.5 mm minimum between different polarity of fuse and different polarity of L and N before fuse.2.Mechanical Assembly - Components such as switches, fuseholders, connectors, wiring terminals and displaylamps are mounted and prevented from shifting or rotating by the use of lockwashers, starwashers, or other mounting format that prevents turning of the component.3.Corrosion Protection - All ferrous metal parts are protected against corrosion by painting, plating or theequivalent.4.Accessibility of Live Parts - All uninsulated live parts in primary circuitry are housed within a non-metallicenclosure constructed with no openings other than those specifically described in Sections 4 and 5.5.Grounding - This product is not provided with a means of grounding.6.Polarized Connection - This product is provided with a polarized power supply connection. All single poleswitches and fuses are connected only to the ungrounded supply circuit conductor.7.Internal Wiring - Internal wiring is routed away from sharp or moving parts. Internal wiring leads terminatingin soldered connections are made mechanically secure prior to soldering. Recognized Component separable (quick disconnect) connectors of the positive detent type, closed loop connectors, or other types specifically described in the text of this report are also acceptable as internal wiring terminals. At points where internal wiring passes through metal walls or partitions, the wiring insulation is protected against abrasion or damage by plastic bushings or grommets. All wiring is minimum 18 AWG, with a minimum rating of 300V, 105°C.8.Circuit diagram - Refer to Illustration Nos. 1 for circuit diagram requiring verification during FieldRepresentative Inspection Audits.9.Markings - The product is marked on as labeling system as follows: refer to an Illustration No. 4.10.Cautionary Markings - The following are required: refer to Illustration No. 4 for details.11.Installation, Operating and Safety Instructions - Instructions for installation and use of this product are notrequired by the standard.12.PCB layout- Refer to Illustration No.2 for PCB layout requiring verification during Field RepresentativeInspection Audits.13.Transformer construction: - Refer to Illustration No.3,3a for transformer construction requiring verificationduring Field Representative Inspection Audits.7.0 IllustrationsIllustration 1 - Circuit Diagram7.0 IllustrationsIllustration 2 - Layout of Main Printed Wiring Board7.0 IllustrationsIllustration 3 - Structure of Transformer for Output 24V Models7.0 IllustrationsIllustration 3a - Structure of Transformer for Output 12V Models7.0 IllustrationsIllustration 4 - MarkingNote:1. MMYY will be replaced by actual manufacturing year and month.2. The words “CAUTION” and "ATTENTION" of cautionary statements in letters is not less than3.2mm high. The remaining letters of cautionary statements are not less than 1.6mm high.3. The other models(refer to section 2.0) have the same labels except the model name and rating.7.0 Illustrations Illustration 5 - Manual7.0 IllustrationsIllustration 5a - Manual (continued)Evaluation Period Project No.150500775SHASample Rec. Date26-April-2015Condition PrototypeSample ID.0150426-27-001~006Test Location Test Procedure UL 1310 Sixth Edition Dated August 26, 2011 includingRevisions through and includingDecember 12,2014CSA C22.2 No.223-M91 Dated June 1991,Reaffirmed 2013 withGeneral Instruction No. 1 Dated June1991 and Update No. 2Dated September 2009UL 746C SixthEdition Dated September 10, 2004 containing Revisions through and including October 16, 201426 6.5--27----28 6.2.1--29 6.2.2--30 6.2.4--32 6.2.3--33 6.3--34 6.4--Leakage Current TestLeakage Current Test and Dielectric Voltage WithstandTest After Humidity ExposureMaximum Output Voltage TestMaximum Input TestOutput Current and Power TestFull-Load Output Current TestNormal Temperature TestDielectric Voltage-Withstand Test8.0 Test Summary Intertek Testing Services Shanghai.Testing LabTest Description15-May-2015 to 08-June-2015Determination of the result includes consideration of measurement uncertainty from the test equipment and methods. The product was tested as indicated below with results in conformance to the relevant test criteria.The following tests were performed:39 6.7--40----41----42----46------ 4.1.6---- 6.6---- 6.9---- 6.10---- 6.13------29----31Evaluation PeriodProject No.1508003779SHA15-May-2015 to 08-June-2015Determination of the result includes consideration of measurement uncertainty from the test equipment andmethods. The product was tested as indicated below with results in conformance to the relevant test criteria.Drop and ImpactPush-Back Relief TestStain-Relief Test after Mold-Stress Relief Distortion Abuse TestsDue to the previous testing performed under Intertek Report 150500775SHA-001,no additional testing was necessary for standard update from "UL 746C Sixth Edition Dated September 10,2004containing Revisions through and including October 16,2014"to "UL 746C Sixth Edition Dated September 10,2004containing Revisions through and including June 23, 2015"Secondary Circuit ProtectionStrain Relief and Blade RetentionInsulating MaterialMold-Stress Relief DistortionPlug Discharge and Plug Energy Stored TestAbnormal TestsTests on Insulating MaterialsStrain Relief Test8.0 Test SummaryCompleted by:Reviewed by:Title:Title:Signature:Signature:Signature on fileSignature on file8.1 SignaturesEngineer Supervisor A representative sample of the product covered by this report has been evaluated and found to comply with the applicable requirements of the standards indicated in Section 1.0.Will Wang Dani ZhaoBASIC LISTEEAddress Country ProductMULTIPLE LISTEE 1Address Country Brand Name ASSOCIATED MANUFACTURERAddress CountryBASIC LISTEE MODELSMULTIPLE LISTEE 2Address Country Brand Name ASSOCIATED MANUFACTURERAddress CountryBASIC LISTEE MODELSMULTIPLE LISTEE 3Address Country Brand Name ASSOCIATED MANUFACTURERAddress CountryBASIC LISTEE MODELS9.0 Correlation Page For Multiple ListingsThe following products,which are identical to those identified in this report except for model number and Listee name, are authorized to bear the ETL label under provisions of the Intertek Multiple Listing Program.GUANGDONG MARSHELL ELECTRIC VEHICLE CO., LTD.East Industrial Road, Linjiang Industrial Park (Dawang) New High-Tech Industrial Development Zone, ZHAOQING Guangdong 526238ChinaClass 2 Battery ChargerNoneNoneMULTIPLE LISTEE 2 MODELSNoneMULTIPLE LISTEE 1 MODELSMULTIPLE LISTEE 3 MODELS10.0 General InformationThe Applicant and Manufacturer have agreed to produce, test and label ETL Listed products in accordance with the requirements of this Report. The Manufacturer has also agreed to notify Intertek and to request authorization prior to using alternate parts, components or materials.COMPONENTSComponents used shall be those itemized in this Intertek report covering the product, including any amendments and/or revisions.LISTING MARKThe ETL Listing mark applied to the products shall either be separable in form, such as labels purchased from Intertek, or on a product nameplate or other media only as specifically authorized by Intertek. Use of the mark is subject to the control of Intertek.The mark must include the following four items:1) applicable country identifiers "US" and/or "C" or "US", "C" and "EU"2) the word "Listed" or "Classified" or "Recognized Component" (whichever is appropriate)3) a control number issued by Intertek4) a product descriptor that identifies the standards used for certification. Example:For US standards, the words, “Conforms to” shall appear with the standard number along with the word, “Standard” or “Std.” Example: “Conforms to ANSI/UL Std. XX.”For Canadian standards, the words “Certified to CAN/CSA Standard CXX No. XX.” shall be used, or abbreviated, “Cert. to CAN/CSA Std. CXX No. XX.”Can be used together when both standards are used.Note: A facsimile must be submitted to Intertek, Attn: Follow-up Services for approval prior to use.The facsimile need not have a control number. A control number will be issued after signed Certification Agreements have been received by the Follow-up Services office, approval of the facsimile of yourproposed Listing Mark, satisfactory completion of the Listing Report, and scheduling of a factoryassessment in your facility.MANUFACTURING AND PRODUCTION TESTSManufacturing and Production Tests shall be performed as required in this Report.FOLLOW‑UP SERVICEPeriodic unannounced audits of the manufacturing facility (and any locations authorized to apply the mark) shall be scheduled by Intertek. An audit report shall be issued after each visit. Special attention will be given to the following:1. Conformance of the manufactured product to the descriptions in this Report.2. Conformance of the use of the ETL mark with the requirements of this Report and the Certification Agreement.3. Manufacturing changes.4. Performance of specified Manufacturing and Production Tests.In the event that the Intertek representative identifies non-conformance(s) to any provision of this Report, the Applicant shall take one or more of the following actions:1. Correct the non-conformance.2. Remove the ETL Mark from non-conforming product.3. Contact the issuing product safety evaluation center for instructions.10.1 Evaluation of Unlisted ComponentsBecause Unlisted Components are uncontrolled, and they do not fall under a third party follow up program, Intertek may require these components to be tested and/or evaluated at least once annually, more often for certain components, as part of the independent certification process. The Unlisted Components in Section 5.0 require testing and/or evaluation as indicated.Sample Disposition: Due to the destructive nature of the testing, all samples will bediscarded at the conclusion of testing unless, the manufacturer specifically requests thereturn of the samples. The request for return must accompany the initial componentshipment.11.0 Manufacturing and Production TestsThe manufacturer agrees to conduct the following Manufacturing and Production Tests as specified:Required TestsDielectric Voltage Withstand Test11.1 Dielectric Voltage Withstand TestMethodOne hundred percent of production of the products covered by this Report shall be subjected to a routine production line dielectric withstand test.The test shall be conducted on products, which are fully assembled. Prior to applying the test potential, all switches, contractors, relays, etc., should be closed so that all primary circuits are energized by the test potential. If all primary circuits cannot be tested at one time, then separate applications of the test potential shall be made. The test voltage specified below shall be applied between primary and secondary circuits. The test voltage may be gradually increased to the specified value but must be maintained at the specified value for one second or one minute as required.Test EquipmentThe test equipment shall incorporate a transformer with an essentially sinusoidal output, a means to indicate the applied test potential, and an audible and/or visual indicator of dielectric breakdown.The test equipment shall incorporate a voltmeter in the output circuit to indicate directly the applied test potential if the rated output of the test equipment is less than 500VA.If the rated output of the test equipment is 500VA or more, the applied test potential may be indicated by either:1 - a voltmeter in the primary circuit;2 - a selector switch marked to indicate the test potential; or3 - a marking in a readily visible location to indicate the test potential for test equipment having a single test potential output.In cases 2 and 3, the test equipment shall include a lamp or other visual means to indicate that the test potential is present at the test equipment output. All test equipment shall be maintained in current calibration.Products Requiring Dielectric Voltage Withstand Test:Product Test Voltage Test Time All products covered by this Report.1000V 60 sor1200V 1 sDate/Project Handler/ Proj # Site ID Reviewer6-Aug-2015Dani Zhao2--Added a new brand name "DURACELL";Added four new models "DRBM1A", "DRBM2A", "DRBM3A","DRBM4A" and updated respective ratings.150800379SHA Will Wang74Updated the note of marking plate.75Updated the manul for new added models.8--Updated the standard from "UL 746C Sixth Edition DatedSeptember 10, 2004 containing Revisions through andincluding October 16, 2014" to "UL 746C Sixth Edition DatedSeptember 10, 2004 containing Revisions through andincluding June 23, 2015"Added new test block in section 8.8.1--Revised with new signature.12.0 Revision SummaryThe following changes are in compliance with the declaration of Section 8.1:Section Item Description of Change。
8082方法
METHOD 8082POLYCHLORINATED BIPHENYLS (PCBs)BY GAS CHROMATOGRAPHY1.0SCOPE AND APPLICATION1.1Method 8082 is used to determine the concentrations of polychlorinated biphenyls (PCBs) as Aroclors or as individual PCB congeners in extracts from solid and aqueous matrices. Open-tubular, capillary columns are employed with electron capture detectors (ECD) or electrolytic conductivity detectors (ELCD). When compared to packed columns, these fused-silica, open-tubular columns offer improved resolution, better selectivity, increased sensitivity, and faster analysis. The target compounds listed below may be determined by either a single- or dual-column analysis system. The PCB congeners listed below have been tested by this method, and the method may be appropriate for additional congeners.Compound CAS Registry No.IUPAC #Aroclor 101612674-11-2-Aroclor 122111104-28-2-Aroclor 123211141-16-5-Aroclor 124253469-21-9-Aroclor 124812672-29-6-Aroclor 125411097-69-1-Aroclor 126011096-82-5-2-Chlorobiphenyl2051-60-712,3-Dichlorobiphenyl16605-91-752,2',5-Trichlorobiphenyl37680-65-2182,4',5-Trichlorobiphenyl16606-02-3312,2',3,5'-Tetrachlorobiphenyl41464-39-5442,2',5,5'-Tetrachlorobiphenyl35693-99-3522,3',4,4'-Tetrachlorobiphenyl32598-10-0662,2',3,4,5'-Pentachlorobiphenyl38380-02-8872,2',4,5,5'-Pentachlorobiphenyl37680-73-21012,3,3',4',6-Pentachlorobiphenyl38380-03-91102,2',3,4,4',5'-Hexachlorobiphenyl35065-28-21382,2',3,4,5,5'-Hexachlorobiphenyl52712-04-61412,2',3,5,5',6-Hexachlorobiphenyl52663-63-51512,2',4,4',5,5'-Hexachlorobiphenyl35065-27-11532,2',3,3',4,4',5-Heptachlorobiphenyl35065-30-61702,2',3,4,4',5,5'-Heptachlorobiphenyl35065-29-31802,2',3,4,4',5',6-Heptachlorobiphenyl52663-69-11832,2',3,4',5,5',6-Heptachlorobiphenyl52663-68-01872,2',3,3',4,4',5,5',6-Nonachlorobiphenyl40186-72-9206CD-ROM8082 - 1Revision 0December 19961.2Aroclors are multi-component mixtures. When samples contain more than one Aroclor,a higher level of analyst expertise is required to attain acceptable levels of qualitative and quantitative analysis. The same is true of Aroclors that have been subjected to environmental degradation ("weathering") or degradation by treatment technologies. Such weathered multi-component mixtures may have significant differences in peak patterns than those of Aroclor standards.1.3Quantitation of PCBs as Aroclors is appropriate for many regulatory compliance determinations, but is particularly difficult when the Aroclors have been weathered by long exposure in the environment. Therefore, this method provides procedures for the determination of selected individual PCB congeners. The 19 PCB congeners listed above have been tested by this method.1.4The PCB congener approach potentially affords greater quantitative accuracy when PCBs are known to be present. As a result, this method may be used to determine Aroclors, some PCB congeners, or "total PCBs," depending on regulatory requirements and project needs. The congener method is of particular value in determining weathered Aroclors. However, analysts should use caution when using the congener method when regulatory requirements are based on Aroclor concentrations.1.5Compound identification based on single-column analysis should be confirmed on a second column, or should be supported by at least one other qualitative technique. This method describes analytical conditions for a second gas chromatographic column that can be used to confirm the measurements made with the primary column. GC/MS Method 8270 is also recommended as a confirmation technique when sensitivity permits (Sec. 8.0).1.6This method also describes a dual-column option. The option allows a hardware configuration of two analytical columns joined to a single injection port. The option allows one injection to be used for dual-column analysis. Analysts are cautioned that the dual-column option may not be appropriate when the instrument is subject to mechanical stress, many samples are to be run in a short period, or when highly contaminated samples are analyzed.1.7The analyst must select columns, detectors and calibration procedures most appropriate for the specific analytes of interest in a study. Matrix-specific performance data must be established and the stability of the analytical system and instrument calibration must be established for each analytical matrix (e.g., hexane solutions from sample extractions, diluted oil samples, etc.). Example chromatograms and GC conditions are provided as guidance.1.8The MDLs for Aroclors vary in the range of 0.054 to 0.90 µg/L in water and 57 to 70 µg/kg in soils. Estimated quantitation limits may be determined using the data in Table 1.1.9This method is restricted to use by, or under the supervision of, analysts experienced in the use of gas chromatographs (GC) and skilled in the interpretation of gas chromatograms. Each analyst must demonstrate the ability to generate acceptable results with this method.2.0SUMMARY OF METHOD2.1 A measured volume or weight of sample (approximately 1 L for liquids, 2 g to 30 g for solids) is extracted using the appropriate matrix-specific sample extraction technique.2.2Aqueous samples are extracted at neutral pH with methylene chloride using Method 3510 (separatory funnel), Method 3520 (continuous liquid-liquid extractor), or other appropriate technique. CD-ROM8082 - 2Revision 0December 19962.3Solid samples are extracted with hexane-acetone (1:1) or methylene chloride-acetone (1:1) using Method 3540 (Soxhlet), Method 3541 (automated Soxhlet), or other appropriate technique.2.4Extracts for PCB analysis may be subjected to a sulfuric acid/potassium permanganate cleanup (Method 3665) designed specifically for these analytes. This cleanup technique will remove (destroy) many single component organochlorine or organophosphorus pesticides. Therefore, Method 8082 is not applicable to the analysis of those compounds. Instead, use Method 8081.2.5After cleanup, the extract is analyzed by injecting a 2-µL aliquot into a gas chromatograph with a narrow- or wide-bore fused silica capillary column and electron capture detector (GC/ECD).2.6The chromatographic data may be used to determine the seven Aroclors in Sec. 1.1, individual PCB congeners, or total PCBs.3.0INTERFERENCES3.1Refer to Methods 3500 (Sec. 3.0, in particular), 3600, and 8000 for a discussion of interferences.3.2Interferences co-extracted from the samples will vary considerably from matrix to matrix. While general cleanup techniques are referenced or provided as part of this method, unique samples may require additional cleanup approaches to achieve desired degrees of discrimination and quantitation. Sources of interference in this method can be grouped into three broad categories.3.2.1Contaminated solvents, reagents, or sample processing hardware.3.2.2Contaminated GC carrier gas, parts, column surfaces, or detector surfaces.3.2.3Compounds extracted from the sample matrix to which the detector will respond.3.3Interferences by phthalate esters introduced during sample preparation can pose a major problem in PCB determinations.3.3.1Common flexible plastics contain varying amounts of phthalate esters which areeasily extracted or leached from such materials during laboratory operations. Interferences from phthalate esters can best be minimized by avoiding contact with any plastic materials and checking all solvents and reagents for phthalate contamination.3.3.2Exhaustive cleanup of solvents, reagents and glassware may be required toeliminate background phthalate ester contamination.3.3.3These materials can be removed through the use of Method 3665 (sulfuricacid/permanganate cleanup).3.4Cross-contamination of clean glassware routinely occurs when plastics are handled during extraction steps, especially when solvent-wetted surfaces are handled. Glassware must be scrupulously cleaned.Clean all glassware as soon as possible after use by rinsing with the last solvent used. This should be followed by detergent washing with hot water, and rinses with tap water and organic-free CD-ROM8082 - 3Revision 0December 1996CD-ROM 8082 - 4Revision 0December 1996reagent water. Drain the glassware, and dry it in an oven at 130E C for several hours, or rinse with methanol and drain. Store dry glassware in a clean environment. NOTE:Oven-drying of glassware used for PCB analysis can increase contaminationbecause PCBs are readily volatilized in the oven and spread to other glassware.Therefore, exercise caution, and do not dry glassware from samples containinghigh concentrations of PCBs with glassware that may be used for trace analyses.3.5Elemental sulfur (S ) is readily extracted from soil samples and may cause 8chromatographic interferences in the determination of PCBs. Sulfur can be removed through the use of Method 3660.4.0APPARATUS AND MATERIALS4.1Gas chromatograph - An analytical system complete with gas chromatograph suitable for on-column and split-splitless injection and all required accessories including syringes, analytical columns, gases, electron capture detectors (ECD), and recorder/integrator or data system.4.2GC columnsThis method describes procedures for both single-column and dual-column analyses. The single-column approach involves one analysis to determine that a compound is present, followed by a second analysis to confirm the identity of the compound (Sec. 8.4 describes how GC/MS confirmation techniques may be employed). The single-column approach may employ either narrow-bore (# 0.32 mm ID) columns or wide-bore (0.53 mm ID) columns. The dual-column approach involves a single injection that is split between two columns that are mounted in a single gas chromatograph. The dual-column approach employs only wide-bore (0.53 mm ID) columns. A third alternative is to employ dual columns mounted in a single GC, but with each column connected to a separate injector and a separate detector.The columns listed in this section were the columns used to develop the method performance data. Listing these columns in this method is not intended to exclude the use of other columns that may be developed. Laboratories may use other capillary columns provided that they document method performance (e.g., chromatographic resolution, analyte breakdown, and MDLs) that equals or exceeds the performance specified in this method.4.2.1Narrow-bore columns for single-column analysis (use both columns to confirmcompound identifications unless another confirmation technique such as GC/MS is employed).Narrow bore columns should be installed in split/splitless (Grob-type) injectors.4.2.1.130 m x 0.25 or 0.32 mm ID fused silica capillary column chemicallybonded with SE-54 (DB-5 or equivalent), 1 µm film thickness.4.2.1.230 m x 0.25 mm ID fused silica capillary column chemically bonded with35 percent phenyl methylpolysiloxane (DB-608, SPB-608, or equivalent), 2.5 µm coatingthickness, 1 µm film thickness.4.2.2Wide-bore columns for single-column analysis (use two of the three columnslisted to confirm compound identifications unless another confirmation technique such as GC/MS is employed). Wide-bore columns should be installed in 1/4 inch injectors, with deactivated liners designed specifically for use with these columns.4.2.2.130 m x 0.53 mm ID fused silica capillary column chemically bonded with35 percent phenyl methylpolysiloxane (DB-608, SPB-608, RTx-35, or equivalent), 0.5 µmor 0.83 µm film thickness.4.2.2.230 m x 0.53 mm ID fused silica capillary column chemically bonded with14% cyanopropylmethylpolysiloxane (DB-1701, or equivalent), 1.0 µm film thickness.4.2.2.330 m x 0.53 mm ID fused silica capillary column chemically bonded withSE-54 (DB-5, SPB-5, RTx-5, or equivalent), 1.5 µm film thickness.4.2.3Wide-bore columns for dual-column analysis (choose one of the two pairs ofcolumns listed below).4.2.3.1Column pair 130 m x 0.53 mm ID fused silica capillary column chemically bonded with SE-54(DB-5, SPB-5, RTx-5, or equivalent), 1.5 µm film thickness.30 m x 0.53 mm ID fused silica capillary column chemically bonded with 14%cyanopropylmethylpolysiloxane (DB-1701, or equivalent), 1.0 µm film thickness.Column pair 1 is mounted in a press-fit Y-shaped glass 3-way union splitter (J&W Scientific, Catalog No. 705-0733) or a Y-shaped fused-silica connector (Restek, CatalogNo. 20405), or equivalent.4.2.3.2Column pair 230 m x 0.53 mm ID fused silica capillary column chemically bonded with SE-54(DB-5, SPB-5, RTx-5, or equivalent), 0.83 µm film thickness.30 m x 0.53 mm ID fused silica capillary column chemically bonded with 14%cyanopropylmethylpolysiloxane (DB-1701, or equivalent), 1.0 µm film thickness.Column pair 2 is mounted in an 8 in. deactivated glass injection tee (Supelco, Catalog No. 2-3665M), or equivalent.4.3Column rinsing kit - Bonded-phase column rinse kit (J&W Scientific, Catalog No. 430-3000), or equivalent.4.4Volumetric flasks - 10-mL and 25-mL, for preparation of standards.5.0REAGENTS5.1Reagent grade or pesticide grade chemicals shall be used in all tests. Unless otherwise indicated, it is intended that all reagents shall conform to specifications of the Committee on Analytical Reagents of the American Chemical Society, where such specifications are available. Other grades may be used, provided it is first ascertained that the reagent is of sufficiently high purity to permit its use without lessening the accuracy of the determination.NOTE:Store the standard solutions (stock, composite, calibration, internal, and surrogate standards) at 4E C in polytetrafluoroethylene (PTFE)-sealed containers CD-ROM8082 - 5Revision 0December 1996CD-ROM 8082 - 6Revision 0December 1996in the dark. When a lot of standards is prepared, it is recommended that aliquotsof that lot be stored in individual small vials. All stock standard solutions mustbe replaced after one year or sooner if routine QC (Sec. 8.0) indicates a problem.All other standard solutions must be replaced after six months or sooner if routineQC (Sec. 8.0) indicates a problem.5.2Sample extracts prepared by Methods 3510, 3520, 3540, 3541, 3545, or 3550 need to undergo a solvent exchange step prior to analysis. The following solvents are necessary for dilution of sample extracts. All solvent lots should be pesticide quality or equivalent and should be determined to be phthalate-free.5.2.1n-Hexane, C H 6145.2.2Isooctane, (CH )CCH CH(CH )332325.3The following solvents may be necessary for the preparation of standards. All solvent lots must be pesticide quality or equivalent and should be determined to be phthalate-free.5.3.1Acetone, (CH )CO 325.3.2Toluene, C H CH 6535.4Organic-free reagent water - All references to water in this method refer to organic-free reagent water as defined in Chapter One.5.5Stock standard solutions (1000 mg/L) - May be prepared from pure standard materials or can be purchased as certified solutions.5.5.1Prepare stock standard solutions by accurately weighing about 0.0100 g of purecompound. Dissolve the compound in isooctane or hexane and dilute to volume in a 10-mL volumetric flask. If compound purity is 96 percent or greater, the weight may be used without correction to calculate the concentration of the stock standard solution.5.5.2Commercially-prepared stock standard solutions may be used at any concentration if they are certified by the manufacturer or by an independent source.5.6Calibration standards for Aroclors5.6.1 A standard containing a mixture of Aroclor 1016 and Aroclor 1260 will includemany of the peaks represented in the other five Aroclor mixtures. As a result, a multi-point initial calibration employing a mixture of Aroclors 1016 and 1260 at five concentrations should be sufficient to demonstrate the linearity of the detector response without the necessity of performing initial calibrations for each of the seven Aroclors. In addition, such a mixture can be used as a standard to demonstrate that a sample does not contain peaks that represent any one of the Aroclors. This standard can also be used to determine the concentrations of either Aroclor 1016 or Aroclor 1260, should they be present in a sample. Prepare a minimum of five calibration standards containing equal concentrations of both Aroclor 1016 and Aroclor 1260by dilution of the stock standard with isooctane or hexane. The concentrations should correspond to the expected range of concentrations found in real samples and should bracket the linear range of the detector.5.6.2Single standards of each of the other five Aroclors are required to aid the analystin pattern recognition. Assuming that the Aroclor 1016/1260 standards described in Sec. 5.6.1 have been used to demonstrate the linearity of the detector, these single standards of the remaining five Aroclors are also used to determine the calibration factor for each Aroclor.Prepare a standard for each of the other Aroclors. The concentrations should correspond to the mid-point of the linear range of the detector.5.7Calibration standards for PCB congeners5.7.1If results are to be determined for individual PCB congeners, then standards forthe pure congeners must be prepared. The table in Sec. 1.1 lists 19 PCB congeners that have been tested by this method along with the IUPAC numbers designating these congeners. This procedure may be appropriate for other congeners as well.5.7.2Stock standards may be prepared in a fashion similar to that described for theAroclor standards, or may be purchased as commercially-prepared solutions. Stock standards should be used to prepare a minimum of five concentrations by dilution of the stock standard with isooctane or hexane. The concentrations should correspond to the expected range of concentrations found in real samples and should bracket the linear range of the detector.5.8Internal standard5.8.1When PCB congeners are to be determined, the use of an internal standard ishighly recommended. Decachlorobiphenyl may be used as an internal standard, added to each sample extract prior to analysis, and included in each of the initial calibration standards.5.8.2When PCBs are to be determined as Aroclors, an internal standard is not used,and decachlorobiphenyl is employed as a surrogate (see Sec. 5.8).5.9Surrogate standards5.9.1When PCBs are to be determined as Aroclors, decachlorobiphenyl is used as asurrogate, and is added to each sample prior to extraction. Prepare a solution of decachlorobiphenyl at a concentration of 5 mg/L in acetone.5.9.2When PCB congeners are to be determined, decachlorobiphenyl is recommendedfor use as an internal standard, and therefore, cannot also be used as a surrogate. Therefore, tetrachloro-meta-xylene may be used as a surrogate for PCB congener analysis. Prepare a solution of tetrachloro-meta-xylene at a concentration of 5 mg/L in acetone.6.0SAMPLE COLLECTION, PRESERVATION, AND HANDLING6.1See Chapter Four, Organic Analytes for sample collection and preservation instructions.6.2Extracts must be stored under refrigeration in the dark and analyzed within 40 days of extraction.CD-ROM8082 - 7Revision 0December 19967.0PROCEDURE7.1Sample extraction7.1.1Refer to Chapter Two and Method 3500 for guidance in choosing the appropriateextraction procedure. In general, water samples are extracted at a neutral pH with methylene chloride using a separatory funnel (Method 3510) or a continuous liquid-liquid extractor (Method 3520) or other appropriate procedure. Solid samples are extracted with hexane-acetone (1:1) or methylene chloride-acetone (1:1) using one of the Soxhlet extraction (Method 3540 or 3541) procedures, ultrasonic extraction (Method 3550), or other appropriate procedure.NOTE:Use of hexane-acetone generally reduces the amount of interferences that are extracted and improves signal-to-noise.7.1.2Reference materials, field-contaminated samples, or spiked samples should beused to verify the applicability of the selected extraction technique to each new sample type.Such samples should contain or be spiked with the compounds of interest in order to determine the percent recovery and the limit of detection for that sample type (see Chapter One). When other materials are not available and spiked samples are used, they should be spiked with the analytes of interest, either specific Aroclors or PCB congeners. When the presence of specific Aroclors is not anticipated, the Aroclor 1016/1260 mixture may be an appropriate choice for spiking. See Methods 3500 and 8000 for guidance on demonstration of initial method proficiency as well as guidance on matrix spikes for routine sample analysis.7.2Extract cleanupRefer to Methods 3660 and 3665 for information on extract cleanup.7.3GC conditionsThis method allows the analyst to choose between a single-column or a dual-column configuration in the injector port. Either wide- or narrow-bore columns may be used. See Sec.7.7 for information on techniques for making positive identifications of multi-componentanalytes.7.3.1Single-column analysisThis capillary GC/ECD method allows the analyst the option of using 0.25-0.32 mm ID capillary columns (narrow-bore) or 0.53 mm ID capillary columns (wide-bore). The use of narrow-bore (0.25-0.32 mm ID) columns is recommended when the analyst requires greater chromatographic resolution. Use of narrow-bore columns is suitable for relatively clean samples or for extracts that have been prepared with one or more of the clean-up options referenced in the method. Wide-bore columns (0.53 mm ID) are suitable for more complex environmental and waste matrices.7.3.2Dual-column analysisThe dual-column/dual-detector approach involves the use of two 30 m x 0.53 mm ID fused-silica open-tubular columns of different polarities, thus different selectivities towards the target compounds. The columns are connected to an injection tee and ECD detectors. CD-ROM8082 - 8Revision 0December 19967.3.3GC temperature programs and flow rates7.3.3.1Table 2 lists GC operating conditions for the analysis of PCBs asAroclors for single-column analysis, using either narrow-bore or wide-bore capillarycolumns. Table 3 lists GC operating conditions for the dual-column analysis. Use theconditions in these tables as guidance and establish the GC temperature program andflow rate necessary to separate the analytes of interest.7.3.3.2When determining PCBs as congeners, difficulties may be encounteredwith coelution of congener 153 and other sample components. When determining PCBsas Aroclors, chromatographic conditions should be adjusted to give adequate separationof the characteristic peaks in each Aroclor (see Sec. 7.4.6).7.3.3.3Tables 4 and 5 summarize the retention times of up to 73 Aroclor peaksdetermined during dual-column analysis using the operating conditions listed in Table 2.These retention times are provided as guidance as to what may be achieved using theGC columns, temperature programs, and flow rates described in this method. Note thatthe peak numbers used in these tables are not the IUPAC congener numbers, butrepresent the elution order of the peaks on these GC columns.7.3.3.4Once established, the same operating conditions must be used for theanalysis of samples and standards.7.4Calibration7.4.1Prepare calibration standards as described in Sec. 5.0. Refer to Method 8000(Sec. 7.0) for proper calibration techniques for both initial calibration and calibration verification.When PCBs are to be determined as congeners, the use of internal standard calibration is highly recommended. Therefore, the calibration standards must contain the internal standard (see Sec. 5.7) at the same concentration as the sample extracts. When PCBs are to be determined as Aroclors, external standard calibration should be used.NOTE:Because of the sensitivity of the electron capture detector, the injection port and column should always be cleaned prior to performing the initialcalibration.7.4.2When PCBs are to be quantitatively determined as congeners, an initial five-pointcalibration must be performed that includes standards for all the target analytes (congeners).7.4.3When PCBs are to be quantitatively determined as Aroclors, the initial calibrationconsists of two parts, described below.7.4.3.1 As noted in Sec. 5.6.1, a standard containing a mixture of Aroclor 1016and Aroclor 1260 will include many of the peaks represented in the other five Aroclormixtures. Thus, such a standard may be used to demonstrate the linearity of thedetector and that a sample does not contain peaks that represent any one of theAroclors. This standard can also be used to determine the concentrations of eitherAroclor 1016 or Aroclor 1260, should they be present in a sample. Therefore, an initialfive-point calibration is performed using the mixture of Aroclors 1016 and 1260 describedin Sec. 5.6.1.CD-ROM8082 - 9Revision 0December 1996RF 'A s ×C isA is ×C sCD-ROM 8082 - 10Revision 0December 19967.4.3.2Standards of the other five Aroclors are necessary for patternrecognition. These standards are also used to determine a single-point calibration factorfor each Aroclor, assuming that the Aroclor 1016/1260 mixture in Sec. 7.3.4.1 has beenused to describe the detector response. The standards for these five Aroclors shouldbe analyzed before the analysis of any samples, and may be analyzed before or after theanalysis of the five 1016/1260 standards in Sec. 7.3.4.1.7.4.3.3In situations where only a few Aroclors are of interest for a specificproject, the analyst may employ a five-point initial calibration of each of the Aroclors ofinterest (e.g., five standards of Aroclor 1232 if this Aroclor is of concern) and not use the1016/1260 mixture described in Sec. 7.4.3.1 or the pattern recognition standardsdescribed in 7.4.3.2.7.4.4Establish the GC operating conditions appropriate for the configuration (single-column or dual column, Sec. 7.3). Optimize the instrumental conditions for resolution of the target compounds and sensitivity. A final temperature of 240-270E C may be required to elute decachlorobiphenyl. Use of injector pressure programming will improve the chromatography of late eluting peaks.NOTE:Once established, the same operating conditions must be used for bothcalibrations and sample analyses.7.4.5 A 2-µL injection of each calibration standard is recommended. Other injectionvolumes may be employed, provided that the analyst can demonstrate adequate sensitivity for the compounds of interest.7.4.6Record the peak area (or height) for each congener or each characteristic Aroclorpeak to be used for quantitation.7.4.6.1 A minimum of 3 peaks must be chosen for each Aroclor, and preferably5 peaks. The peaks must be characteristic of the Aroclor in question. Choose peaks inthe Aroclor standards that are at least 25% of the height of the largest Aroclor peak. Foreach Aroclor, the set of 3 to 5 peaks should include at least one peak that is unique tothat Aroclor. Use at least five peaks for the Aroclor 1016/1260 mixture, none of whichshould be found in both of these Aroclors.7.4.6.2Late-eluting Aroclor peaks are generally the most stable in theenvironment. Table 6 lists diagnostic peaks in each Aroclor, along with their retentiontimes on two GC columns suitable for single-column analysis. Table 7 lists 13 specificPCB congeners found in Aroclor mixtures. Table 8 lists PCB congeners withcorresponding retention times on a DB-5 wide-bore GC column. Use these tables asguidance in choosing the appropriate peaks.7.4.7When determining PCB congeners by the internal standard procedure, calculatethe response factor (RF) for each congener in the calibration standards relative to the internal standard, decachlorobiphenyl, using the equation that follows.where:。
- 1、下载文档前请自行甄别文档内容的完整性,平台不提供额外的编辑、内容补充、找答案等附加服务。
- 2、"仅部分预览"的文档,不可在线预览部分如存在完整性等问题,可反馈申请退款(可完整预览的文档不适用该条件!)。
- 3、如文档侵犯您的权益,请联系客服反馈,我们会尽快为您处理(人工客服工作时间:9:00-18:30)。
Pricing StrategyJob# Job PreparationSCANNING6100143261002324610037406110141661102416612014166120273261203634612046306130115130614015146140241961403420614044226140542061501421615024206160172661602256160325617014206170242061801156190125619025196200111Total Hourse117612
Rework Hours due to change in customer specification6100101661002086130125615021461801016190111Total Hourse435
Rework Hours due to In-House Errors61301136140209614030106160313Total Hourse225
Idel Time4328
NumberTotal Hours Worked During June 1996166700Appendix-B Job PreparationSCANNINGTotal Number of Jobs Completed2626Total Number of reworks due to in-house error24Percentage of rework due to in-house error8%15%
Appendix-COverheads Allocation Job PreparationSCANNINGWages8,000 32,000 Depreciation500 25,000
Rent2,000 2,000 Others1,333 1,333 Total
Allocation of Overheads as per floor area use11,833 60,333 Unallocated Overheads related to Idle Floor SpaceAllocation of Overheads related to Idle space2,549 2,549 Total Overhead Allocation14,382 62,882 Percentage of Overhead6%28%
Floor Space Utilization10001000Idle Floor SpaceTotal Floor Space
Allocation of Overhead on Total Hours WorkedTotal Labour Hours Worked During June 1996166700Per Labour Hour Overhead Rate86.64$ 89.83$
Over Head Cost Allocation as per Labour Hours Used by each DepartmentJob# Job PreparationSCANNING61001347$ 2,875$ 61002260$ 2,156$ 61003606$ 3,593$ 61101347$ 1,437$ 61102347$ 1,437$ 61201347$ 1,437$ 61202606$ 2,875$ 61203520$ 3,054$ 61204520$ 2,695$ 613011,300$ 11,678$ 61401433$ 1,258$ 61402347$ 1,707$ 61403347$ 1,797$ 61404347$ 1,976$ 61405347$ 1,797$ 61501347$ 1,886$ 61502347$ 1,797$ 61601606$ 2,336$ 61602173$ 449$ 61603173$ 449$ 61701347$ 1,797$ 61702347$ 1,797$ 6180187$ 449$ 61901173$ 449$ 61902433$ 1,707$ 6200187$ 90$ Total10,137$ 54,977$
Rework Hours due to change in customer specification61001-$ 1,437$ 61002-$ 719$ 61301173$ 449$ 6150287$ 359$ 61801-$ 90$ 6190187$ 90$ Total347$ 3,144$
Rework Hours due to In-House Errors6130187$ 269$ 61402-$ 808$ 61403-$ 898$ 6160387$ 269$ Total173$ 2,246$
Idel Time3,726$ 2,515$ Total Overhead Cost absorbed During June 1914,382$ 62,882$
Appendix-A
Profit CalculationsPagesRevenue61001169,600 61002169,600 610033223,000 611011612,000 611021611,000 612011611,000 612023223,000 612033222,000 612043220,000 6130112850,000 61401167,800 61402168,000 61403168,000 61404169,000 61405169,800 615011611,000 615021611,000 616013220,000 6160242,000 6160341,400 61701168,000 617021610,000 6180144,000 6190142,000 619021612,000 620011- Idle TimeTotal545315,200 ASSEMBLINGOUTPUTQuality ControlTotal Hours4287933888817516814630445828445632466258851106486118588811025032304573244593287703443653645713644683944724087796089110101119112121394370414574112120121121424575211611521631472191
1042326432110222181014310540064112799
411101622291421273108376474
1283713249
umber of Hours Worked13582181712613ASSEMBLINGOUTPUTQuality Control26262644415%15%15%
ASSEMBLINGOUTPUTQuality ControlTotal64,000 10,000 11,000 125,000 10,000 14,000 500 50,000
8,000 4,000 1,000 30,000 5,333 2,667 667 20,000 Assuming that these other expenses rela225,000
87,333 30,667 13,167 203,333 21,667 10,196 5,098 1,275 97,529 35,765 14,441 225,000 43%16%6%
400020005008500650015000
1358218171261371.82$ 164.06$ 84.45$
ASSEMBLINGOUTPUTQuality ControlTotal Cost to Each Job3,016$ 1,312$ 591$ 8,141$ 2,729$ 1,312$ 676$ 7,133$ 5,386$ 2,625$ 676$ 12,887$ 2,155$ 656$ 338$ 4,932$ 2,011$ 656$ 338$ 4,789$ 2,298$ 656$ 507$ 5,245$ 4,165$ 1,312$ 422$ 9,381$ 4,596$ 1,312$ 507$ 9,990$ 4,165$ 1,312$ 676$ 9,368$ 17,955$ 5,250$ 2,534$ 38,716$ 2,298$ 656$ 338$ 4,983$ 2,298$ 1,312$ 591$ 6,255$ 2,442$ 656$ 253$ 5,495$ 2,585$ 656$ 422$ 5,987$
Since Rent expenrent on the basis of Floor area occupie