Fig. 4-20 Effect of Datum Modifier
1-典型外贸图纸及读图要点

第25页,共42页。
E、图中视图与辅助注释(标注)
第26页,共42页。
三、外贸图纸常用标识简介
第27页,共42页。
标识符号
F M L T
P
ST
ENGLISH
3rd angle projection Free State AT maximum material condition At least material condition Tangent Plane Projected tolerance zone Statistical Tolerance Runout Total Runout Angularity
Units: MM – 单位:厘米
Angular tolerance – 角度公差 Dimension tolerance – 尺寸公差 Title: Bias unit body –名称:偏置件 DWG revision – 图纸版次
第19页,共42页。
C、图纸版次更改栏
图纸版次更改栏的内容相对简单,一般包括修改版次号、更改单号或 更改说明、更改日期等内容。
IT Grades 国际等级 4 5 6 7 8 9 10 11
第35页,共42页。
五、机械加工方法与公差级别的关系
Relation of Machining Processes to Tolerance
美国形位公差标注规定及意义(中英文对照)

4
Goeway eBooks
5
82
A note or specification on the drawing should explain how the part is restrained and the force required to facilitate the restraint. A sample note can be found on the drawing below. /
/
4
M5
A
5
Goeway eBooks
6
82
FEATURE CONTROL FRAME / A feature control frame states the requirements or instructions for the features to which it is attached. /
2
82
NUMBER OF PLACES / COUNTERBORE/SPOTFACE / COUNTERSINK/ DEPTH/DEEP/ SQUARE/ ALL AROUND/ DIMENSION NOT TO SCALE ARC LENGTH/ X BETWEEN/ SLOPE/ CONICAL TAPER/ ENVELOPE PRINCIPLE
Unless otherwise specified, all dimensioning and tolerancing applies in a Free State condition with no restraint. Some parts, such as sheet metal, thin metal, plastics and rubber are no rigid in nature. It may be necessary to specify design requirements on the part in a natural or Free State as well as in a restrained condition. The restraint or force on the nonrigid parts is usually applied in such a manner to resemble or approximate the functional or mating requirements. /
Collective dynamics of 'small-world' networks
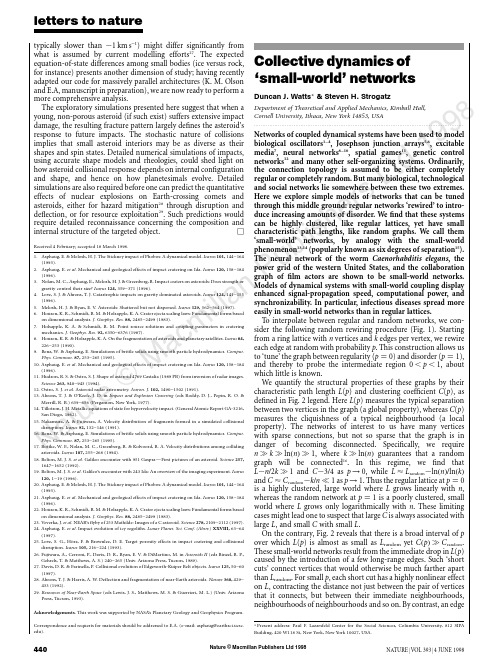
Nature © Macmillan Publishers Ltd 19988typically slower than ϳ1km s −1)might differ significantly from what is assumed by current modelling efforts 27.The expected equation-of-state differences among small bodies (ice versus rock,for instance)presents another dimension of study;having recently adapted our code for massively parallel architectures (K.M.Olson and E.A,manuscript in preparation),we are now ready to perform a more comprehensive analysis.The exploratory simulations presented here suggest that when a young,non-porous asteroid (if such exist)suffers extensive impact damage,the resulting fracture pattern largely defines the asteroid’s response to future impacts.The stochastic nature of collisions implies that small asteroid interiors may be as diverse as their shapes and spin states.Detailed numerical simulations of impacts,using accurate shape models and rheologies,could shed light on how asteroid collisional response depends on internal configuration and shape,and hence on how planetesimals evolve.Detailed simulations are also required before one can predict the quantitative effects of nuclear explosions on Earth-crossing comets and asteroids,either for hazard mitigation 28through disruption and deflection,or for resource exploitation 29.Such predictions would require detailed reconnaissance concerning the composition andinternal structure of the targeted object.ⅪReceived 4February;accepted 18March 1998.1.Asphaug,E.&Melosh,H.J.The Stickney impact of Phobos:A dynamical model.Icarus 101,144–164(1993).2.Asphaug,E.et al .Mechanical and geological effects of impact cratering on Ida.Icarus 120,158–184(1996).3.Nolan,M.C.,Asphaug,E.,Melosh,H.J.&Greenberg,R.Impact craters on asteroids:Does strength orgravity control their size?Icarus 124,359–371(1996).4.Love,S.J.&Ahrens,T.J.Catastrophic impacts on gravity dominated asteroids.Icarus 124,141–155(1996).5.Melosh,H.J.&Ryan,E.V.Asteroids:Shattered but not dispersed.Icarus 129,562–564(1997).6.Housen,K.R.,Schmidt,R.M.&Holsapple,K.A.Crater ejecta scaling laws:Fundamental forms basedon dimensional analysis.J.Geophys.Res.88,2485–2499(1983).7.Holsapple,K.A.&Schmidt,R.M.Point source solutions and coupling parameters in crateringmechanics.J.Geophys.Res.92,6350–6376(1987).8.Housen,K.R.&Holsapple,K.A.On the fragmentation of asteroids and planetary satellites.Icarus 84,226–253(1990).9.Benz,W.&Asphaug,E.Simulations of brittle solids using smooth particle put.mun.87,253–265(1995).10.Asphaug,E.et al .Mechanical and geological effects of impact cratering on Ida.Icarus 120,158–184(1996).11.Hudson,R.S.&Ostro,S.J.Shape of asteroid 4769Castalia (1989PB)from inversion of radar images.Science 263,940–943(1994).12.Ostro,S.J.et al .Asteroid radar astrometry.Astron.J.102,1490–1502(1991).13.Ahrens,T.J.&O’Keefe,J.D.in Impact and Explosion Cratering (eds Roddy,D.J.,Pepin,R.O.&Merrill,R.B.)639–656(Pergamon,New York,1977).14.Tillotson,J.H.Metallic equations of state for hypervelocity impact.(General Atomic Report GA-3216,San Diego,1962).15.Nakamura,A.&Fujiwara,A.Velocity distribution of fragments formed in a simulated collisionaldisruption.Icarus 92,132–146(1991).16.Benz,W.&Asphaug,E.Simulations of brittle solids using smooth particle put.mun.87,253–265(1995).17.Bottke,W.F.,Nolan,M.C.,Greenberg,R.&Kolvoord,R.A.Velocity distributions among collidingasteroids.Icarus 107,255–268(1994).18.Belton,M.J.S.et al .Galileo encounter with 951Gaspra—First pictures of an asteroid.Science 257,1647–1652(1992).19.Belton,M.J.S.et al .Galileo’s encounter with 243Ida:An overview of the imaging experiment.Icarus120,1–19(1996).20.Asphaug,E.&Melosh,H.J.The Stickney impact of Phobos:A dynamical model.Icarus 101,144–164(1993).21.Asphaug,E.et al .Mechanical and geological effects of impact cratering on Ida.Icarus 120,158–184(1996).22.Housen,K.R.,Schmidt,R.M.&Holsapple,K.A.Crater ejecta scaling laws:Fundamental forms basedon dimensional analysis.J.Geophys.Res.88,2485–2499(1983).23.Veverka,J.et al .NEAR’s flyby of 253Mathilde:Images of a C asteroid.Science 278,2109–2112(1997).24.Asphaug,E.et al .Impact evolution of icy regoliths.Lunar Planet.Sci.Conf.(Abstr.)XXVIII,63–64(1997).25.Love,S.G.,Ho¨rz,F.&Brownlee,D.E.Target porosity effects in impact cratering and collisional disruption.Icarus 105,216–224(1993).26.Fujiwara,A.,Cerroni,P .,Davis,D.R.,Ryan,E.V.&DiMartino,M.in Asteroids II (eds Binzel,R.P .,Gehrels,T.&Matthews,A.S.)240–265(Univ.Arizona Press,Tucson,1989).27.Davis,D.R.&Farinella,P.Collisional evolution of Edgeworth-Kuiper Belt objects.Icarus 125,50–60(1997).28.Ahrens,T.J.&Harris,A.W.Deflection and fragmentation of near-Earth asteroids.Nature 360,429–433(1992).29.Resources of Near-Earth Space (eds Lewis,J.S.,Matthews,M.S.&Guerrieri,M.L.)(Univ.ArizonaPress,Tucson,1993).Acknowledgements.This work was supported by NASA’s Planetary Geology and Geophysics Program.Correspondence and requests for materials should be addressed to E.A.(e-mail:asphaug@).letters to nature440NATURE |VOL 393|4JUNE 1998Collective dynamics of ‘small-world’networksDuncan J.Watts *&Steven H.StrogatzDepartment of Theoretical and Applied Mechanics,Kimball Hall,Cornell University,Ithaca,New York 14853,USA.........................................................................................................................Networks of coupled dynamical systems have been used to model biological oscillators 1–4,Josephson junction arrays 5,6,excitable media 7,neural networks 8–10,spatial games 11,genetic control networks 12and many other self-organizing systems.Ordinarily,the connection topology is assumed to be either completely regular or completely random.But many biological,technological and social networks lie somewhere between these two extremes.Here we explore simple models of networks that can be tuned through this middle ground:regular networks ‘rewired’to intro-duce increasing amounts of disorder.We find that these systems can be highly clustered,like regular lattices,yet have small characteristic path lengths,like random graphs.We call them ‘small-world’networks,by analogy with the small-world phenomenon 13,14(popularly known as six degrees of separation 15).The neural network of the worm Caenorhabditis elegans ,the power grid of the western United States,and the collaboration graph of film actors are shown to be small-world networks.Models of dynamical systems with small-world coupling display enhanced signal-propagation speed,computational power,and synchronizability.In particular,infectious diseases spread more easily in small-world networks than in regular lattices.To interpolate between regular and random networks,we con-sider the following random rewiring procedure (Fig.1).Starting from a ring lattice with n vertices and k edges per vertex,we rewire each edge at random with probability p .This construction allows us to ‘tune’the graph between regularity (p ¼0)and disorder (p ¼1),and thereby to probe the intermediate region 0Ͻp Ͻ1,about which little is known.We quantify the structural properties of these graphs by their characteristic path length L (p )and clustering coefficient C (p ),as defined in Fig.2legend.Here L (p )measures the typical separation between two vertices in the graph (a global property),whereas C (p )measures the cliquishness of a typical neighbourhood (a local property).The networks of interest to us have many vertices with sparse connections,but not so sparse that the graph is in danger of becoming disconnected.Specifically,we require n q k q ln ðn Þq 1,where k q ln ðn Þguarantees that a random graph will be connected 16.In this regime,we find that L ϳn =2k q 1and C ϳ3=4as p →0,while L ϷL random ϳln ðn Þ=ln ðk Þand C ϷC random ϳk =n p 1as p →1.Thus the regular lattice at p ¼0is a highly clustered,large world where L grows linearly with n ,whereas the random network at p ¼1is a poorly clustered,small world where L grows only logarithmically with n .These limiting cases might lead one to suspect that large C is always associated with large L ,and small C with small L .On the contrary,Fig.2reveals that there is a broad interval of p over which L (p )is almost as small as L random yet C ðp Þq C random .These small-world networks result from the immediate drop in L (p )caused by the introduction of a few long-range edges.Such ‘short cuts’connect vertices that would otherwise be much farther apart than L random .For small p ,each short cut has a highly nonlinear effect on L ,contracting the distance not just between the pair of vertices that it connects,but between their immediate neighbourhoods,neighbourhoods of neighbourhoods and so on.By contrast,an edge*Present address:Paul zarsfeld Center for the Social Sciences,Columbia University,812SIPA Building,420W118St,New York,New York 10027,USA.Nature © Macmillan Publishers Ltd 19988letters to natureNATURE |VOL 393|4JUNE 1998441removed from a clustered neighbourhood to make a short cut has,at most,a linear effect on C ;hence C (p )remains practically unchanged for small p even though L (p )drops rapidly.The important implica-tion here is that at the local level (as reflected by C (p )),the transition to a small world is almost undetectable.To check the robustness of these results,we have tested many different types of initial regular graphs,as well as different algorithms for random rewiring,and all give qualitatively similar results.The only requirement is that the rewired edges must typically connect vertices that would otherwise be much farther apart than L random .The idealized construction above reveals the key role of short cuts.It suggests that the small-world phenomenon might be common in sparse networks with many vertices,as even a tiny fraction of short cuts would suffice.To test this idea,we have computed L and C for the collaboration graph of actors in feature films (generated from data available at ),the electrical power grid of the western United States,and the neural network of the nematode worm C.elegans 17.All three graphs are of scientific interest.The graph of film actors is a surrogate for a social network 18,with the advantage of being much more easily specified.It is also akin to the graph of mathematical collaborations centred,traditionally,on P.Erdo¨s (partial data available at /ϳgrossman/erdoshp.html).The graph of the power grid is relevant to the efficiency and robustness of power networks 19.And C.elegans is the sole example of a completely mapped neural network.Table 1shows that all three graphs are small-world networks.These examples were not hand-picked;they were chosen because of their inherent interest and because complete wiring diagrams were available.Thus the small-world phenomenon is not merely a curiosity of social networks 13,14nor an artefact of an idealizedmodel—it is probably generic for many large,sparse networks found in nature.We now investigate the functional significance of small-world connectivity for dynamical systems.Our test case is a deliberately simplified model for the spread of an infectious disease.The population structure is modelled by the family of graphs described in Fig.1.At time t ¼0,a single infective individual is introduced into an otherwise healthy population.Infective individuals are removed permanently (by immunity or death)after a period of sickness that lasts one unit of dimensionless time.During this time,each infective individual can infect each of its healthy neighbours with probability r .On subsequent time steps,the disease spreads along the edges of the graph until it either infects the entire population,or it dies out,having infected some fraction of the population in theprocess.p = 0p = 1Regular Small-worldRandomFigure 1Random rewiring procedure for interpolating between a regular ring lattice and a random network,without altering the number of vertices or edges in the graph.We start with a ring of n vertices,each connected to its k nearest neighbours by undirected edges.(For clarity,n ¼20and k ¼4in the schematic examples shown here,but much larger n and k are used in the rest of this Letter.)We choose a vertex and the edge that connects it to its nearest neighbour in a clockwise sense.With probability p ,we reconnect this edge to a vertex chosen uniformly at random over the entire ring,with duplicate edges forbidden;other-wise we leave the edge in place.We repeat this process by moving clockwise around the ring,considering each vertex in turn until one lap is completed.Next,we consider the edges that connect vertices to their second-nearest neighbours clockwise.As before,we randomly rewire each of these edges with probability p ,and continue this process,circulating around the ring and proceeding outward to more distant neighbours after each lap,until each edge in the original lattice has been considered once.(As there are nk /2edges in the entire graph,the rewiring process stops after k /2laps.)Three realizations of this process are shown,for different values of p .For p ¼0,the original ring is unchanged;as p increases,the graph becomes increasingly disordered until for p ¼1,all edges are rewired randomly.One of our main results is that for intermediate values of p ,the graph is a small-world network:highly clustered like a regular graph,yet with small characteristic path length,like a random graph.(See Fig.2.)T able 1Empirical examples of small-world networksL actual L random C actual C random.............................................................................................................................................................................Film actors 3.65 2.990.790.00027Power grid 18.712.40.0800.005C.elegans 2.65 2.250.280.05.............................................................................................................................................................................Characteristic path length L and clustering coefficient C for three real networks,compared to random graphs with the same number of vertices (n )and average number of edges per vertex (k ).(Actors:n ¼225;226,k ¼61.Power grid:n ¼4;941,k ¼2:67.C.elegans :n ¼282,k ¼14.)The graphs are defined as follows.Two actors are joined by an edge if they have acted in a film together.We restrict attention to the giant connected component 16of this graph,which includes ϳ90%of all actors listed in the Internet Movie Database (available at ),as of April 1997.For the power grid,vertices represent generators,transformers and substations,and edges represent high-voltage transmission lines between them.For C.elegans ,an edge joins two neurons if they are connected by either a synapse or a gap junction.We treat all edges as undirected and unweighted,and all vertices as identical,recognizing that these are crude approximations.All three networks show the small-world phenomenon:L ՌL random but C q C random.00.20.40.60.810.00010.0010.010.11pFigure 2Characteristic path length L (p )and clustering coefficient C (p )for the family of randomly rewired graphs described in Fig.1.Here L is defined as the number of edges in the shortest path between two vertices,averaged over all pairs of vertices.The clustering coefficient C (p )is defined as follows.Suppose that a vertex v has k v neighbours;then at most k v ðk v Ϫ1Þ=2edges can exist between them (this occurs when every neighbour of v is connected to every other neighbour of v ).Let C v denote the fraction of these allowable edges that actually exist.Define C as the average of C v over all v .For friendship networks,these statistics have intuitive meanings:L is the average number of friendships in the shortest chain connecting two people;C v reflects the extent to which friends of v are also friends of each other;and thus C measures the cliquishness of a typical friendship circle.The data shown in the figure are averages over 20random realizations of the rewiring process described in Fig.1,and have been normalized by the values L (0),C (0)for a regular lattice.All the graphs have n ¼1;000vertices and an average degree of k ¼10edges per vertex.We note that a logarithmic horizontal scale has been used to resolve the rapid drop in L (p ),corresponding to the onset of the small-world phenomenon.During this drop,C (p )remains almost constant at its value for the regular lattice,indicating that the transition to a small world is almost undetectable at the local level.Nature © Macmillan Publishers Ltd 19988letters to nature442NATURE |VOL 393|4JUNE 1998Two results emerge.First,the critical infectiousness r half ,at which the disease infects half the population,decreases rapidly for small p (Fig.3a).Second,for a disease that is sufficiently infectious to infect the entire population regardless of its structure,the time T (p )required for global infection resembles the L (p )curve (Fig.3b).Thus,infectious diseases are predicted to spread much more easily and quickly in a small world;the alarming and less obvious point is how few short cuts are needed to make the world small.Our model differs in some significant ways from other network models of disease spreading 20–24.All the models indicate that net-work structure influences the speed and extent of disease transmis-sion,but our model illuminates the dynamics as an explicit function of structure (Fig.3),rather than for a few particular topologies,such as random graphs,stars and chains 20–23.In the work closest to ours,Kretschmar and Morris 24have shown that increases in the number of concurrent partnerships can significantly accelerate the propaga-tion of a sexually-transmitted disease that spreads along the edges of a graph.All their graphs are disconnected because they fix the average number of partners per person at k ¼1.An increase in the number of concurrent partnerships causes faster spreading by increasing the number of vertices in the graph’s largest connected component.In contrast,all our graphs are connected;hence the predicted changes in the spreading dynamics are due to more subtle structural features than changes in connectedness.Moreover,changes in the number of concurrent partners are obvious to an individual,whereas transitions leading to a smaller world are not.We have also examined the effect of small-world connectivity on three other dynamical systems.In each case,the elements were coupled according to the family of graphs described in Fig.1.(1)For cellular automata charged with the computational task of density classification 25,we find that a simple ‘majority-rule’running on a small-world graph can outperform all known human and genetic algorithm-generated rules running on a ring lattice.(2)For the iterated,multi-player ‘Prisoner’s dilemma’11played on a graph,we find that as the fraction of short cuts increases,cooperation is less likely to emerge in a population of players using a generalized ‘tit-for-tat’26strategy.The likelihood of cooperative strategies evolving out of an initial cooperative/non-cooperative mix also decreases with increasing p .(3)Small-world networks of coupled phase oscillators synchronize almost as readily as in the mean-field model 2,despite having orders of magnitude fewer edges.This result may be relevant to the observed synchronization of widely separated neurons in the visual cortex 27if,as seems plausible,the brain has a small-world architecture.We hope that our work will stimulate further studies of small-world networks.Their distinctive combination of high clustering with short characteristic path length cannot be captured by traditional approximations such as those based on regular lattices or random graphs.Although small-world architecture has not received much attention,we suggest that it will probably turn out to be widespread in biological,social and man-made systems,oftenwith important dynamical consequences.ⅪReceived 27November 1997;accepted 6April 1998.1.Winfree,A.T.The Geometry of Biological Time (Springer,New Y ork,1980).2.Kuramoto,Y.Chemical Oscillations,Waves,and Turbulence (Springer,Berlin,1984).3.Strogatz,S.H.&Stewart,I.Coupled oscillators and biological synchronization.Sci.Am.269(6),102–109(1993).4.Bressloff,P .C.,Coombes,S.&De Souza,B.Dynamics of a ring of pulse-coupled oscillators:a group theoretic approach.Phys.Rev.Lett.79,2791–2794(1997).5.Braiman,Y.,Lindner,J.F.&Ditto,W.L.Taming spatiotemporal chaos with disorder.Nature 378,465–467(1995).6.Wiesenfeld,K.New results on frequency-locking dynamics of disordered Josephson arrays.Physica B 222,315–319(1996).7.Gerhardt,M.,Schuster,H.&Tyson,J.J.A cellular automaton model of excitable media including curvature and dispersion.Science 247,1563–1566(1990).8.Collins,J.J.,Chow,C.C.&Imhoff,T.T.Stochastic resonance without tuning.Nature 376,236–238(1995).9.Hopfield,J.J.&Herz,A.V.M.Rapid local synchronization of action potentials:Toward computation with coupled integrate-and-fire neurons.Proc.Natl A 92,6655–6662(1995).10.Abbott,L.F.&van Vreeswijk,C.Asynchronous states in neural networks of pulse-coupled oscillators.Phys.Rev.E 48(2),1483–1490(1993).11.Nowak,M.A.&May,R.M.Evolutionary games and spatial chaos.Nature 359,826–829(1992).12.Kauffman,S.A.Metabolic stability and epigenesis in randomly constructed genetic nets.J.Theor.Biol.22,437–467(1969).gram,S.The small world problem.Psychol.Today 2,60–67(1967).14.Kochen,M.(ed.)The Small World (Ablex,Norwood,NJ,1989).15.Guare,J.Six Degrees of Separation:A Play (Vintage Books,New Y ork,1990).16.Bollaba´s,B.Random Graphs (Academic,London,1985).17.Achacoso,T.B.&Yamamoto,W.S.AY’s Neuroanatomy of C.elegans for Computation (CRC Press,BocaRaton,FL,1992).18.Wasserman,S.&Faust,K.Social Network Analysis:Methods and Applications (Cambridge Univ.Press,1994).19.Phadke,A.G.&Thorp,puter Relaying for Power Systems (Wiley,New Y ork,1988).20.Sattenspiel,L.&Simon,C.P .The spread and persistence of infectious diseases in structured populations.Math.Biosci.90,341–366(1988).21.Longini,I.M.Jr A mathematical model for predicting the geographic spread of new infectious agents.Math.Biosci.90,367–383(1988).22.Hess,G.Disease in metapopulation models:implications for conservation.Ecology 77,1617–1632(1996).23.Blythe,S.P .,Castillo-Chavez,C.&Palmer,J.S.T oward a unified theory of sexual mixing and pair formation.Math.Biosci.107,379–405(1991).24.Kretschmar,M.&Morris,M.Measures of concurrency in networks and the spread of infectious disease.Math.Biosci.133,165–195(1996).25.Das,R.,Mitchell,M.&Crutchfield,J.P .in Parallel Problem Solving from Nature (eds Davido,Y.,Schwefel,H.-P.&Ma¨nner,R.)344–353(Lecture Notes in Computer Science 866,Springer,Berlin,1994).26.Axelrod,R.The Evolution of Cooperation (Basic Books,New Y ork,1984).27.Gray,C.M.,Ko¨nig,P .,Engel,A.K.&Singer,W.Oscillatory responses in cat visual cortex exhibit inter-columnar synchronization which reflects global stimulus properties.Nature 338,334–337(1989).Acknowledgements.We thank B.Tjaden for providing the film actor data,and J.Thorp and K.Bae for the Western States Power Grid data.This work was supported by the US National Science Foundation (Division of Mathematical Sciences).Correspondence and requests for materials should be addressed to D.J.W.(e-mail:djw24@).0.150.20.250.30.350.00010.0010.010.11rhalfpaFigure 3Simulation results for a simple model of disease spreading.The community structure is given by one realization of the family of randomly rewired graphs used in Fig.1.a ,Critical infectiousness r half ,at which the disease infects half the population,decreases with p .b ,The time T (p )required for a maximally infectious disease (r ¼1)to spread throughout the entire population has essen-tially the same functional form as the characteristic path length L (p ).Even if only a few per cent of the edges in the original lattice are randomly rewired,the time to global infection is nearly as short as for a random graph.0.20.40.60.810.00010.0010.010.11pb。
水肥调控对西北地区马铃薯产量和水肥利用效率影响的Meta分析

2024年3月 灌溉排水学报第43卷 第3期 Mar. 2024 Journal of Irrigation and Drainage No.3 Vol.4319文章编号:1672 - 3317(2024)03 - 0019 - 08水肥调控对西北地区马铃薯产量和水肥利用效率影响的Meta 分析苏丹丹1,2,张恒嘉1,2*,邓浩亮3,周晨莉1,2,陈谢田1,2(1.甘肃农业大学,兰州 730070;2.聊城大学,山东 聊城 252059;3.河西学院,甘肃 张掖 734000)摘 要:【目的】评估水肥调控对马铃薯产量、水分利用效率(WUE )和肥料偏生产率(PFP )的影响。
【方法】采用数据整合(Meta )分析,以马铃薯产量和水肥利用效率为决策因子,筛选获得目标文献29篇,建立水-肥-产量(440组)、水-肥-WUE (318组)、水-肥-PFP (428组)共计1 186组观测值的数据库。
分析水肥调控对西北地区马铃薯产量和水肥利用效率的影响,优选西北地区马铃薯最优水肥调控区间。
【结果】对宁夏马铃薯生产而言,适量增加灌水量和施肥量至最佳水肥调控区间可增产14.12 t/hm 2,增加2.96 kg/m 3的WUE 和32.83 kg/kg 的PFP ;对甘肃马铃薯生产而言,降低施肥量至最佳施肥区间可增加27.58 kg/kg 的PFP ;对内蒙古马铃薯生产而言,降低灌水量并增加施肥量至最佳水肥调控区间,可增产17.92 t/hm 2,同时增加3.33 kg/m 3的WUE 和30.91 kg/kg 的PFP 。
【结论】西北四省(自治区)马铃薯最优水肥调控区间分别为:宁夏(灌水量900~2 100 m 3/hm 2,施肥量345~531.6 kg/hm 2)、甘肃(灌水量2 895~3 550 m 3/hm 2,施肥量420~630 kg/hm 2)、陕西(灌水量1 650~2 940 m 3/hm 2,施肥量415~630 kg/hm 2)、内蒙古(灌水量1 350~2 070 m 3/hm 2,施肥量435~675 kg/hm 2)。
文心兰侧花瓣转录组分析与调控唇瓣化变异相关转录因子的挖掘

文心兰侧花瓣转录组分析与调控唇瓣化变异相关转录因子的挖掘作者:曾思娴余让才范燕萍来源:《热带作物学报》2024年第05期关键词:文心兰;唇瓣化;转录组测序;差异表达基因中图分类号:S432.1 文献标志码:A兰科植物因其独特的花型倍受人们喜爱,MADS-box 转录因子是花的起始和发育过程中的关键调控成分,在参与花器官的发育、开花时间的调节等过程中均起着重要作用[1]。
ABCDE 模型由MADS-box 基因家族中的五类同源基因组成,这些基因通过相互作用共同决定花器官身份[2]。
因此,大多数关于兰花花器官发育的研究都集中在这些ABCDE 基因上,而关于调控兰花唇瓣发育的其他转录因子及下游相关调控网络仍不清晰,因此,探究其他相关调控机制对兰花植物分子育种具有重要意义。
文心兰是兰科文心兰属植物,因其独特的花型和艳丽的颜色是世界上具有较高观赏价值的切花品种[3]。
在长期的文心兰生长进化过程中,极易产生花型多样性,这种花型多样性主要体现在唇瓣的变化上,使其具有更高的观赏价值和生物学价值[4]。
因此揭示文心兰唇瓣多样性形成机制显得极其重要。
“花被密码模型”是目前被广泛接受的兰花花器官发育模型,该模型中,不同MADS-box 基因分别组成唇瓣复合物和萼片/花瓣复合物,这2 种蛋白复合物相互竞争决定兰花花器官身份形成[5],而文心兰花瓣形态结构多样化的其他调控网络研究仍鲜有报道。
本研究以柠檬绿文心兰(Oncidium. flexuosum‘Honey Angel’)和其侧花瓣唇瓣化变异种(突变体)为材料,对2 种侧花瓣进行RNA 转录组测序,通过MADS-box 及其他转录因子的差异表达挖掘调控文心兰唇瓣化变异关键转录因子,为建立文心兰唇瓣化变异调控关系网络,培育花型独特兰花新品种奠定基础。
1 材料与方法1.1 材料供試材料为种植在华南农业大学花卉研究中心种质资源圃中生长健壮的柠檬绿文心兰侧花瓣发生唇瓣化变异种(突变体),对照为柠檬绿文心兰(图1)。
基于蒙卡算法的乳腺癌术中放疗模型的剂量学优化

基于蒙卡算法的乳腺癌术中放疗模型的剂量学优化杨波;孔旭东;魏贤顶;孟东;陈建江【摘要】目的:探讨蒙特卡罗算法在乳腺癌术中放疗(IORT)模型剂量学优化中的应用价值。
方法采用MCTP的MCBEAM程序建立乳腺癌术中放疗模型,利用MCSIM程序对患者术前CT模拟术中影像模型进行剂量计算,分析其剂量学特点,并对靶区剂量进行优化。
结果通过蒙卡计算,优化的乳腺癌术中放疗模型方案为:靶区表面添加2~3 mm等效材料,靶区后缘添加5 mm等效材料再加2 mm铅板,这可以使90%以上等剂量线包绕整个靶区,同时可以消除>110%的热点区域,肺最大剂量<1 Gy。
结论蒙特卡罗算法在乳腺癌IORT模型剂量学优化中的应用能显著提高IORT靶区剂量的计算精度,优化剂量分布,值得临床推广。
%ObjectiveToexplorethevalueofMonteCarloalgorithminthedoseoptimiz ationofIORTmodel forbreastcancer. MethodsTheIORTmodelforbreastcancerwasestablishedwithMCTPMCBEAM program. Then the dose calculation of the intraoperative image simulated by CT was conducted with MCBEAM program to analyze the dosimetric characteristics and optimize the target dose. ResuIts Based on Monte Carlo calculation, the optimization scheme of IORT model for breast cancer was designed as the follow:adding2~3mmequivalentmaterialonthetargetsurfaceandadding5mmequivalentmaterialand 2mm leadplateonthetrailingedgeofthetarget.Thustheentiretargetregioncanbesurr oundedbymorethan 90%isodoselineandmorethan110%hotregioncanbeeliminatedwhilethemaxiumdoseofthelungislessthan 1Gy. ConcIusion The application of Monte Carlo algorithm in the dose optimization of IORT model for breast cancer can significantly improve the calculation precision of the target dose and optimize the dose distribution, which indicates that Monte Carlo algorithm is worth to be promoted in clinic.【期刊名称】《中国医疗设备》【年(卷),期】2014(000)012【总页数】4页(P105-108)【关键词】蒙特卡罗算法;乳腺癌;术中放疗;剂量优化【作者】杨波;孔旭东;魏贤顶;孟东;陈建江【作者单位】江南大学附属医院无锡市第四人民医院肿瘤放疗科,江苏无锡214062;江南大学附属医院无锡市第四人民医院肿瘤放疗科,江苏无锡214062;江南大学附属医院无锡市第四人民医院肿瘤放疗科,江苏无锡214062;江南大学附属医院无锡市第四人民医院肿瘤放疗科,江苏无锡214062;江南大学附属医院无锡市第四人民医院肿瘤放疗科,江苏无锡214062【正文语种】中文【中图分类】R730.55;TH774早期乳腺癌患者行保乳术加前哨淋巴结活检及腋窝淋巴结清扫的同时进行术中放疗(Intraoperative Radiotherapy,IORT),能显著减少局部复发和远处转移,其局控率可以与乳腺癌保乳术后全乳放疗相媲美,形成了早期乳腺癌患者保乳手术加术中放疗的治疗模式[1-2]。
常用公差

1.几何特性名词与符号(a)几何特性符号符号名词类别形体区分直度,真直度(Straightness)平面度,真平度(Flatness)真圆度(Roundness)圆柱度(Cylindrically)曲线轮廓度(Profile of a line)曲线轮廓度平行度(Parallelism)垂直度(Perpendicularity)倾斜度(Angularity)正位度,位置度(Position)同心度(Concentricity)对称度(Symmetry)(1982年起由取代)圆周偏转度,圆形偏转度(Circular runout)总偏转度,全面偏转度(Total runout)(b) 其它符号符 号 名 词直径符号(Diameter symbol)不考虑形体呎寸加添条件,和特性的尺寸无关 (Regardless of feature size modifier) 最多留料情况之加添条件,最大材料条件 (Maximum material condition modifier) 最小留情况加添条件,最小材料条件 (Least material condition modifier) 基本尺寸,精密尺寸(Basic dimension)基准形体符号,基准识别符号(Datum feature symbol)最多留料情况(MMC),Maximum- Material Condition最多留料情况是指一个形体包容最大的材料量,即零件重量最重的时候。
例如最小孔的尺寸或最大轴的尺寸。
如下面图示,直径为0.490~0.510的销子,当直径 为0.510时的重量比直径为0.490时重。
一个零件包含一个直径为0.490~0.510的孔,则零件当直径 为0.490时比0.510时,包含更多中更重.A1 .100 -A-最少留料情况,Least Material Condition最少留料情况是指一个形体它包容最小的材料量,即零件重量最轻的时候,例如最大孔的尺寸或最小轴的尺寸,它与最多留料情况(MMC)正好相反。
Ford_福特GDT形位公差培训材料_全集

GD&T for Body Engineering
7
Application
• It provides the opportunity for proper Datum selection and has the potential to significantly reduce product changes, especially those changes following final product release.
GD&T for Body Engineering
3
What is GD&T
• Geometric Dimensioning and Tolerancing is a technical data base through which our Product Design and Manufacturing Organisations can talk to one another via Product Data, whether on paper or the computer graphics screen
When should the Meeting take place. • Initial design concept stage, knowing the components
parameters such as size and function
Current methods use; • Past evidence, past experience, can sometimes hinder rather
• This can only be successfully achieved by the relevant PD representative attending the Master Control Plan (MCP) Meetings.