用ImageJ对Western DNA和Blot图片灰度分析
用imagej进行WB定量分析
ImagJ是一款简单的图像处理与分析软件,可以用来进行WB定量分析。
一、利用ImagJ对WB条带进行灰度分析1、File——》open 打开WB片子2、把图片转化成灰度图片image——》type——》8-bit3、消除背景影响process——》subtract background 选择50基本可以4、设置定量参数analyze——》set measurements,点击面积,平均密度和灰度值及Integrated Density 5、设置单位analyze——》set scale ,在“unit of length”的方框里输入“pixels”6、把图片转换成亮带,Edit——》invert7、选择FreehandSelection,尽量把条带圈起来,点击键盘m,出来IntDen灰度值当测定完所有条带,选结果中的“Edit ”的“SelectAll”,然后复制数据“IntDen”到Excel表即可进行分析8、复制数据IntDen进行分析二、利用ImagJ对WB条带进行密度分析1、File——》open 打开WB片子2、如条带不正,需修正image——》transform——》rotate调节angle值,直到条带水平为止3、选中矩形选项,圈中第一个条带,然后 analyze——》gels——》select firstlane(快捷键ctrl+1),然后移动第一个条带上的矩形到第二个条带上,analyze——》gels——》select secondlane(快捷键 ctrl+2),最后analyze——》gels——》plotlanes4、选中直线工具,将开口的波峰关闭5、选中魔棒工具,点击波峰可以显示波峰下面积,即条带的密度值6、以第一个数值为基数,其他数值与第一个数值的比值为相对密度The protocol of imageJ for quantitative analysis of Western blotting:- open an image- transfer the image to 8-bitsimage → type: 8 bits- Process → substract background 50- analyze → set measurements: pick area, mean gray value, inte grated density. - analyze → set scale, fill “unit of length” with “pixels”- switch the image to bright bandsedit → invert- freehand selection, choose the target area on the image . a band), type a “m” for measurement, then we get the result from a new window.- after measuring all of the bands, pick the “edit” of the result window. “select all”, copy the integrated density values to excel to analyze.The integrated density means that the area value multiplies the mean gray value. For Western blotting analysis the integrated density is very important, because the area and gray value both of them have meaning for Western blotting bands.。
ImagJWB定量分析
一、利用ImagJ对WB条带进行灰度分析1、File——》open 打开WB片子2、把图片转化成灰度图片image——》type——》8-bit3、消除背景影响process——》subtract background 选择50基本可以4、设置定量参数analyze——》set measurements,点击面积,平均密度和灰度值及Integrated Density5、设置单位analyze——》set scale ,在“unit of length”的方框里输入“pixels”6、把图片转换成亮带,Edit——》invert7、选择FreehandSelection,尽量把条带圈起来,点击键盘m(小写),出来IntDen灰度值8、复制数据IntDen进行分析二、利用ImagJ对WB条带进行密度分析1、File——》open 打开WB片子2、如条带不正,需修正image——》transform——》rotate调节angle值,直到条带水平为止3、选中矩形选项,圈中第一个条带,然后analyze——》gels——》select firstlane(快捷键ctrl+1),然后移动第一个条带上的矩形到第二个条带上,analyze——》gels——》select second lane(快捷键ctrl+2),最后analyze——》gels——》plotlanes4、选中直线工具,将开口的波峰关闭5、选中魔棒工具,点击波峰可以显示波峰下面积,即条带的密度值6、以第一个数值为基数,其他数值与第一个数值的比值为相对密度*/link?url=iFFzpXWQu3ULvbjcoe0ME-Oi1oVTR3ANKR6xYvQXfMPUjK3Re5lnNI2kRpSadvUdXUPUr9 zJvJau9y3P4ZyoMxZR8ghHwpvUJeqRj1vn5Ty*如果有数据产生,一般是批量多次western blot结果的一个统计数据一般采取方差分析或者t检验分析就可以了*纵坐标我看文献上是用的检测蛋白的灰度值比上内参的灰度值。
image j蛋白灰度分析步骤
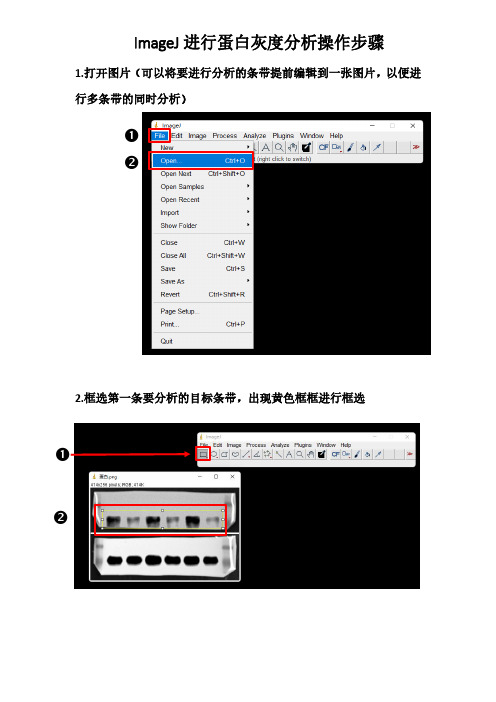
❷ ❷ 1.打开图片(可以将要进行分析的条带提前编辑到一张图片,以便进
行多条带的同时分析)
2.框选第一条要分析的目标条带,出现黄色框框进行框选
❶
❶
ImageJ 进行蛋白灰度分析操作步骤
3.将选出的条带设置为第一条要分析的条带
❶
❷
❸
4.框选下一条蛋白条带区域,操作位直接用鼠标左键移动第一条黄色框至下一条要分析的条带处
5.将框选的第二条条带设置为要进行分析的区域(如果有更多条带分析,则重复第二条带的操作步骤)
❶
❷
❸6.点击Plot Lanes,跳转至下一步
7.选择直线工具,画出各条带永道的封闭面积,然后使用魔术棒点击各条带灰度封闭取峰图,
得到result 框中定量灰度结果。
❶
❷
❸。
10分钟Get!大牛教你用imageJ对Westernblot条带进行灰度分析!
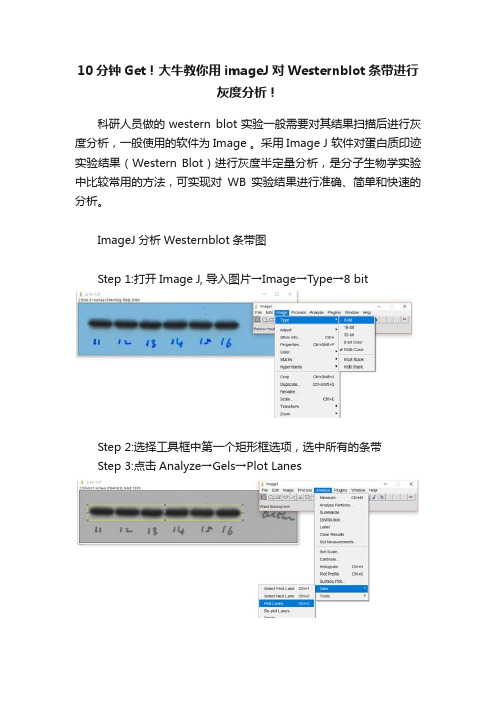
10分钟Get!大牛教你用imageJ对Westernblot条带进行
灰度分析!
科研人员做的western blot实验一般需要对其结果扫描后进行灰度分析,一般使用的软件为Image 。
采用Image J 软件对蛋白质印迹实验结果(Western Blot)进行灰度半定量分析,是分子生物学实验中比较常用的方法,可实现对WB实验结果进行准确、简单和快速的分析。
ImageJ分析Westernblot条带图
Step 1:打开Image J, 导入图片→Image→Type→8 bit
Step 2:选择工具框中第一个矩形框选项,选中所有的条带
Step 3:点击Analyze→Gels→Plot Lanes
Step 4:选用工具框中的直线工具,将开口波峰封闭
Step 5:选用工具框中的魔棒工具,点击相应的波峰,相应area值
ImageJ分析Westernblot条带图
Step 1:打开Image J, 导入图片。
Image→Type→8 bit
Step 2:扣除背景P→rocess→Subtract Background→选择50 pixels和Lightbackground
Step 3:设定参数→Analyze→Set Measures→按照下图勾选参数
Step 4:设定参数→Analyze→Set scale→unit of length选项改为pixels
Step 5:图像分割→Edit→Invert→选用椭圆或自定义工具选中条带
Step 6:Analyze→Measure→得到 IntDen值Step 7:重复Step5、6,得到所有条带的IntDen值
以上实用干货来源于课程
30分钟精通Image J图片处理。
灰度分析和细胞计数神器:ImageJ(附软件下载)
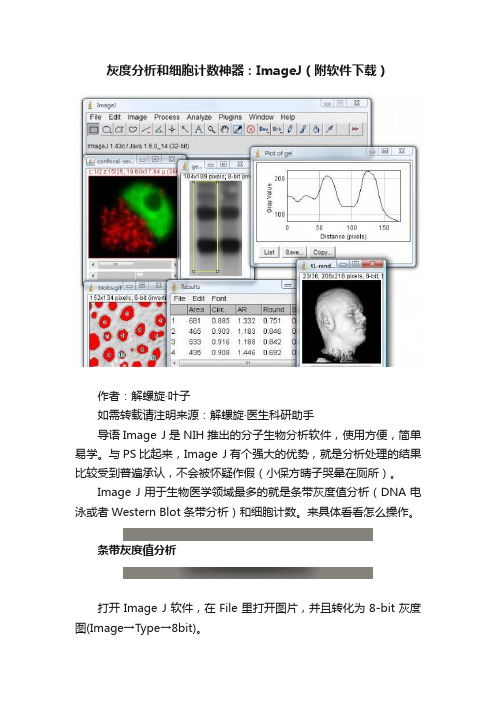
灰度分析和细胞计数神器:ImageJ(附软件下载)作者:解螺旋·叶子如需转载请注明来源:解螺旋·医生科研助手导语Image J是NIH推出的分子生物分析软件,使用方便,简单易学。
与PS比起来,Image J有个强大的优势,就是分析处理的结果比较受到普遍承认,不会被怀疑作假(小保方晴子哭晕在厕所)。
Image J用于生物医学领域最多的就是条带灰度值分析(DNA电泳或者Western Blot条带分析)和细胞计数。
来具体看看怎么操作。
条带灰度值分析打开Image J软件,在File里打开图片,并且转化为8-bit灰度图(Image→Type→8bit)。
方框工具选择并画出条带,然后选择Analyze→Gels→Select First Lane。
最后按Analyze→Gels→plot Lanes,就会出现山峰样图。
但这样是不够的,要把每个山峰分开。
这就用到了直线功能,把下面都封口后点击"魔棒"。
分别点击每个峰下方的区域,在"Results" 里就会出现面积,表示相应条带的灰度值。
如果要测多个条带的灰度,就用在Select First Lane后,点Select Next Lane来复选。
这里注意,每个框的形状大小必须是一样的。
分析图像中的颗粒数(细胞计数)打开Image J软件,在File里打开图片,并且转化为8-bit灰度图(Image→Type→8bit)。
这种黑底的图数起来非常困难,需要反相下变成白底图。
框定区域后,选择Edit→Invert。
比之前清楚多了吧,再设置下阈值(Image→Adjust→Threshold)。
经过调整后对比非常明显。
最后,进入Analyze→Analyze Particles, 键入微粒大小的下限和上限,并且选择显示轮廓(Show outlines)和显示结果(Display Results)。
点击ok,被计数的微粒将显示轮廓和编号。
Image-J-对WB进行灰度分析
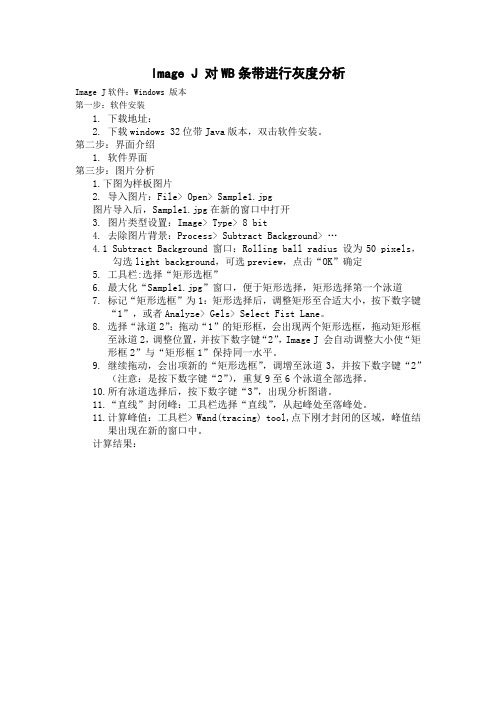
Image J 对WB条带进行灰度分析Image J软件:Windows 版本第一步:软件安装1.下载地址:2.下载windows 32位带Java版本,双击软件安装。
第二步:界面介绍1.软件界面第三步:图片分析1.下图为样板图片2.导入图片:File> Open> Sample1.jpg图片导入后,Sample1.jpg在新的窗口中打开3.图片类型设置:Image> Type> 8 bit4.去除图片背景:Process> Subtract Background> …4.1Subtract Background 窗口:Rolling ball radius 设为50 pixels,勾选light background,可选preview,点击“OK”确定5.工具栏:选择“矩形选框”6.最大化“Sample1.jpg”窗口,便于矩形选择,矩形选择第一个泳道7.标记“矩形选框”为1:矩形选择后,调整矩形至合适大小,按下数字键“1”,或者Analyze> Gels> Select Fist Lane。
8.选择“泳道2”:拖动“1”的矩形框,会出现两个矩形选框,拖动矩形框至泳道2,调整位置,并按下数字键“2”,Image J 会自动调整大小使“矩形框2”与“矩形框1”保持同一水平。
9.继续拖动,会出项新的“矩形选框”,调增至泳道3,并按下数字键“2”(注意:是按下数字键“2”),重复9至6个泳道全部选择。
10.所有泳道选择后,按下数字键“3”,出现分析图谱。
11.“直线”封闭峰:工具栏选择“直线”,从起峰处至落峰处。
11.计算峰值:工具栏> Wand(tracing) tool,点下刚才封闭的区域,峰值结果出现在新的窗口中。
计算结果:。
干货▎ImageJ分析WesternBlot蛋白条带灰度值
干货▎ImageJ分析WesternBlot蛋白条带灰度值聊点学术,一键关注“你已经是个成熟的条带了,要学会自己分析!”“连Western blot都没学好,又让我学Image J,我......”This is the dividing line.Image J分析蛋白条带灰度值首先解释一下,为什么要分析灰度值?灰度的概念是使用黑色调表示物体,即用黑色为基准色,不同的饱和度的黑色来显示图像。
采用ECL发光时,蛋白条带发出的荧光会曝光在胶片上,留下的黑色条带。
然而胶片扫描后为蓝色背景、黑色条带,这并不是单纯的黑灰白颜色。
因此,我们首先得在Photoshop 中将整张图片去色,使彩色图片变成黑白图片,形成近灰色背景、黑色条带的图片类型。
此时,条带的深浅和面积综合代表着蛋白的量。
灰度值分析自然就成为我们的首选。
延伸说一下,免疫组织化学染色(IHC)结果本身为近白色背景、棕黄色阳性表达,这时我们就不能直接用灰度反映阳性表达强弱了,而是积分吸光度,也就是咱们常说的平均光密度(IOD)。
如果你真的想用灰度计算IHC结果,显然你需要将图片转为灰度图再计算。
此处不表。
分析图文步骤如下:Image J软件界面↓1. 图片转换为黑白图:首先使用Photoshop打开胶片扫描图片,点击“图像>调整>去色”,将彩色图片转化为黑白图片,并使用裁剪工具将目标条带裁剪至合适大小后另存图片。
2.打开Image J软件:2.1.打开图片文件:File>Open;将图片转化为8bit类型:Image>Type>8-bit。
(此步骤的目的是为了将图片的每个像素用8bit表示,这样的话,整个图片的灰度将分为256个级别,即黑、灰、白的像素模式;若保留原始的16bit格式或RGB格式,图片灰度级别会呈指数增长,并有其它颜色混入,造成计算误差。
)2.2.将整张图片背景灰度均一化,消除图片背景影响:Process>Subtract Background,默认数值为50即可。
用ImageJ对Western DNA和Blot图片灰度分析
用ImageJ对W estern Blot图片灰度分析教程收集于互联网来源中生网The good news is that even if you don't have access t o a photo editing program such as Photoshop, you can now do all the same analyses using free programs. My favorite option is the freely available ImageJ from the National Institut es of Health.The homepage for ImageJ is here: /ij/index.html wherein you can find links t o the download, document ation, additional plugins and so on.Once ImageJ is inst alled, open it up and open your scanned film file. We'll start the ImageJ section by duplicating the method outlined above for Phot oshop.1. Open your file.2. Under Image>Type click on 8-bit t o convert the image to grayscale.3. Go to the menu Process>Subt ract Background. Try a rolling ball radius of 50. This removes some of the background coloration from your image.4. Go to Analyze>Set Measurements, and click the boxes for Area, Mean Gray Value, and Int egrated D ensit y.5. Go to Analyze>Set Scale, and ent er "pixels" in the box next t o Unit of length.6. Go to Edit>Invert (or hit Ct rl+Shift+I) t o invert the colors on the image. Now the dark areas are light, and the light areas are dark. As outlined above, this has the benefit of making the measured values for bands increase with increasing prot ein expression.7. Choose the F reehand Selection tool from the t ool palette.8. Draw a line around the boundary of your first band. As above, you need to use your own judgement aboutwhere t he edges of the band are, and what is simply background noise.9. Hit the m key to take a measurement of the enclose area that you select ed. The Result s window should pop up, and each of the measurements you select ed in step 4 should appear. Not e that the Integrated Density column is simply the Area and Mean Gray Value columns multiplied together.10. Use the Freehand Selection tool to select the next band, and press m to take the measurement. Repeat this for each of you bands, including the st andard.11. When you are finished, you can go to the Edit menu in the Results window, and choose Copy All. You can then paste the results into a spreadsheet for lat er use.教你使用ImageJ分析电泳条带灰度比-ImageJ使用教程ImageJ这套软件可以自动帮你你计算细胞数,也可以定量分析DNA电泳或是Western blot条带。
IMAGE-J灰度分析
IMAGE J灰度分析DNA 灰度分析方法11.首先打开软件后,开启图档;2.请先做校正,选择Analyze底下的Calibrate选项,再选择校正的模式,使用Uncalibrate OD,再按ok ;3.在要分析的第一条(first lane)加上一个长型框(工具列第一个选项),再按下Analyze/Gels/select first Lane快速键(Ctr+1),此时框架中会出现一个号码1,之后可以移动框架到第二个lane再选择Analyze/Gels/select second Lane快速键(Ctr+2),当然可以一直加下去,最后按Analyze/Gels/plot Lanes快速键(Ctr +3);4.分析以后会出现图型表示你刚选择的框内的影像强度,此时可以看到有几个比较高的区段,就是我们想定量的band,使用直线工具(工具列第五个选项)先将图形中高点为有band 的区域和没有band的区域分开再,使用魔术棒工具(工具列第八个选项)点选要分析的区域;5.当我们点选分析时,在result的对话视窗会出现分析的数据,依序点选就会出现每个band的值。
方法2@1.打开图2.选择要分析的条带,Ctrl+M测WB灰度分析1. 打开文件;2. 把图片转化成灰度图片:Image>Type 选8-bit;3. 消除背景影响:Process>Subtract Background. 选择50基本可以。
4. 设置定量参数: Analyze>Set Measurements, 点击面积,平均密度,和灰度值及Integrated Density;5. 设置单位 Analyze>Set Scale,在“Unit of length”边的方框里输入 "pixels";6. 把图片转换成亮带,Edit>Invert ;}7. 选择Freehand Selection;尽量把条带圈起来;点击键盘m,出来IntDen灰度值;8. 用“Freehand Selection”选择下一条带,按m进行测量。
老司机带你解锁ImageJ实用技巧(下)
老司机带你解锁ImageJ实用技巧(下)文章转载自公众号科研讲坛,作者半夏今天我们继续来聊一聊ImageJ的高阶使用技巧。
问题三、为什么总是全部圈起来的灰度值,有没有大神指导呢求助!本问题涉及免疫印迹(Western Blot)分析,提问者不能分别得到每个条带的值。
灰度值0为纯黑,255为纯白,灰度值与光密度值(OD值)的关系如下图所示:以灰度来统计WB条带的话,无条带的纯白255左右,条带越黑着色越深灰度值反而越小,这与我们的认知不符。
步骤:1. File -> Open -> 打开需要分析的WB条带。
2. Image –> Type -> 8-bit, 将图像转换为8-bit的灰度图片;Image-> Invert,黑白反转,得到如下图片:3. Analyze -> Calibrate, 校正光密度值Function中选择Uncalibrated OD,左下方Global calibration,勾选表示有多张图片打开时对所有图片进行此操作。
否则只对当前图片进行此操作。
4. 在工具栏中选择矩形工具——Rectangular, 最左边的为矩形工具,选择条带:键盘上按数字1,弹出如下提示框:点Yes,键盘上按数字3,得到如下:5. 工具栏中选择直线工具——Straight,下图最右边的为直线工具,按住Shift键使用直线工具画竖线将步骤4的峰进行分割:6. 选择魔棒工具——Wand tool,分别点击分割好的峰,即可得到结果,保存结果(File -> Save as…)即可:7. WB统计分析一般将对照组标准化为100%或1,上述结果6个条带前3个为对照组。
在Excel中,先计算对照组3个的平均值(AVERAGE(B2:B4)):然后所有B列的数值除以对照组平均值,此时对照组的均值为1:8. 将所得数据放入Graphpad prism绘图即可:拓展:弯曲的WB条带应如何使用ImageJ拉直?1. 使用Segmented line沿着倾斜条带画间断线段:2. 双击Segmented line,设置线段的宽度至包含所有条带:3. 点击菜单栏Edit -> Selection-> Straighten,倾斜的WB条带即可拉直:问题四、如何统计SEM图片小球数量?步骤:1. 打开ImageJ软件,File -> Open打开SEM图片。
- 1、下载文档前请自行甄别文档内容的完整性,平台不提供额外的编辑、内容补充、找答案等附加服务。
- 2、"仅部分预览"的文档,不可在线预览部分如存在完整性等问题,可反馈申请退款(可完整预览的文档不适用该条件!)。
- 3、如文档侵犯您的权益,请联系客服反馈,我们会尽快为您处理(人工客服工作时间:9:00-18:30)。
用ImageJ对W estern Blot图片灰度分析
教程收集于互联网来源中生网
The good news is that even if you don't have access t o a photo editing program such as Photoshop, you can now do all the same analyses using free programs. My favorite option is the freely available ImageJ from the National Institut es of Health.
The homepage for ImageJ is here: /ij/index.html wherein you can find links t o the download, document ation, additional plugins and so on.
Once ImageJ is inst alled, open it up and open your scanned film file. We'll start the ImageJ section by duplicating the method outlined above for Phot oshop.
1. Open your file.
2. Under Image>Type click on 8-bit t o convert the image to grayscale.
3. Go to the menu Process>Subt ract Background. Try a rolling ball radius of 50. This removes some of the background coloration from your image.
4. Go to Analyze>Set Measurements, and click the boxes for Area, Mean Gray Value, and Int egrated D ensit y.
5. Go to Analyze>Set Scale, and ent er "pixels" in the box next t o Unit of length.
6. Go to Edit>Invert (or hit Ct rl+Shift+I) t o invert the colors on the image. Now the dark areas are light, and the light areas are dark. As outlined above, this has the benefit of making the measured values for bands increase with increasing prot ein expression.
7. Choose the F reehand Selection tool from the t ool palette.
8. Draw a line around the boundary of your first band. As above, you need to use your own judgement about
where t he edges of the band are, and what is simply background noise.
9. Hit the m key to take a measurement of the enclose area that you select ed. The Result s window should pop up, and each of the measurements you select ed in step 4 should appear. Not e that the Integrated Density column is simply the Area and Mean Gray Value columns multiplied together.
10. Use the Freehand Selection tool to select the next band, and press m to take the measurement. Repeat this for each of you bands, including the st andard.
11. When you are finished, you can go to the Edit menu in the Results window, and choose Copy All. You can then paste the results into a spreadsheet for lat er use.
教你使用ImageJ分析电泳条带灰度比-ImageJ使用教程
ImageJ这套软件可以自动帮你你计算细胞数,也可以定量分析DNA电泳或是Western blot条带。
step 1.首先打开软件后,开启图档
step 2.请先做校正,选择Analyze底下的Calibrate选项,再选择校正的模式,使用Uncalibrate OD,再按ok
按下ok之后会出现校正的图形
Step 3.在要分析的第一条(first lane)加上一个长型框(工具列第一个选项),再按下Analyze/Gels/select first L ane快速键(Ctr+1),此时框架中会出现一个号码1,之后可以移动框架到第二个lane再选择Analyze/Gels/select second Lane快速键(Ctr+2),当然可以一直加下去,最后按Analyze/Gels/plot Lanes快速键(Ctr +3)。
Step 4.分析以后会出现图型表示你刚选择的框内的影像强度,此时可以看到有几个比较高的区段,就是我们想定量的band,使用直线工具(工具列第五个选项)先将图形中高点为有band的区域和没有band的区域分开再,使用魔术棒工具(工具列第八个选项)点选要分析的区域。
Step 5.当我们点选分析时,在result的对话视窗会出现分析的数据,依序点选就会出现每个band的值。
注:当我们选择分析的条带也可以是横向选取,就可以只比较相同大小的DNA的含量,同样也可以应用在western blot 或其它类似实验条带的分析上
mageJ是一个用Java语言开发的图像处理和分析平台,具备多种图像处理和分析功能, 下载地址:http://www.uhnresearch.ca/facilities/wci f/download.php。
该软件是一个免费软件,支持插件技术,而且开放源代码。
ImageJ在医学影像学诊断领域的应用非常广泛,以下就I该软件在医学显微图像处理方面(血清蛋白电图谱分析)的应用进行探讨,与战友们交流。
一、软件准备
下载并安装ImageJ: 得益于Java 的跨平台性优势,ImageJ可以运行在L inux、Mac OS和Windows等平台上,这也是该软件的一大优势,是其得以广泛应用的原因之一。
ImageJ的运行需要JAV A运行环境(JRE11311或Java 11411SDK)的支持,从官方网站上下载的压缩包中已包含JRE11311。
此外, 从SUN 的官方网站(下载地址: http: / /java1sun1com / j2 se / )还可以免费下载各种版本的JA V A运行
环境。
运行ImageJ 最少需要64M内存,建议配置256M内存,这样在处理大幅图像或序列图像时就不会有停顿感。
二、实验分析:
分析电泳图谱: (1)启动ImageJ ,打开采集的图像。
用方形图像选择工具在图像上圈定一个电泳图谱(注意要将各个条带都全部框住) , 然后按1 键(相应的菜单操作为:Anal y ze→Gels→Select First Lane) ,标记和选定该电泳图谱。
如果一幅图像上有多个电泳图谱,将鼠标放在该方框的中央,按住鼠标拖动方框(注意不要改变方框大小)将其放在下一个电泳图谱上,按2键(相应的菜单操作为: Anal y ze→Gels→Select Next Lane) ,分别标记和选定这些电泳图谱。
(2)所有电泳图谱都标记完毕后,按3键(相应的菜单操作
为:Anal y ze→Gels→P lot Lanes)生成所有选定电泳图谱的光密度分布曲线。
用直线工具在每一条曲线上划一条基线,使得曲线上的每一个波峰都能与基线围成一个封闭区域。
如果生成的曲线较多,可以用手形工具上下移动图像执行此操作。
(3)选用魔术棒工具,在曲线上的每一个波峰的封闭区域内单击鼠标,程序自动计算该封闭区域的面积,一个曲线上的所有波峰的面积都计算完毕后执行Analyze →Gels→Label P eaks,程序自动计算每一波峰的面积百分比,并标记在曲线上。
此值即为该电泳图谱上各个条带的含量百分比。
(4)一个电泳图谱分析完毕后,执行Analyze→Gels→ResetCounter将计数器回零,重复第3步操作,分析下一个电泳图谱的光密度曲线。
统计学处理:用E xcel 2000进行t检验。
另有实例参考文献一篇,上传至QQ群共享邮箱。