R语言练习题
R语言 网上测试题

考题理论题 (50分)⽆特殊标注的题为1分,其它为标注的分数。
选答题特殊标注,若⽆标注,则必答。
必答题不答着,不合格。
1. 简述R,Rstudio的区别?2. R中如何查看函数的帮助信息?3. R中变量名字命名有什么需要遵守的规则?4. R中怎么判断⼀个变量的类型是数值型?5. scale函数对数据做了什么? (2分)6. R中如何把矩阵 (matrix)转换为数据框 (data frame)?7. 取出矩阵中所有值都为0的⾏? (2分)8. 写程序从矩阵和数据框中提取特定列?9. 简述reshape2中定义的wide format和long format矩阵的区别? ggplot2绘图接受的是那种格式? (3分)10. ggplot2绘制热图使⽤的是什么函数? (2分)11. ggplot2绘图时fill和color的区别是? (2分)12. ggplot2绘图时如何调整横轴标签的旋转⻆度?13. 因矩阵中数值相差很⼤导致绘制出的热图颜⾊区分不明显时有哪⼏种解决⽅式? (3分)14. ggplot2绘制热图时如何⾃定义⾏或列的顺序? (3分)15. 箱线图怎么理解?(2分)16. ggplot2绘图时如何调整legend的位置?17. ⽕⼭图横轴和纵轴分别表⽰什么?18. PCA图怎么理解? (2分)19. ⽣存分析图怎么理解? (2分)20. R中安装包的⽅式有⼏种? (2分)21. Cytoscape输⼊数据最少需要⼏列? (2分)22. Cytoscape中有哪⼏种常⽤的布局算法? (3分)23. Cytoscape怎么给边增加箭头? (2分)24. Cytoscape中怎么插⼊柱状图? (2分)25. ⽮量图和标量图有什么区别? (2分)26. 什么是Adobe Illustrator (AI)的剪切蒙版?27. AI中选择⼯具和直接选择⼯具什么区别?28. AI中设置⼀组⽂字之间等距对⻬使⽤哪个按钮?29. AI中怎么给⼀个组分赋予另⼀组分的属性,⽐如有1条线是2 pt 红⾊,如何快速的让其它线跟其属性⼀致?。
R语言自测习题 (附答案)

Sample Midterm,Statistics133,Fall20121.What is meant by“vectorized calculations”in R?Provide an example.If we have a vector x,an expression such as,x+2or x3,is vectorized in that the computation is performed on each element of the vector,i.e.2is added to each element of x or each element of x is cubed.There is no need to loop of each element of the vector to perform the computation.2.Describe two important di↵erences between a data frame and a matrix in R.A data frame is essentially a list of vectors of the same length,whereas a matrix isessentially a vector with shape information.Data frames can have columns/vectors that are di↵erent types,whereas all values ina matrix must be the same primitive element.Data frames can be indexed with$3.Data on37parents of babies born at Kaiser Hospital in the1960s is available in adata frame called parents.The variables age,ed,ht,and wt are the mother’s age, education level,height and weight.The variables that start with the letter d are corresponding variables for the fathers.>head(parents)age ed ht wt dage ded dht dwt marital inc127College6210031College65110Married[2500,5000)233College6413538College70148Married[7000,8000)328High School6411532Some High School NA NA Married[5000,6000) 436College6919043Some College68197Married[12500,15000)523College6712524College NA NA Married[2500,5000)625High School629328High School64130Married[7000,8000)Provide the return value for each of the following expressions:dim(parents)[1]3710class(parents\$marital)[1]"factor"Write an R expression tofind the subset of parents where the mother is over40.parents[parents$age>40,]Write an R expression using an apply function to return the class of each variable in the data frame.sapply(parents,class)Write one R expression using an apply function to return the number of NAs in each variable(recall that there is an is.na()function returns a logical indicating the presence of NAs)sapply(parents,function(x)sum(is.na(x)))4.Here is a list in R,>x$a[1]0.038954420.776588660.83532332$b[,1][,2][1,]14[2,]25[3,]36Write one line of R code to extract thefirst row of the matrix.x$b[1,]5.Suppose we have a matrix m in R,and we’ve just executed the following:>dim(m)[1]50003>head(m)[,1][,2][,3][1,]-2.2468718-0.7733515-3.4332337[2,]0.5771791-0.70585520.8052004[3,]-1.0125651-0.2699696-1.1368809[4,]-0.2504269-1.1205857-0.3498572[5,] 2.67471950.25506780.1225329[6,] 1.0095424-1.29000790.1387224We need to create a vector containing the sum of the squared entries in each row of m.Write R code to do this in two di↵erent ways:(a)using a for loopsumM=rep(0,nrow(m))for(i in1:m){sumM[i]=sum(m[i,]^2)}(b)using the apply functionapply(m,1,function(x)sum(x^2))6.Write down what the value of x will contain after each line of R code,if the commandsare executed sequentially.>x=seq(0,8,length=5)02468>x[x<4]=NANA NA468>x[5]=10NA NA4610>x[]=000000>x=12127.Someone wants to study the distribution of the sum of three rolls of a die.To do thisshe designs a simulation study.In thefirst step,she writes a function to generate the sum of three random tosses of a fair die.In the second step she uses this function to generate1,000of these sums.(a)Write the function for thefirst step.sum3=function(){sum(sample(1:6,3,replace=TRUE))}(b)Write one line of code that uses the function from thefirst step to generate the1,000random sumsreplicate(1000,sum3)8.We want to compute the sum of the absolute deviations from the median for a vector.For example for a vector x=1:3,x has a median of2,and the absolute deviations from the median are1,0,and1so the sum of the absolute deviations from the median is2.。
r语言编程试题
r语言编程试题
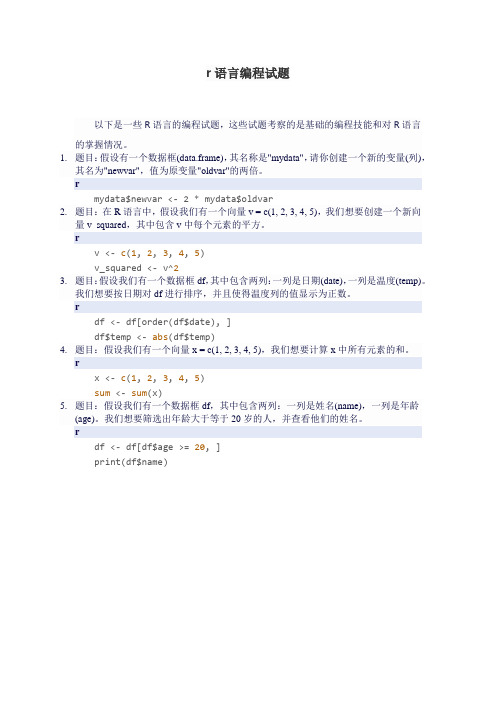
以下是一些R语言的编程试题,这些试题考察的是基础的编程技能和对R语言
的掌握情况。
1.题目:假设有一个数据框(data.frame),其名称是"mydata",请你创建一个新的变量(列),
其名为"newvar",值为原变量"oldvar"的两倍。
r
mydata$newvar <- 2 * mydata$oldvar
2.题目:在R语言中,假设我们有一个向量v = c(1, 2, 3, 4, 5),我们想要创建一个新向
量v_squared,其中包含v中每个元素的平方。
r
v <- c(1, 2, 3, 4, 5)
v_squared <- v^2
3.题目:假设我们有一个数据框df,其中包含两列:一列是日期(date),一列是温度(temp)。
我们想要按日期对df进行排序,并且使得温度列的值显示为正数。
r
df <- df[order(df$date), ]
df$temp <- abs(df$temp)
4.题目:假设我们有一个向量x = c(1, 2, 3, 4, 5),我们想要计算x中所有元素的和。
r
x <- c(1, 2, 3, 4, 5)
sum <- sum(x)
5.题目:假设我们有一个数据框df,其中包含两列:一列是姓名(name),一列是年龄
(age)。
我们想要筛选出年龄大于等于20岁的人,并查看他们的姓名。
r
df <- df[df$age >= 20, ]
print(df$name)。
R语言自测习题(附答案)

R语言自测习题(附答案)Sample Midterm,Statistics133,Fall20121.What is meant by“vectorized calculations”in R?Provide an example.If we have a vector x,an expression such as,x+2or x3,is vectorized in that the computation is performed on each element of the vector,i.e.2is added to each element of x or each element of x is cubed.There is no need to loop of each element of the vector to perform the computation.2.Describe two important di?erences between a data frame and a matrix in R.A data frame is essentially a list of vectors of the same length,whereas a matrix isessentially a vector with shape information.Data frames can have columns/vectors that are di?erent types,whereas all values ina matrix must be the same primitive element.Data frames can be indexed with$3.Data on37parents of babies born at Kaiser Hospital in the1960s is available in adata frame called parents.The variables age,ed,ht,and wt are the mother’s age, education level,height and weight.The variables that start with the letter d are corresponding variables for the fathers.>head(parents)age ed ht wt dage ded dht dwt marital inc127College6210031College65110Married[2500,5000)233College6413538College70148Married[7000,8000)328High School6411532Some High School NA NAMarried[5000,6000) 436College6919043Some College68197Married[12500,15000)523College6712524College NA NA Married[2500,5000)625High School629328High School64130Married[7000,8000) Provide the return value for each of the following expressions: dim(parents)[1]3710class(parents\$marital)[1]"factor"Write an R expression to?nd the subset of parents where the mother is over40.parents[parents$age>40,]Write an R expression using an apply function to return the class of each variable in the data frame.sapply(parents,class)Write one R expression using an apply function to return the number of NAs in each variable(recall that there is an is.na()function returns a logical indicating the presence of NAs) sapply(parents,function(x)sum(is.na(x)))4.Here is a list in R,>x$a[1]0.038954420.776588660.83532332$b[,1][,2][1,]14[2,]25[3,]36Write one line of R code to extract the?rst row of the matrix.x$b[1,]5.Suppose we have a matrix m in R,and we’ve just executed the following:>dim(m)[1]50003>head(m)[,1][,2][,3][1,]-2.2468718-0.7733515-3.4332337[2,]0.5771791-0.70585520.8052004[3,]-1.0125651-0.2699696-1.1368809[4,]-0.2504269-1.1205857-0.3498572[5,] 2.67471950.25506780.1225329[6,] 1.0095424-1.29000790.1387224We need to create a vector containing the sum of the squared entries in each row of m.Write R code to do this in two di?erent ways:(a)using a for loopsumM=rep(0,nrow(m))for(i in1:m){sumM[i]=sum(m[i,]^2)}(b)using the apply functionapply(m,1,function(x)sum(x^2))6.Write down what the value of x will contain after each line of R code,if the commandsare executed sequentially.>x=seq(0,8,length=5)02468>x[x<4]=NANA NA468>x[5]=10NA NA4610>x[]=000000>x=12127.Someone wants to study the distribution of the sum of three rolls of a die.To do thisshe designs a simulation study.In the?rst step,she writes a function to generate the sum of three random tosses of a fair die.In the second step she uses this function to generate1,000of these sums.(a)Write the function for the?rst step.sum3=function(){sum(sample(1:6,3,replace=TRUE))}(b)Write one line of code that uses the function from the?rst step to generate the1,000random sumsreplicate(1000,sum3)8.We want to compute the sum of the absolute deviations from the median for a vector.For example for a vector x=1:3,x has a median of2,and the absolute deviations from the median are1,0,and1so the sum of the absolute deviations from the median is2.。
r语言入门100道题
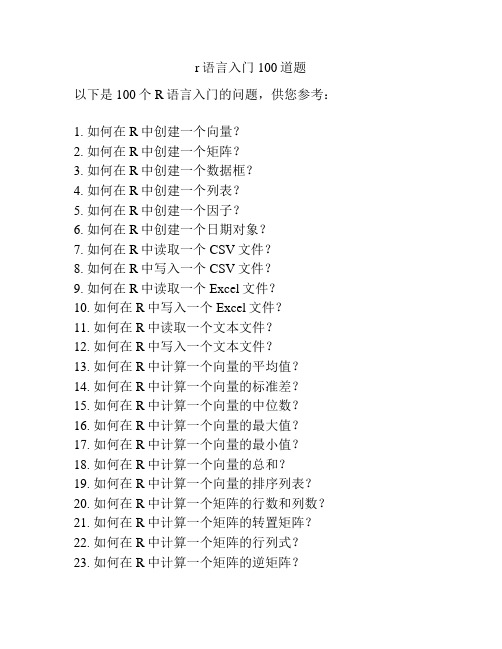
r语言入门100道题以下是100个R语言入门的问题,供您参考:1. 如何在R中创建一个向量?2. 如何在R中创建一个矩阵?3. 如何在R中创建一个数据框?4. 如何在R中创建一个列表?5. 如何在R中创建一个因子?6. 如何在R中创建一个日期对象?7. 如何在R中读取一个CSV文件?8. 如何在R中写入一个CSV文件?9. 如何在R中读取一个Excel文件?10. 如何在R中写入一个Excel文件?11. 如何在R中读取一个文本文件?12. 如何在R中写入一个文本文件?13. 如何在R中计算一个向量的平均值?14. 如何在R中计算一个向量的标准差?15. 如何在R中计算一个向量的中位数?16. 如何在R中计算一个向量的最大值?17. 如何在R中计算一个向量的最小值?18. 如何在R中计算一个向量的总和?19. 如何在R中计算一个向量的排序列表?20. 如何在R中计算一个矩阵的行数和列数?21. 如何在R中计算一个矩阵的转置矩阵?22. 如何在R中计算一个矩阵的行列式?23. 如何在R中计算一个矩阵的逆矩阵?24. 如何在R中计算一个矩阵的特征值和特征向量?25. 如何在R中计算一个矩阵的行和列的总和?26. 如何在R中计算一个数据框的行数和列数?27. 如何在R中计算一个数据框的列的平均值?28. 如何在R中计算一个数据框的列的标准差?29. 如何在R中计算一个数据框的列的中位数?30. 如何在R中计算一个数据框的列的最大值?31. 如何在R中计算一个数据框的列的最小值?32. 如何在R中计算一个数据框的列的总和?33. 如何在R中从一个向量中选择指定的元素?34. 如何在R中从一个向量中删除指定的元素?35. 如何在R中从一个向量中查找指定的元素?36. 如何在R中从一个向量中替换指定的元素?37. 如何在R中从一个向量中添加元素?38. 如何在R中从一个向量中提取唯一的元素?39. 如何在R中从一个矩阵中选择指定的行和列?40. 如何在R中从一个矩阵中删除指定的行和列?41. 如何在R中从一个矩阵中查找指定的行和列?42. 如何在R中从一个矩阵中替换指定的行和列?43. 如何在R中从一个矩阵中添加行和列?44. 如何在R中从一个数据框中选择指定的行和列?45. 如何在R中从一个数据框中删除指定的行和列?46. 如何在R中从一个数据框中查找指定的行和列?47. 如何在R中从一个数据框中替换指定的行和列?48. 如何在R中从一个数据框中添加行和列?49. 如何在R中对一个向量进行排序?50. 如何在R中对一个矩阵的行和列进行排序?51. 如何在R中对一个数据框的列进行排序?52. 如何在R中对一个数据框的多个列进行排序?53. 如何在R中对一个向量进行分组求和?54. 如何在R中对一个数据框的列进行分组求和?55. 如何在R中对一个向量进行分组统计?56. 如何在R中对一个数据框的列进行分组统计?57. 如何在R中对一个向量进行条件筛选?58. 如何在R中对一个数据框的列进行条件筛选?59. 如何在R中对一个向量进行条件替换?60. 如何在R中对一个数据框的列进行条件替换?61. 如何在R中对一个数据框的列进行合并去重?62. 如何在R中对一个数据框的列进行合并求和?63. 如何在R中对一个数据框的列进行合并求平均值?64. 如何在R中计算一个向量的累计和?65. 如何在R中计算一个向量的累计乘积?66. 如何在R中计算一个向量的累计均值?67. 如何在R中计算一个矩阵的累计和?68. 如何在R中计算一个矩阵的累计乘积?69. 如何在R中计算一个矩阵的累计均值?70. 如何在R中计算一个数据框的累计和?71. 如何在R中计算一个数据框的累计乘积?72. 如何在R中计算一个数据框的累计均值?73. 如何在R中计算两个向量的点积?74. 如何在R中计算两个向量的叉积?75. 如何在R中计算两个向量的欧几里得距离?76. 如何在R中计算两个矩阵的乘积?77. 如何在R中计算两个矩阵的点积?78. 如何在R中计算两个矩阵的叉积?79. 如何在R中将一个向量转换为矩阵?80. 如何在R中将一个向量转换为数据框?81. 如何在R中将一个向量转换为列表?82. 如何在R中将一个向量转换为因子?83. 如何在R中将一个矩阵转换为向量?84. 如何在R中将一个矩阵转换为数据框?85. 如何在R中将一个矩阵转换为列表?86. 如何在R中将一个矩阵转换为因子?87. 如何在R中将一个数据框转换为向量?88. 如何在R中将一个数据框转换为矩阵?89. 如何在R中将一个数据框转换为列表?90. 如何在R中将一个数据框转换为因子?91. 如何在R中将一个列表转换为向量?92. 如何在R中将一个列表转换为矩阵?93. 如何在R中将一个列表转换为数据框?94. 如何在R中将一个列表转换为因子?95. 如何在R中将一个因子转换为向量?96. 如何在R中将一个因子转换为矩阵?97. 如何在R中将一个因子转换为数据框?98. 如何在R中将一个因子转换为列表?99. 如何在R中将一个日期对象转换为字符对象?100. 如何在R中将一个字符对象转换为日期对象?这些问题涵盖了R语言中一些基本操作的方方面面,希望对您入门R语言有所帮助。
R语言考试

一、填空题(每小题2分,共40分)1.Auckland(奥克兰)大学的Robert Gentleman和Ross Ihaka及其他志愿人员开发了一个R系统,目前由______________维护.答:2.求均值函数是_____________.答:3.求标准差函数是_____________.答:4.向量建立函数是_____________.答:5.表示赋值的符号是<- 和_____________.答:6.x = c(0/1, 0/0, 1/0, NA); 则x= ____________________________.答:bs = paste("X", 1:6, sep = ""); 则labs= ____________________________.答:8.x = c(1,4,7); 则x[x<5] = ____________________________.答:9.z = c(-1, 1:3, NA); y = z[!is.na(z)]; 则y= ____________________________.答:10.v = 10:20, 则v[-(1:5)]= ____________________________.答:11.要使用aov()函数进行方差分析,应当具备可加性,独立正态性和___________.答:12.单因素方差分析中在比较两个以上的总体时,广泛使用Kruskal-Wallis秩和检验,它是对两个以上样本进行比较的非参数检验方法, 其函数是_________________.答:13.在R软件中,对数据进行中心化(不做标准化)的计算函数为______________________.答:14.主成分分析(principal component analysis)是将多指标化为少数几个__________的一种统计分析方法.答:15.查看当前工作路径的命令为?将当前工作路径的修改为D:\program files\newR的命令为?答:16.加载vegan包的命令为?查看当前工作空间已经加载的包的命令为?答:17.表示赋值的符号有?答:18.查看工作空间中所有以字母a开头的对象的命令为?删除工作空间中包含字母b的所有对象的命令为?答:19.计算数据x的中位数的命令为?计算数据x的20%和70%分位点的值的命令为?答:20.Shapiro-Wilk正态性W检验函数为?经验分布的Kolmogorov-Smirnov检验函数为?答:二、简答题(每小题5分,共10分)1.在多元线性回归模型中,判断解释变量之间是否存在多重共线性的函数为?判断标准是什么?若存在多重共线性,应该怎么处理?答:2.编写一个R程序(函数):输入一个整数n,如果n ≤ 0,则中止运算,并输出一句话:“要求输入一个正整数”;否则,如果n是偶数,则将n除以2,并赋给n;否则,将3 n + 1赋给n。
R语言练习

R语言练习一、填空1.下列变量名中的是合法变量(A)char_1,data_2,x_j (B)x*y ,a.1 (C)x\y ,a1234 (D)end ,2bcx 2.已知x 为一个向量,计算其正弦函数的运算为(A)SEC(X) (B)SIN(x) (C)sin(x) (D)secx 3.已知x =2^(0:3),则命令2*x 返回的结果为 4.命令rep(c(1,3),each=3)返回结果为 5.命令matrix(2:7,nrow=2,byrow=F)返回的结果为6.已知矩阵?=16128415117314106213951A ,则命令A%*%A 返回的结果为 7.已知矩阵??=129631185210741B ,则命令dim(B)返回的结果为 8.已知矩阵?=43214321A ,则命令rowSums(A)返回的结果为 9.已知矩阵=54324321A ,则命令apply(A,2,sum)返回的结果为10.命令rbind(1:3,1:4)返回的结果为11.执行命令b=list(name="Fred",wife="Mary",no.children=3,child.ages=c(4,7 ,9))后,则命令length(b)返回的结果为12.执行命令xx=array(1:24,c(3,4,2))后,则命令xx[2,1:3,2]返回的结果为13.已知变量x=c(2,3),则执行命令x[5]<-5后变量x 的结果为14.命令paste("x",1:5,sep="")返回的结果为 15.已知变量x=(1:10)+2,则命令x[1:5]返回的结果为二、写出相应的命令和程序:1、用函数rep()构造一个向量x,它由5个3,10个2,98个1构成2、10位同学的姓名、性别、年龄、身高、体重数据如下:Name Sex Age Height WeightAlice F 13 56.5 84.0Sandy F 11 51.3 50.5Sharon F 15 62.5 112.5Tammy F 14 62.8 102.5Alfred M 14 69.0 112.5Duke M 14 63.5 102.5Guido M 15 67.0 133.0Robert M 12 64.8 128.0Thomas M 11 57.5 85.0William M 15 66.5 112.0(1)用数据框的形式读入数据,数据框的名称为my.class(2)将上述数据写成一个纯文本的文件(文件名为class.txt),并用函数read.table()读取文件中的身高和体重数据(3)按性别分组绘制学生身高的直方图3、新建一个脚本文件,名为vector,,完成如下功能(1)创建一个2到50的向量vector1(2)选取vector1中的第10,15,20个元素(3)选取vector1中第10到20个元素(4)选取vector1中值大于40的元素(5)将向量中的数据降序排列4、新建一个脚本文件,名为plot,完成如下功能:(1)生成0到2之间的50个随机数,分别命名为x,y(2)绘制散点图,要求:主标题为:“散点图”,横轴命名为“横坐标”,纵轴命名为“纵坐标”设置文本颜色为红色(3)在散点图的坐标为(0.6,0.6)的位置写入文本“text at (0.6,0.6)”(4)在h=0.6,v=0.6处分别添加参考线5、编写一个函数sqtest,给出两个数之后,直接给出这两个数的平方和,并调用该函数,实现计算20^2+15^2。
r语言基础题

r语言基础题共20题含详解理解R 语言的基础知识对于进行数据分析和统计建模是至关重要的。
以下是一组R 语言的基础题目,每个题目都附有解释和答案。
1. 如何创建一个向量`vec` 包含数值`1, 2, 3, 4, 5`?答案:```Rvec <- c(1, 2, 3, 4, 5)```2. 如何获取向量`vec` 的长度?答案:```Rlength(vec)```3. 如何访问向量`vec` 的第三个元素?答案:```Rvec[3]```4. 如何创建一个矩阵`mat`,包含两行三列,元素为数值`1` 至`6`?答案:```Rmat <- matrix(1:6, nrow=2, ncol=3)```5. 如何获取矩阵`mat` 的第二行?答案:```Rmat[2, ]```6. 如何计算向量`vec` 中所有元素的平均值?答案:mean(vec)```7. 如何计算矩阵`mat` 中每一列的和?答案:```RcolSums(mat)```8. 如何创建一个包含从`5` 到`15` 的整数的序列?答案:```Rseq(5, 15)```9. 如何定义一个函数`square`,接受一个参数`x` 并返回其平方?答案:```Rsquare <- function(x) {return(x^2)}```10. 如何读取一个名为`data.csv` 的CSV 文件,并将其存储为数据框`df`?答案:```Rdf <- read.csv("data.csv")```11. 如何过滤数据框`df`,只保留列`A` 大于`10` 的行?答案:```Rdf_filtered <- df[df$A > 10, ]```12. 如何在R 中画一个散点图,其中x 轴为数据框`df` 中的列`A`,y 轴为列`B`?答案:plot(df$A, df$B)```13. 如何在R 中安装并加载`ggplot2` 包?答案:```Rinstall.packages("ggplot2")library(ggplot2)```14. 如何使用`ggplot2` 画一个散点图,其中x 轴为数据框`df` 中的列`A`,y 轴为列`B`?答案:```Rggplot(df, aes(x=A, y=B)) + geom_point()```15. 如何在R 中创建一个名为`my_list` 的列表,包含一个向量、一个矩阵和一个数据框?答案:```Rmy_vector <- c(1, 2, 3)my_matrix <- matrix(4:9, nrow=2)my_dataframe <- data.frame(A=c(1, 2, 3), B=c("a", "b", "c"))my_list <- list(my_vector, my_matrix, my_dataframe)```16. 如何在R 中使用`lapply` 对列表`my_list` 中的每个元素应用函数`mean`?答案:```Rresult <- lapply(my_list, mean)```17. 如何在R 中定义一个因子`my_factor`,包含水果的三个水平:"Apple"、"Orange" 和"Banana"?答案:```Rmy_factor <- factor(c("Apple", "Orange", "Banana"))18. 如何使用`ifelse` 函数将向量`vec` 中小于`3` 的元素替换为`0`,大于等于`3` 的元素替换为`1`?答案:```Rvec <- ifelse(vec < 3, 0, 1)```19. 如何在R 中定义一个简单的for 循环,打印从`1` 到`5` 的数字?答案:```Rfor (i in 1:5) {print(i)}```20. 如何在R 中使用`apply` 函数计算矩阵`mat` 的每一行的和?答案:```Rrow_sums <- apply(mat, 1, sum)```这些题目覆盖了R 语言中的一些基础概念,包括向量、矩阵、数据框、函数、数据可视化、包的使用等。
- 1、下载文档前请自行甄别文档内容的完整性,平台不提供额外的编辑、内容补充、找答案等附加服务。
- 2、"仅部分预览"的文档,不可在线预览部分如存在完整性等问题,可反馈申请退款(可完整预览的文档不适用该条件!)。
- 3、如文档侵犯您的权益,请联系客服反馈,我们会尽快为您处理(人工客服工作时间:9:00-18:30)。
rep(0:4,rep(5,5))
15用函数rep()构造一个向量x,它由3个3,4个2,5个1构成
x=c(rep(3,3),rep(2,4),rep(1,5))
统计软件实验2
附录:数据:
1身高体重数据
weight height
4.17 1.75
5.58 1.8
5.18 1.65
6.11 1.9
4.5 1.74
4.61 1.91
5.17 1.75
4.53 1.8
5.33 1.65
5.14 1.9
4.81 1.74
17 1.91
4.41 1.75
3.59 1.8
5.87 1.65
set.seed(123)
norm <- rnorm(100,1,1)
min.norm <- 100
for(i in 1:100){
if(norm[i]<=min.norm){
min.norm=norm[i]
min.count=i
}
}
cat(min.norm,min.count)
6找出100次产生的长度为100、mean=1,sd=1的正态分布随机向量的最小值与出现位置的关系。(用plot(min.count,min.norm)表示,其中min.count为位置向量,min.norm为最小值向量)
factor.numeric
8创建一个2到50的向量,形式为2, 4, 6, 8, ..., 48, 50并名为为vector1
vector1 <- seq(from=2,to=50,by=2)
9选取vector1中的第20个元素
vector1[20]
10选取vector1中的第10,15,20个元素
Mtcars
Mtcars$vs<-学号后两位
mtcarsnew<-read.csv()
8把mtcars转换成矩阵mm并判断数据类型;把第六行改成你的“学号后两位”;取矩阵mm前11行存入变量mtcars11;取mtcars11的主对角线的元素,构成主对角阵mt;取mtcars11的上三角阵存入mtupper;(需要通过网络搜索学习上三角矩阵定义)
vector1[c(10,15,20)]
11选取vector1中的第10到20个元素
vector[10:20]
12选取vector1中值大于40的元素
vector1[vector1>40]
13创建向量1 2 3 4 5 1 2 3 4 5 1 2 3 4 5 1 2 3 4 5 1 2 3 4 5
rep(1:5,5)
5.根据cityrain数据作图。令Y轴范围(0,300),xaxt="n",type="b",颜色为黑,X轴标题为“Month”,Y轴标题为“TokyoRainfall(mm)”,主标题“Monthly Rainfall in major cities”。用axis()函数添加X轴,使在X轴1到12的位置分别对应12个月份。
for(i in 1:100){
norm <- rnorm(100,1,1)
min.norm[i] <- 100
for(i in 1:100){
if(norm[i]<=min.norm[i]){
min.norm[i]=norm[i]
min.count[i]=i
}
}
}
plot(min.count,min.norm)
sum <- 0
for(i in 1:100){
if(i%%3==0|i%%5==0){
print(i)
sum <- sum+i
}
}
print(sum)
5定义一个长度为100、mean=1,sd=1的正态分布随机向量,并找出该向量的最小值及其出现的位置。rnorm(n,mean,sd),种子设为123
3.83 1.9
6.03 1.74
4.89 1.91
4.32 1.75
4.69 1.8
统计软件实验3
1数据的读取(数据见附录)
data<-read.table("路径/t.data.txt",header=T)
2绘图
plot(height, weight)#绘图
3更改绘图的参数的取值
例如:plot(height, weight, pch=2)#更改后的绘图
7
Calculate the first 50 powers of 2, 2*2, 2*2*2, etc.
Calculate the squares of the integer numbers from 1 to 50.
Which pairs are equal, i.e. which integer numbers fulfill the condition .
print(I)
2
while (i<=100) {
sum <- sum+i
i <- i+1
}
print(sum)
3
repeat{
if(i%%2!=0)sum <- sum+i
i <- i+1
if(i>100)break
}
print(sum)
2使用while循环求1+2+3+…+100的和。
i <- 1
How many pairs are there?(Use R to solve all these questions!)
(思考使用循环和不使用循环两种方式解答)
sum=0
for(i in 1:100)
if(2^i==i^2){
sum=sum+1
print(i)
}
cat("sum=",sum)
n=c(1:50)
colnames(mtupper)<-NULL
rownames(mtupper)<-NULL
colnames(mtupper)<-NULL
rownames(mtupper)<-NULL
colnames(mtupper)<-NULL
10.mtupper每一行求和,存入mtsum。
mtsum<-apply(mtupper,MARGIN=1,FUN=sum)
4.53 1.8
5.33 1.65
5.14 1.9
4.81 1.74
4.17 1.91
4.41 1.75
3.59 1.8
5.87 1.65
3.83 1.9
6.03 1.74
4.89 1.91
4.32 1.75
4.69 1.8
统计软件实验4
1使用三种循环,输出向量1:100中所有数据。
1
for (I in 1:100)
axis(1,at=1:12,labels = rain$Month)
4.在[0,4pi]画sin(x),cos(x)(在同一个图象中); 其中sin(x)和cos(x)图象用不同的颜色和形状表示,并在函数图上适当的位置标注“箭头+y=sin(x)”,“箭头+y=cos(x)”,标记x轴,y轴,标题为“正弦余弦函数图象”.
mm<-as.matrix(mtcars);class(mm)
mm[6,]<-学号后两位
mtcars11(mtcars11<-head(mtcars,11))
mt(mt<-diag(diag(mtcars11)))
mtupper(x[lower.tri(x)]<-0;mtupper<-x)
x[lower.tri(x)]<-0
plot(sin,0,4*pi,main="正弦余弦函数图像",xlab="x轴",ylab="y轴",col="red",type="b",pch=18)
curve(cos,0,4*pi,col="blue",type="b",pch=1,add=T)
arrows(3.3,0.8,2.3,0.8)
a=2^n
b=n^2
x=a-b
n[x==0]
sum(x==0)
n=c(1:50)
a=2^n
b=n^2
x=a-b
n[!((x>0)|(x<0))]
sum(!((x>0)|(x<0)))
x<- read.table("x.txt",header=T);x
class(x);x <- as.numeric(x$x);x
7查看mtcars数据(mtcars回车);把vs变量所在列的元素全都改成你的“学号后两位”(mtcars$vs<-7);把mtcars存为mtcars.csv文件;读入mtcars.csv文件存入mtcarsnew;
text(3.8,0.8,"sin(x)")
arrows(10.8,0.8,11.8,0.8)
text(10,0.8,"cos(x)")
例如:
附录:数据:
1身高体重数据
weight height
4.17 1.75
5.58 1.8
5.18 1.65
6.11 1.9
4.5 1.74