Monte Carlo simulations and measurements
蒙特卡罗法
蒙特卡罗法简单介绍和案例蒙特卡罗法历史悠久。
1773年法国G.-L.L.von 布丰曾通过随机投针试验来确定圆周率π的近似值,这就是应用这个方法的最早例子。
蒙特卡罗是摩纳哥著名赌城,1945年 J.von 诺伊曼等人用它来命名此法,沿用至今。
数字计算机的发展为大规模的随机试验提供了有效工具,遂使蒙特卡罗法得到广泛应用。
在连续系统和离散事件系统的仿真中,通常构造一个和系统特性相近似的概率模型,并对它进行随机试验,因此蒙特卡罗法也是系统仿真方法之一。
对于蒙特卡罗技术应用于不可预见费的估算的研究,是对蒙特卡罗技术应用的拓展,能更好地了解尝试其在项目管理方面更多的应用,用其解决项目管理的问题。
用蒙特卡罗技术研究不可预见费,尝试用蒙特卡罗解决一般项目的不可预见费求取问题,避免不可预见费过高过低的问题。
蒙特卡洛方法的基本思想是:将符合一定概率分布的大量随机数作为参数带入数学模型,求出所关注变量的概率分布,从而了解不同参数对目标变量的综合影响以及目标变量最终结果的统计特性。
蒙特卡洛方法的基本原理简单描述如下:假定函数),...,,(21nx x x f y =,蒙特卡洛方法利用一个随机数发生器通过抽样取出每一组随机变量 (ni i i x x x ,...,,21),然后按),...,,(21n x x x f y =的关系式确定函数的值),...,,(21ni i i i x x x f y =。
反复独立抽样(模拟)多次(i=1,2,…),便可得到函数的一组抽样数据(n y y y ,...,,21),当模拟次数足够多时,便可给出与实际情况相近的函数y 的概率分布与其数字特征。
蒙特卡罗法(Monte Carlo Simulation )也称随机模拟,它主要依据概率分布对随机变量进行抽样,然后将样本带入数学模型进行计算得到应变量。
虽然蒙特卡罗模拟技术只给出的是统计估计而非精确的结果且应用其研究问题需要花费大量的计算时间,但它对问题的维数不敏感,对求解对象是线性问题与否也没有原则性要求,因此在复杂系统的不确定分析中,蒙特卡罗方法成为不可或缺的手段。
Monte Carlo数值模拟法
Monte Carlo 数值模拟法
Monte Carlo 方法亦称为随机模拟(Random simulation )方法,有时也称作随机抽样技术或统计试验方法。
基本思想是,为了求解数学、物理以及工程技术等方面的问题,首先建立一个概率模型或抽样试验来计算所求参数的统计特征,最后求出所求解的近似值,而解的精确度可以用估计值的标准差来表示。
Monte Carlo 随机模拟法被认为具有较为广泛的适用性,可以解决与随机变量有关的大量工程实际问题,在随机参数转子系统动力学响应问题分析方法中占有主导地位,其分析结果往往用来作为验证其它分析方法正确性重要指标。
Monte Carlo 随机模拟法通用性强,但是,其样本独立性问题与随机收敛性问题一直没有得到较好的解决,同时,计算工作量大,工作效率低。
若已知随机参数变量的概率分布,根据随机转子系统的特征值方程[9]可以方便地利用蒙塔卡罗随机模拟法来研究动力响应等的统计特性。
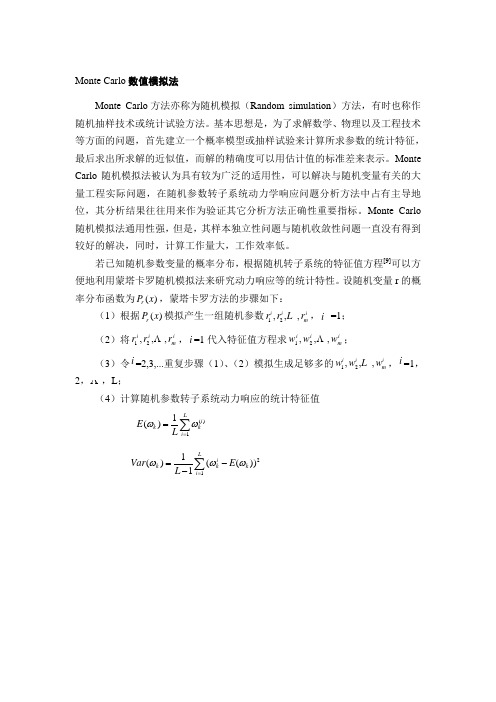
设随机变量r 的概率分布函数为()r P x ,蒙塔卡罗方法的步骤如下:
(1)根据()r P x 模拟产生一组随机参数12,,,i i i m r r r ,i =1;
(2)将i m i i r r r ,,,21 ,i =1代入特征值方程求i
m i i w w w ,,,21 ;
(3)令i =2,3,...重复步骤(1)、(2)模拟生成足够多的12,,,i i i m w w w ,i =1,2, ,L ;
(4)计算随机参数转子系统动力响应的统计特征值
()11()L i k k i E L ωω==∑
211()(())1L i k k k i Var E L ωωω==--∑。
关于montecarlo分析[转载]--sucrasBlog
![关于montecarlo分析[转载]--sucrasBlog](https://img.taocdn.com/s3/m/b4b615082bf90242a8956bec0975f46527d3a78f.png)
关于montecarlo分析[转载]--sucrasBlog关于monte carlo分析[转载]发表于 2007/5/19 13:58:04了解这些泊来的东西可以从它的名字说起,为什么叫Mente Carlo Analysis?Mente Carlo原来是欧洲的一个著名的赌城,所以Mente Carlo Analysis分析的意思大致就是说每次随机指定不同的参数组合,看电路performance的分布情况。
Mente Carlo分析中一次模拟的情形大致是这样的:电路有这么几个工艺参数,A的分布为a,B的分布为b,...先随机选择参数A的值,我掷一颗骰子,喔,掷到0.3了,好,这次A就用0.3,然后是B,再掷一次骰子,哦,0.2...OK!直到全部工艺参数都确定下来,然后照此仿真,得到一个仿真结果I。
重复以上过程,可以得到不同参数组合下的仿真结果II,III。
从而得到仿真结果的分布。
在各工艺参数独立分布的情况下,以上分析还是合理的。
从我个人有限的工作经历来说,不要说Mente Carlo Analysis,就是一般的Corner分析我也很少去做,因为个人认为只要设计时给各方面留下足够的裕量,Corner分析不管做不做都不会出现什么大的纰漏,起码对一般精度要求不高的电路而言。
3年前曾经有一位同事也算老师,关于要不要做corner分析或Mente Carlo分析,怎样做,他讲了他的一些经历。
此人在工研员读的硕士,以后又到可能是纽约大学还是伯克力哪处分校念的博士,以后又在超微(AMD)做flash memory,也有在国半(NS)工作的经历。
交待这些背景很有必要,因为这或许代表了一个在大公司工作十几年的老engineer考虑问题的态度方法。
就我现在还能记起来的说一说要不要做Monte Carlo分析?我在AMD做了10年,针对工艺的分析基本上都只要做corner分析,做4个corner,也就是ff、fs、sf、ss,tt就不算了。
蒙特卡罗方法 (Monte Carlo simulation)教材

2019/4/15
Monte Carlo模拟
9
2.Monte Carlo方法简史
Stanislaw Ulam (1909-1984)
S. Ulam is credited as the inventor of Monte Carlo method in 1940s, which solves mathematical problems using statistical sampling.
1
Monte Carlo模拟
第一章 引言 (Introduction)
1. 2. 3. 4. Monte Monte Monte Monte Carlo方法 Carlo方法简史 Carlo模拟的应用 Carlo算法的主要组成部分
2019/4/15
Monte Carlo模拟
2
1.Monte Carlo方法
2019/4/15
Monte Carlo模拟
5
2.Monte Carlo方法简史 Buffon投针实验
1768年,法国数学家Comte de Buffon利用投针实验估 计的值
L
d
p
2019/4/15
d
2L
Monte Carlo模拟
6
2.Monte Carlo方法简史
Problem of Buffon’s needle: If a needle of length l is dropped at random on the middle of a horizontal surface ruled with parallel lines a distance d > l apart, what is the probability that the needle will cross one of the lines?
蒙特卡罗方法 (Monte Carlo simulation)
[0, )
• The random vector is uniformly distributed on the region [0,d)×[0,). Accordingly, it has probability density function 1/d. • The probability that the needle will cross one of the lines is given by the integral
2014-8-27
Monte Carlo模拟
18
4.Monte Carlo算法的主要组成部分
Monte Carlo算法的主要组成部分 概率密度函数(pdf) 必须给出描述一个物理系统的一组概率密度函数;
随机数产生器 能够产生在区间[0,1]上均匀分布的随机数 抽样规则 如何从在区间[0,1]上均匀分布的随机数出发,随机抽 取服从给定的pdf的随机变量;
p
2014-8-27
0
l sin
0
1 d
2l dAd d
Monte Carlo模拟 8
2.Monte Carlo方法简史 Enrico Fermi
• 1930年,利用Monte Carlo方法研究中子的扩散 • 并设计了一个Monte Carlo机械装置,Fermiac,用于计算核 反应堆的临界状态
2014-8-27
Monte Carlo模拟
12
Monte Carlo模拟
第一章 引言 (Introduction)
1. 2. 3. 4. Monte Monte Monte Monte Carlo方法 Carlo方法简史 Carlo模拟的应用 Carlo算法的主要组成部分
蒙特卡洛模拟
蒙特卡洛模拟风险分析是我们制定的每个决策的一部分。
我们一直面对着不确定,不明确和变异。
甚至我们无法获得信息,我们不能准确的预测未来。
蒙特卡洛模拟( Monte Carlo simulation)让您看到了您决策的所有可能的输出,并评估风险,允许在不确定的情况下制定更好的决策。
什么是蒙特卡洛模拟( Monte Carlo simulation)蒙特卡洛模拟( Monte Carlo simulation)是一种计算机数学技术,允许人们在定量分析和决策制定过程中量化风险。
这项技术被专家们用于各种不同的领域,比如财经,项目管理,能源,生产,工程,研究和开发,保险,石油&天然气,物流和环境。
蒙特卡洛模拟( Monte Carlo simulation)提供给了决策制定者大范围的可能输出和任意行动选择将会发生的概率。
它显示了极端的可能性-最的输出,最保守的输出-以及对于中间路线决策的最可能的结果。
这项技术首先被从事原子弹工作的科学家使用;它被命名为蒙特卡洛,摩纳哥有名的娱乐旅游胜地。
它是在二战的时候被传入的,蒙特卡洛模拟( Monte Carlo simulation)现在已经被用于建模各种物理和概念系统。
蒙特卡洛模拟( Monte Carlo simulation)是如何工作的蒙特卡洛模拟( Monte Carlo simulation)通过构建可能结果的模型-通过替换任意存在固有不确定性的因子的一定范围的值(概率分布)-来执行风险分析。
它一次又一次的计算结果,每次使用一个从概率分布获得的不同随机数集。
根据不确定数和为他们制定的范围,蒙特卡洛模拟( Monte Carlo simulation)能够在它完成计算前调用成千上万次的重复计算。
蒙特卡洛模拟( Monte Carlo simulation)产生可能结果输出值的分布。
通过使用概率分布,变量能够拥有不同结果发生的不同概率。
概率分布是一种用来描述风险分析的变量中的不确定性的更加可行的方法。
Monte-Carlo模拟

曼哈顿计划 Buffon投针实验 大数定律
基本思想:当所求问题是某种随机事件出现的 概率,或者是某个随机变量的期望值时,通过 某种“试验”的方法,以这种事件出现的频率 估计该随机事件的概率,或者得到这个随机变 量的某些数字特征,并将其作为问题的解。
3) 建立各种估计量:一般说来,构造了 概率模型并能从中抽样(即实现模拟实 验)后,我们就要确定一个随机变量, 作为所求的问题的解。即针对模拟实验 的结果考察其统计特性(样本均值、方 差、置信区间等),建立各种估计量, 从中得到问题的解。
明确问题,建立模型收集和整理数据资料 编制程序,模拟运行分析模拟输出结果
逆变换法的具体步骤:
•确定随机变量X的概率分布函数F(x);
例:指数分布的Biblioteka 布函数为:1 e x , x 0, F ( x) x 0. 0,
F ( x) 1 e , x 0
解得
可取
1 x ln(1 ), 1 x ln .
模拟的优点:简单、快速、适应性强
能相对容易地近似很复杂的随机系统,问题 的几何形状的复杂性对其影响不大;
可以在广泛的条件下估计候选方案的性能; 建模者可以在不同层次的水平上进行控制;
模拟的缺点: 建立和运行模拟模型可能相当昂贵; 模拟模型的随机性使得结论受到限制
2、随机数和随机变量的生成 2.1 均匀分布随机数的生成
n=input('输入模拟次数:'); count=0; for i=1:n, rt1=rand; %模拟随机变量t1(火车从A站出发的时刻) if rt1<0.7 T1=0; elseif rt1>=0.7 & rt1<0.9 T1=5; else T1=10; end T2=30+randn*2; %模拟随机变量t2(火车的运行时间) %模拟随机变量t3(他到达B站的时刻) rt3=rand; if rt3<0.3 T3=28; elseif rt3>=0.3 & rt3<0.7 T3=30; elseif rt3>=0.7 & rt3<0.9 T3=32; else T3=34; end if T3 < T1 + T2, count=count+1; end end%for prob=count/n
蒙特卡罗(Monte Carlo)方法简介
蒙特卡罗(Monte Carlo)方法简介蒙特卡罗(Monte Carlo)方法简介蒙特卡罗(Monte Carlo)方法,也称为计算机随机模拟方法,是一种基于"随机数"的计算方法。
一起源这一方法源于美国在第二次世界大战进研制原子弹的"曼哈顿计划"。
Monte Carlo方法创始人主要是这四位:Stanislaw Marcin Ulam, Enrico Fermi, John von Neumann(学计算机的肯定都认识这个牛人吧)和Nicholas Metropolis。
Stanislaw Marcin Ulam是波兰裔美籍数学家,早年是研究拓扑的,后因参与曼哈顿工程,兴趣遂转向应用数学,他首先提出用Monte Carlo方法解决计算数学中的一些问题,然后又将其应用到解决链式反应的理论中去,可以说是MC方法的奠基人;Enrico Fermi是个物理大牛,理论和实验同时都是大牛,这在物理界很少见,在“物理大牛的八卦”那篇文章里提到这个人很多次,对于这么牛的人只能是英年早逝了(别说我嘴损啊,上帝都嫉妒!);John von Neumann可以说是计算机界的牛顿吧,太牛了,结果和Fermi一样,被上帝嫉妒了;Nicholas Metropolis,希腊裔美籍数学家,物理学家,计算机科学家,这个人对Monte Carlo方法做的贡献相当大,正式由于他提出的一种什么算法(名字忘了),才使得Monte Carlo方法能够得到如此广泛的应用,这人现在还活着,与前几位牛人不同,Metropolis很专一,他一生主要的贡献就是Monte Carlo方法。
蒙特卡罗方法的名字来源于摩纳哥的一个城市蒙地卡罗,该城市以赌博业闻名,而蒙特•罗方法正是以概率为基础的方法。
与它对应的是确定性算法。
二解决问题的基本思路Monte Carlo方法的基本思想很早以前就被人们所发现和利用。
早在17世纪,人们就知道用事件发生的"频率"来决定事件的"概率"。
- 1、下载文档前请自行甄别文档内容的完整性,平台不提供额外的编辑、内容补充、找答案等附加服务。
- 2、"仅部分预览"的文档,不可在线预览部分如存在完整性等问题,可反馈申请退款(可完整预览的文档不适用该条件!)。
- 3、如文档侵犯您的权益,请联系客服反馈,我们会尽快为您处理(人工客服工作时间:9:00-18:30)。
Dose rate determinations in the Portuguese GammaIrradiation Facility:Monte Carlo simulations andmeasurementsC.Oliveira*,J.Salgado,A.Ferro de CarvalhoNuclear and Technological Institute,Est.Nac.10,2685±953,SacaveÂm,PortugalReceived22October1998;accepted30September1999AbstractA simulation study of the Portuguese Gamma Irradiation Facility,UTR,has been carried out using the MCNP code.The work focused on the optimisation of the dose distribution inside the irradiation cell,dose calculations inside irradiated samples and dose calculations in critical points for protection purposes.Calculations were carried out at points inside and outside the irradiation cell,where di erent behaviour was expected(distance from the source,radiation absorption and scattering in irradiator structure and walls).The contributions from source,irradiator structure,sample material,carriers,walls,ceiling and¯oor to the photon spectra and air kerma at those points are reported and discussed.Air kerma measurements were also carried out using an ionisation chamber.Good agreement was found between experimental and calculated air kermas.#2000Elsevier Science Ltd.All rights reserved.Keywords:Dosimetry;Air kerma;Monte Carlo;Irradiation facility;Co-60(cobalt-60)1.IntroductionIndustrial60Co irradiation facilities are widely used for irradiation purposes.Suitable dosimetry procedures must be carried out in order to establish plant oper-ational parameters,such as dose uniformity,source utilisation e ciency and maximum and minimum dose positions.A detailed dose mapping of the irradiation cell can be performed using calculations,which reduces signi®cantly the monitoring with dosimeters.Di erent mathematical methods for dose predictions have been developed(Herring and Saylor,1993).One of them is based on the point kernel approach(Mosse et al.,1988;Shultis and Faw,1996;Pina-Villalpando and Sloan,1998);another uses the Monte Carlo method.The most used Monte Carlo codes are the EGS4(Nelson and Rogers,1988;McIntyre et al., 1990;Raisali and Sohrabpour,1993),the ITS (Halbleib,1988;Weiss et al.,1997)and the MCNP (Briesmeister,1997;Oliveira et al.,1999).Saylor and Jordan(1999)are developing a software package, which provides the end-user with a robust geometry input and output platform from which various forms of point kernel and Monte Carlo algorithms can be launched.The accuracy of the Monte Carlo method depends on the physical interactions considered,the cross sec-tion library and the correctness of the incorporation of the source,geometry,composition,dimensions andRadiation Physics and Chemistry58(2000)279±2850969-806X/00/$-see front matter#2000Elsevier Science Ltd.All rights reserved.PII:S0969-806X(99)00462-/locate/radphyschem*Corresponding author.Tel:+351-1-9550021;fax:+351-1-9941525.E-mail address:coli@itn1.itn.pt(C.Oliveira).density of the irradiated material.However,themethod is computer time intensive.The use of some variance reduction techniques can enhance the e -ciency of the calculations,although its use can intro-duce some errors.Validation measurements must be performed to check the suitability of the model for the speci®c application.Several points were chosen inside and outside the ir-radiation cell,where di erent behaviour in ¯ux and dose distributions was expected (distance from the source,radiation absorption and scattering in irradia-tor structure and walls).The calculations using the MCNP-4B2code (Briesmeister,1997)provide the con-tributions from the source,irradiator structure,sample material,carriers,walls,ceiling,¯oor and air to the photon spectra and air kerma 1at those points.Air kerma measurements were also carried out using an ionisation parison between exper-imental and calculated air kerma revealed good agree-ment.2.The irradiation plantThe Portuguese g -irradiation facility is designed mainly for sterilisation of medical devices and other products (Cavaco et al.,1991;Botelho et al.,1993).The irradiator is a rectangular chamber (8Â3.9m)with high-density concrete walls (1.8±2m thick).Thesource rack has an area of 0.9Â0.9m,and contains thirty stainless steel tubes.One hundred and ®fty six 60Co sources,doubly encapsulated in welded stainless steel (81mm long Â11mm diameter)were loaded into the source rack so that two tubes in the middle of the rack contain eight 60Co sources each while seven tubes to the left and right of the middle ones contain ten cobalt sources each.The source area is 0.421m 2(height=0.81m and width=0.52m).When not in use the sources are stored in dry storage.The actual ac-tivity (Feb/98)is (3.4210%)Â1015Bq.The product to be irradiated is transported by forty carriers sus-pended from a monorail conveyor.Each carrier can be loaded with four product boxes,each of size 0.4Â0.4Â0.4m and a maximum weight of 120kg.The ir-radiation of the boxes is carried out in two rows on each side of the source plaque.There are seven ir-radiation positions (i.e.7carriers)in each row.An ir-radiation cycle corresponds to twenty-eight irradiation positions.Fig.1presents a schematic view of the ir-radiation cell,showing the source rack and the associ-ated iron structure (12mm thick),which supports the mechanisms for moving the rack,as well as the pos-ition of several points where simulations and exper-imental measurements were carried out.The input of the code includes a complete description of the source rack (each Co source is individually modelled),the iron structure,the carriers loaded with boxes and the concrete walls.The measurements were carried out using ``dummy''boxes loaded with layers of folded and crumpled newspapers,with a density of 0.11215%g cm À3.This relatively large error is due to the bad reproducibility of the box ®lling process.The points are located on a plane 100cm above the ¯oor.3.Simulation resultsThe platform used for the MCNP code was an Alpha Personal Workstation running Digital Unix with 64Mbytes RAM and a 433MHz CPU.The code simulated the transport of photons and electrons.The detailed physics treatment for photon interactions was used (photoelectric e ect,Compton e ect,pair pro-duction).It accounts also for ¯uorescence photon emission after photoelectric absorption.The generation of electrons from photons is considered as well.The model generates electrons that are banked for later transport.The electron interactions include the pro-duction of bremsstrahlung photons and electron-induced ¯uorescent X-rays.Once the cut-o energy is reached (50keV),the electrons deposit their energy locally.Some variance-reducing techniques,such as geome-try splitting with Russian roulette and the pointdetec-Fig.1.Schematic representation of the irradiationcell.ÓÉ Foxit Readei ±à¼-°æȨËùÓÐ(C) Foxit Èí¼þ¹«Ë¾,2005-2006½öÊʺÏÆÀ¹ÀʹÓá£tor estimator,have been used to reduce the computertime required to obtain results with statistical standard deviation less than 5%,and the variance of variance less than 10%.The other statistical checks for the esti-mated results included in the code were also satis®ed.The point detector is a deterministic estimate;contri-butions to the point detector are made at source and collision events throughout the random walk.As is suggested in the MCNP manual,the radius of the sphere of exclusion in air (region with very few col-lisions)was set to zero.The number of histories per minute was dependent on the number and position of the detectors used in each run,and on the cell import-ance;it ranged between 500and 2500histories/min.The total number of histories per run necessary to satisfy the statistical checks lay between 15000and 50000.Fig.2shows gamma spectra for points P2,P3,P4and P8.These points,due to their localisation relative to the source,are extreme cases.Spectrum P4clearly reveals the presence of 60Co peaks;33%of the pho-tons have arrived directly from the source.In spectrum P2,the 60Co peaks are strongly reduced.The photons emitted by the source in the direction of this point are mostly absorbed or scattered by the iron structure.Photons that reach point P8,in the corridor,su ered multiple scattering in the walls.The low-energy com-ponents in the 60Co spectra may have important e ects in the absorbed dose enhancement in a material (ASTM,E 1249-93,1998;ASTM,E 1250-88,1998).The material where the photons had the last inter-action before reaching a given detector is depicted in Table 1.Points P4and P6are symmetrical relative to the source plane.The contributions from di erentori-Fig.2.Photon spectra in air at P2,P3,P4and P8.Table 1Percentage of photons having last interactions in materials shown before reaching points P1to P8P1P2P3P4P5P6P7P8Co sources2531933233226±Irradiator structure 6336472±Samples 14151522172217±Carriers 691011111215±Walls 2645341730202276Ceiling 453±2138Floor 10121158596Air 23312±29Others75253141C.Oliveira et al./Radiation Physics and Chemistry 58(2000)279±285281ÓÉ Foxit Readei ±à¼-°æȨËùÓÐ(C) Foxit Èí¼þ¹«Ë¾,2005-2006½öÊʺÏÆÀ¹ÀʹÓá£gins are similar.A more detailed analysis shows the contributions for point P8of the scattered photons in walls:39%su er the last scattering in wall D,32%in wall E,3%in wall F and 2%in wall A.In order to compare the ionisation chamber measurements with the simulated results,the MCNP code directly converts the ¯ux estimates to air kerma rates by using the photon energy ¯ux and the mass energy absorption coe cients (Whalen et al.,1991;Higgins et al.,1992).Fig.3shows the air kerma rate per energy interval in the same points as a function of the photon energy.Fifty eight percent of the air kerma rate of P4originates from photons coming directly from the source,while only 14%of these photons con-tribute to the air kerma at P2.The air kerma rate distribution inside the irradiation cell is not homogeneous;the air kerma rate at P2is only about 20%of that at P4.Air kerma rate calcu-lations were also performed in a square grid of nine points,5cm apart,around each simulated point.Fig.4shows the air kerma rates around point P6.The error bars are the absolute statistical errors.In each line parallel to the source plane,the air kerma rateisFig.3.Air kerma rate per interval of energy at P2,P3,P4andP8.Fig.4.Air kerma rate distribution around point P6as a func-tion of horizontal distance at a height of 100cm above ¯oor level.C.Oliveira et al./Radiation Physics and Chemistry 58(2000)279±285282practically constant.However the air kerma rate is a function of the distance from the source,showing a gradient of the order of 1mGy s À1cm À1.Similar results were obtained for other points.Pro®les of the air kerma rate in the vertical line pas-sing through the simulated points were also calculated.Fig.5shows,as an example,the pro®le around point P6.The error bars are the absolute statistical errors.The range of the corresponding relative errors lies between 1and 4%.The curve has a maximum at height=100cm,which corresponds to the centre plane of the source.The curve is symmetrical relative to the middle point.The air kerma rates corresponding to heights of 40and 160cm are equal.A detailed analysis of the results shows that the contribution to the pho-ton spectra of the ¯oor is 14%and 3%for heights of 40and 160cm,respectively;however,as this di erenceexists in the lower energy region of the spectra it has little e ect in air kerma calculations.A linear ®t Ðair kerma rate as a function of the distance to the source Ðwas adjusted to the simulated values in the grid around each height.The gradient of this curve,associated with the respective error,is rep-resented as a function of the height in Fig.6,for point P6.The maximum of the curve is also obtained at the middle point of the source.4.Experimental resultsExperimental measurements were performed using a 2571,0.6cm 3Farmer ionisation chamber.This chamber consists of a thin walled high purity graphite thimble and a pure aluminium electrode.Previous to the measurements,the response of the ionisation chamber with build-up cap on and o was investi-gated.The results showed that the cap is indispensable for air kerma measurements in high-energy photons from 60Co,while the presence of the cap did not dis-turb measurements in 100keV photons.The air kerma calibration of the ionisation chamber was then carried out in a Standards Laboratory in photon beams of 100keV (X-ray),662keV (137Cs)and 1250keV (60Co).Calibration factors were calculated with an overall uncertainty of 2%.Fig.7shows the chamber response relative to energy.It can be seen that the response of the ionis-ation chamber with build-up cap on is practically inde-pendent of photon energy in the range from 100to 1250keV.parison of simulated and experimental resultsIn order to validate the applied model,some measurements have been carried out at points with di erent photon spectra and air kermarates.Fig.6.Variation of the gradient of the air kerma rate around point P6as a function of height above ¯oorlevel.Fig.5.Air kerma rate pro®le around point P6as a function of height above ¯oorlevel.Fig.7.Relative response of the NE 2571ionisation chamber at three photon energies.C.Oliveira et al./Radiation Physics and Chemistry 58(2000)279±285283Fig.8shows a comparison between the calculated and the experimental results.The straight-line y=x is also shown.The di erences are always smaller than 12%.Taking into account that the source intensity and the density of the dummy boxes have estimated accuracies of 10%and 15%,respectively,these results show good agreement.The mean value of the ratio ``Calculated values/Experimental values ''is 0.968,and its correlation coe cient is r=0.998.Such satisfactory agreement con®rms that the simu-lation can be used to predict the dose distribution in the irradiation cell.6.ConclusionsThe work focused on air kerma calculations and measurements at several points in the Portuguese Gamma Irradiation Facility.The relative contributions to the photon spectra and air kermas from the source,irradiator structure,sample material,carriers,walls,ceiling,¯oor and air depend on the point considered.Most photons have one or more scattering events before reaching a given detector.The maximum air kerma rate is obtained at the centre height of the source.The satisfactory agreement between calculations and measurements con®rms that the simulation model can contribute to the dose mapping data inside the ir-radiation cell,and thus to optimising the irradiation process.The simulation can also be used to optimise the source reloading process,in order to attain a better dose distribution.ReferencesASTM E 1249-93,1998.Standard practice for minimising do-simetry errors in radiation hardness testing of silicon elec-tronic devices using Co-60sources.Annual Book ofStandards 12.02,658±672.ASTM E 1250-88,1998.Standard test method for application of ionising chambers to assess the low energy gamma com-ponent of cobalt-60irradiators used in radiation-hardness testing of silicon electronic devices.Annual Book of Standards 12.02,673±681.Botelho,M.L.,Godinho,M.C.,Partidario,M.,Andrade,M.E.,1993.Radiation sterilization of pharmaceutical-ophthalmic ointments.Radiat.Phys.Chem.42(4±6),605±609.Briesmeister,J.1997.MCNP ÐA general Monte Carlo N-Particle Transport Code,LA 1265-M,Version 4B,Los Alamos National Laboratory,Los Alamos,New Mexico,USA.Cavaco,M.C.,Almeida,J.C.,Andrade,M.E.,Kovacs,A.,1991.Dosimetry commissioning for an industrial cobalt-60gamma radiation facility.Appl.Radiat.Isot.42(12),1185±1188.Halbleib,J.,1988.Structure and operation of the ITS code system.In:Jenkins,T.M.,Nelson,W.R.,Rindi,A.(Eds.),Monte Carlo transport of electrons and photons.Plenum Press,New York,pp.249±262.Herring,C.M.,Saylor,M.C.,1993.Sterilization with radioiso-topes.In:Morrissey,R.F.,Phillips,G.B.(Eds.),Sterilization technology ÐA practical guide for manufac-turers and users of health care products.Van Nostrand Reinhold,New York,pp.196±217.Higgins,P.D.,Attix, F.H.,Hubbell,J.H.,Seltzer,S.M.,Berger,M.J.,Sibata,C.H.1992.Mass energy transfer and mass energy absorption coe cients including in ¯ight posi-tron annihilation for photon energies 1keV to 100MeV.National Institute of Standards and Technology,NISTIR 4812.McIntyre,R.,Huntzinger, C.J.,Nelson,W.R.,1990.Applications of EGS4to industrial irradiator design and use.Radiat.Phys.Chem.35(4±6),762±766.Mosse,D.C.,Laizier,J.M.,Keraron,Y.,Lallemant,T.F.,Perdriau,P.M.,1988.Experimental quali®cation of a code for optimizing gamma irradiation facilities.Radiat.Phys.Chem.31(4±6),555±562.Nelson,W.R.,Rogers,D.W.,1988.Structure and operation of the EGS4code system.In:Jenkins,T.M.,Nelson,W.R.,Rindi,A.(Eds.),Monte Carlo transport of electrons and photons.Plenum Press,New York,pp.287±305.Oliveira,C.,Salgado,J.,Botelho,M.L.,Ferreira,L.M.,1999.Dose determination by Monte Carlo Ða useful tool in gamma radiation process.In:Int.Meeting on Radiation Processing,IMRP 11,Melbourne,Australia.Pina-Villalpando,G.,Sloan,D.P.,1998.Dose distribution studies of a gamma industrial irradiator using a PC code.Radiat.Phys.Chem.52(1±6),563±567.Raisali,G.R.,Sohrabpour,M.,1993.Application of EGS4computer code for determination of gamma ray spectrum and dose rate distribution in Gammacell 220.Radiat.Phys.Chem.42(4±6),799±805.Saylor,M.C.,Jordan,T.M.,1999.Applications ofmathemat-parison of calculated and experimental air kerma rates.C.Oliveira et al./Radiation Physics and Chemistry 58(2000)279±285284ÓÉ Foxit Readei ±à¼-°æȨËùÓÐ(C) Foxit Èí¼þ¹«Ë¾,2005-2006½öÊʺÏÆÀ¹ÀʹÓá£ical modelling technologies to industrial radiation proces-sing.In:Int.Meeting on Radiation Processing,IMRP11, Melbourne,Australia.Shultis,J.K.,Faw,R.E.,1996.Radiation shieding.Prentice Hall PTR,New Jersey.Weiss,D.E.,Johnson,W.C.,Kensek,R.P.,1997.Dose distri-bution in tubing irradiated by electron beam:Monte Carlo simulation and measurement.Radiat.Phys.Chem.50(5), 475±485.Whalen,D.J.,Hollowell,D.E.,Hendricks,J.S.1991.MCNP: Photon benchmark problems,Los Alamos National Laboratory,LA-12196,UC-705.C.Oliveira et al./Radiation Physics and Chemistry58(2000)279±285285。