联合国商品贸易统计数据库使用方法Uncomtrade
联合国商品贸易统计数据库
可选择商品、报 告国家、交易国 家、年份、其他 进一步筛选查询
选择检索的 商品来源
输入文字, 进行点击 search,进 行检索
按商品检索
选择商品分类
按商品检索
在选择的商品分类 中检索出需要的商 品分类名称和编号, 勾选前面方框(可 多选),确认选择, 选中商品分类在 Selected Items中 显示,点击 Submit Query, 按照所选商品筛选 检索,也可将所选 存为自己的 favorite。
联合国商品贸易统计数据库
UN Commodity Trade Statistics Database
简介
全球最大、最权威的国际商品贸易数据型资源 由联合国统计署创建 每年超过200个国家和地区向联合国统计署提供
其官方年度商品贸易数据 涵盖全球99%的商品交易,真实反映国际商品流
动趋势 收集了超过6000种商品、约17亿个数据记录 数据最早可回溯至1962年
选择商品、报告 国家、交易国家、 年份、其他进一 步筛选查询
选择交易国家来 源,全部/用户 设置的国家或国 家群体列表
国家列表浏览, 点击Add,确 认选择
按交易国家检索
选择商品分类
Selected Items 显示选中的国家, 点击Submit Query,按照所 选报告国家筛选 检索,也可将所 选存为自己的 favorite。
选择HS分 类编码, 相应结果 显示对应 的编码号
快速检索
输入商品名称
点击“箭头”出现 下拉选择菜单,可 分别从进出口、年 限、进出口国家、 商品分类编码进行 限定
命中结果,勾选方 框,点击“View Trade Data”,一 次性查看命中的具 体数据
检索/查询
联合国统计数据库使用方法

联合国统计数据库UNDATA
UUNNDDAATTAA简简介介
由联合国统计处编制,数据来源于30个国际专业统计数据信 息源,如联合国统计司、人口司、联合国经济与社会问题研究 部、粮农组织、国际劳工局、国际货币基金组织、国际电信联 盟、经合组织、教科文组织、世界卫生组织、世界知识产权组 织、世界银行和世界旅游组织等。 涵盖的主题包括农业,犯罪,教育,就业,能源,环境,卫 生,艾滋病毒/艾滋病,人类发展,工业,信息和通信技术的范 围很广,国民经济核算 ,人口,难民,旅游,贸易,以及千年 发展目标的指标。 包含34个数据库,6千余万条统计数据。
15
联合国统计数据库UNDATA
IINNTTEERRAACCTTIIVVEE
16
联合国统计数据库UNDATA
IINN GGRRAAPPHH
17
联合国统计数据库UNDATA
BBYY RREEPPOORRTTEERR
18
联合国统计数据库UNDATA
BBYY CCOOMMMMOODDIITTYY
19
CCOOMMTTRRAADDEE
Database / Analytical tables
1. Tables published in the International Trade Statistics Yearbook 2. Monthly Bulletin of Statistics tables 3. Annual Totals Table (Country totals compared) 4. Historical data (1900-1960)
3
国际组织统计资料简介
主主要要组组织织统统计计资资料料
联合国统计司UNSD --------联合国统计数据库UN DATA / 国际货币基金组织IMF --------世界经济观察报告World Economic Outlook Reports /external/pubs/ft/weo/weorepts.htm 世界银行WB --------世界银行年度报告 World Development Sources /
联合国全球贸易数据统计库4

/db HS编码 /
出口某些国家某一年查询
/db/dq QuickQuery.aspx 高级 出口某一国连续年份查询 出口某些国家某一年查询
出口某一国连续年份查询
Hale Waihona Puke SITC国际贸易标准分类(Standard International Trade Classification, 简称:SITC)为用于国际贸易商民的统 计和对比的标准分类方法。
简介 它是一种用于国际贸易商品的统计和对比的 标准分类方法。现行“国际贸易标准分类”于 1950年7月12日由联合国经济社会理事会正式 通过,目前为世界各国政府普遍采纳的商品贸易 分类体系。 到2006年为止,该标准分类经历了 四次修改,最近的一次修改为第四次修订版,于 2006年3月获联合国统计委员会第三十七届会议 通过。该分类法将商品分为为10大类、63章、 223组、786个分组和1924个项目。
部分目录 在它的编号中第一位数字表示类、第 二位数字表示章、第三位数字表示组、 第 四位数字表示分组。如果对分组再进行细 分,五位数即表示品目,六位数字表示细 目。
联合国商品贸易统计数据库
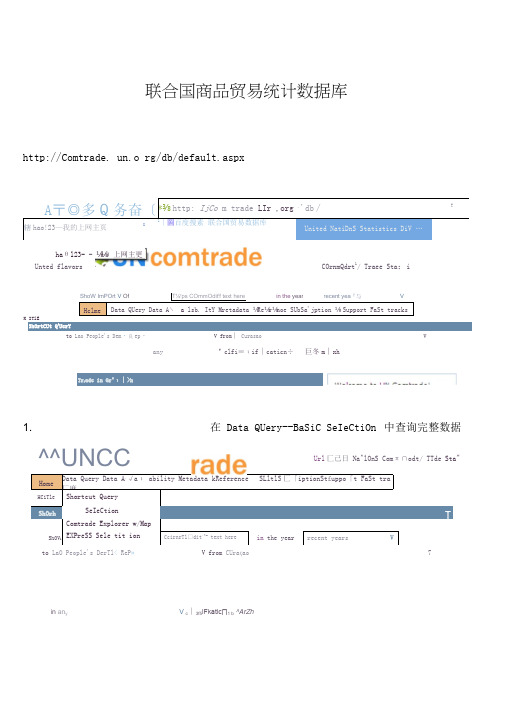
in an yV c ∣3f5iFkatic∏1 b ^ArZh联合国商品贸易统计数据库http://Comtrade. un.o rg/db/default.aspxCOrnmQdrt 1/ Traee Sta :iUnted flavorsHclmeData QUery Data A ∖ a lsb. ItY Mretadata ⅛Re ⅛r ⅛noe SUbSa'jption ⅛ Support FaSt tracksK ITlEShOrtCUt Q lUerYto Lao People's Dem ・良ep ・ V from ∣ CurasaoVanyVclfi≡ιif ∣caticn÷ 巨冬m ∣xhTr i ade in Gr^ι∣>h1. 在 Data QUery--BaSiC SeIeCtiOn 中查询完整数据A 〒◎多Q 务奋〔*⅜ http: IjCo m trade LIr ,org ,'db∕T辖hao!23—我的上网主页Xl∣圖百度搜素 联合国贸易数据库United NatiDnS Statistics DiV …haθl23- - ⅛⅛)上网主更 HomeData Query Data A ,√aι ability Metadata kReference SLltlS 匚「iptionSt£uppo「t FaSt tra匚麻HCiTleShortcut QueryShOrhSeIeCtionIComtrade Explorer w/MapShOV lEXPreSS Sele tit ionCcirnrTl□dit ,^rtext herein the year recent years VUrl 匚已日 Na^lOnS Comπ∩odt/ TTde Sta"to LaO People's DerTl < ReP » V from CUra ςao7ShoW ImPOrt V Of T⅛r ps COmmOdit l f text herein the yearrecent yea 『与 V^^UNCC2. 选择商品编码类型Hom 亡 Data Que" ■; Data Availability Metadata StRjeference SUbscrip to n&£iJMxJft FaSt t ∣,acκsI ■!匚rτ∣w > DHta OLJU r^ > 3asiu ⅝⅛⅛⅛g∏HS; reported O &2 O 96 O 02 Oθ7 OeEC⅛⅛ 1_U_ l-a>S-M ⅛ldU-l-bi - U ⅛lSteP 2. Enter Selection IteEnter COrlrImCMiitV CodesaWe SeIe ⊂ti□n ⅛ to p-≡vorites3. --------------------------------------- 选择你所要查的商品编码 —在“ Commodities ”栏中 例如,第1章的,在SearCh 上面写“ 01”,然后点SearCh ,根据你所想查的级别,选择 适当的品目或子目,选好后,点“ Add”RePOrterS PartnerS YearS OtherSCam modifiesUrIitEd MsTiOTib CarTImOdIt/ Trac⅛ StI 吕崔ardι1 □A ∣I COrrIm □diti≡5AdeIR⅛mov⅛SUbrnit QUeryGC tc COrntrad ⅛ EKPICr⅞rHS a≡ FePOrtedEXElL l CeSteP 1. Se^Mt CLa SSifKat⅞oπHS:® A≡ reported <_) 9Ξ O 96 O 02 O 07 O BE⊂SITC:O AS reported OReV,L O Rev.2 O Rev.3 O Rev,4≤u©uerv ∖GO b□ CO rπtrade EXPlQr⅛r4.选择报告国--- 在 RePGrterS栏中Step 1・ Seleet ClassificationHS:@ A≡ reported O 92 O 96 O 02 O 07SITC :O1As reported C.) Re b∕Λ O' Rev+2 O R≡v-3 ORW4COmInOditaeS RePOrterS PartIlerS YearS OUIerSChina-dd≡¾emo'∙e LIlS≡"√e ≡∈l⅞ctjon≡ to ra'.,orit∈≡GO to COrntraGe EXPlorer5.选择目标国在Partners栏中HOme My ACIZoUrlt Data QLlery Data AvaiIaDiIity Metadata StRefere仃匸亡SuDSCription ⅛ Support FaSt tra匚卜HUmE > OUmrV > - a≡ιc Ξel^ςtior ∣SITC:O AS reported O Re⅛r.l C l R r≡v.2 'O ,3 C l R,ev.4(All)z<∈ rπc,√≡Ξa∖,e rejections to ra,.critesΞu□mit QUer r r GO to COrntrade Explorer6. 选择年份——在 Years栏中HOme My A匚匚OLInt Data QUery DaLa AVailatHIjty Metaaata & Reference Subsα∩ptιc ∣n & 5umxκt FaSt b p acks HCmE > DBtN OuerV > -自勺匚 W亡巴二ti□nSteP IL・Select CIassifκ=dtk>nHS: @ A5 reported O 92 O 96 0 02 O 07 7. 选择进出口方式O EECSlT匚:O As reported O R≡v.l O Rev,2 O Rev.3 O Rev.4Ξu≡mit Qu∈r,ι.'Home M⅛, ACCOLlnt Dara QUery Data AVaiIabIlity Metaelata SLReferenCe Subscription ⅛ Support FaSt tracks HUfnE > Zt3 QlJEw > E弓自匚2w WCtIUrHS:® As reported O 92 O 56 O 02 O 07 C∕' EECSITC: O A≡ reported O ReV,1 O F⅛ev.2 O Rev,3 O Rev.4COmnladitieS RePOrte rs Partner≤ YearS OtherSEXPOrt5 figures ak∕ay≡ include R.e*exports↑ Re*exports ShCUId be OnI/ to distinguishbetv/een DomeStlC exports and Re-exportsImPort O EXPOrt □ re-Expo∣t EZ re-importGreater Tħa∩ EqUaI V-亠NonIe-J- VKee- quantity Unit d汗Ferences Unit dif⅛r⅛nc≡=GO to 匚OnItrade Ex口IOrer选择好后,提交查询“ SUbmit Query8. 输出结果StatiStics: 224 rov/s returned in 1.36 SeCOndS eQUiCk filterSeleeted classification: HS as reportedSeIeCted COmmOdities: 01*r 0101*r 0102*r 0103*r 0104*r 0105*r 0106*Seleeted reporters: UhigSeleeted years: 2010Seleeted partners: AIlSelected trade flows: ImPOrtSOrt Order Year;FlO w;R.ep;COmmJTradeVa I; y ] RefreshCirEct Cnwleo SCMX COWlOSd FYiwtJw FormStMOOifY SeIWCtiOF VieN GrSCh & hg VieW EXClS「story 忖Otem ViWW Nut4,9ilmu∣E∙C9t3-1Δ。
1烹调工艺学
1.5联合国贸易与发展会议(UNCOMTRADE)数据库1.5.1UNCOMTRADE数据库下面,我重点给大家介绍联合国贸易与发展会议的数据库,即UNcomtrade数据库。
首先这个数据库的时间较长,部分数据从1962年开始。
其次可以选择分类标准。
第三,比较容易获得双边贸易的数据。
最后,这个数据库的交互界面比较友好,对于对英文比较发憷的人来说可以比较容易地获得数据。
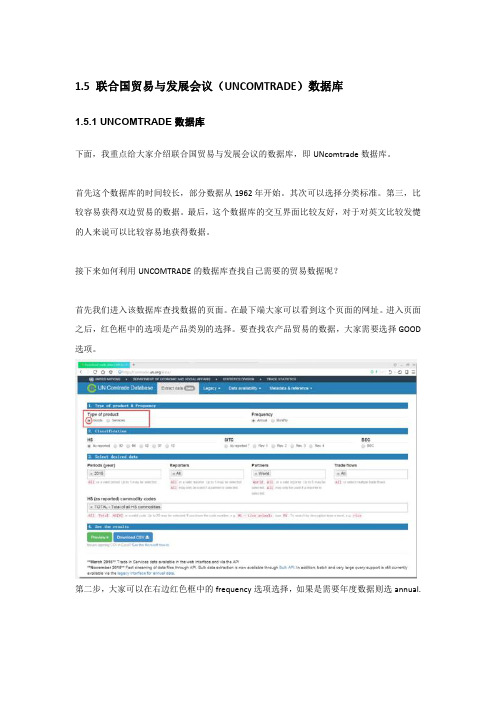
接下来如何利用UNCOMTRADE的数据库查找自己需要的贸易数据呢?首先我们进入该数据库查找数据的页面。
在最下端大家可以看到这个页面的网址。
进入页面之后,红色框中的选项是产品类别的选择。
要查找农产品贸易的数据,大家需要选择GOOD 选项。
第二步,大家可以在右边红色框中的frequency选项选择,如果是需要年度数据则选annual.第三步,在红色框的位置选择商品的分类标准。
在这里有HS分类和SITC分类,以及BEC分类可以选择。
HS分类下,还有92,96,02,07,12的选项。
这表示的是国际海关合作理事会对HS编码在这五个年份进行了修改。
SITC分类也有4个选项,分别代表的是联合国经济理事会自1950年首次发布SITC标准以来,迄今已经修改了四次,最近的分类标准是REV.4。
所以,你可以根据自己的需要在版本中进行选择。
第四步,在第三排蓝色横条的下面依次选择你需要的年份、你需要考察的国家、伙伴国、贸易流向即进口还是出口。
第五步,在红色框里选择你需要的产品编码或输入产品的名字。
最后一步就是下载你的数据啦!1.5.2BEC分类标准下面我们对该数据库中所提到的分类标准BEC给大家做个说明。
BEC分类标准的英文全称是Classification by Broad Economic Categories。
它是联合国贸易与发展会议于196年第13次会议提出的。
该标准基于SITC分类标准基础之上,包含服务在内的所有商品,比SITC分类标准更为简洁。
联合国商品贸易统计数据库数据搜集

一、国际贸易总量数据的搜集——Canada
5
精选ppt
一、国际贸易总量数据的搜集——Canada
6精选pptFra bibliotek区域内:Mexico,USA 区域外核心国家:China、Germany 整体:World
一、国际贸易总量数据的搜集——Canada
7
精选ppt
1999-2010
一、国际贸易总量数据的搜集——Canada
8
精选ppt
一、国际贸易总量数据的搜集——Canada
9
精选ppt
一、国际贸易总量数据的搜集——Canada
10
精选ppt
二、国际贸易产品数据的搜集——据BEC分类
11
精选ppt
二、国际贸易产品数据的搜集——据BEC分类
12
精选ppt
二、国际贸易产品数据的搜集——据BEC分类
13
精选ppt
二、国际贸易产品数据的搜集——据BEC分类
18
精选ppt
二、国际贸易产品数据的搜集——据BEC分类
14
精选ppt
仅出口
二、国际贸易产品数据的搜集——据BEC分类
15
精选ppt
二、国际贸易产品数据的搜集——据BEC分类
16
精选ppt
区域内:Mexico,USA 整体:World
二、国际贸易产品数据的搜集——据BEC分类
17
精选ppt
2000 2005 2010 各年分别搜索
国际分工格局数据搜集方法
——联合国商品贸易统计数据库
1
精选ppt
【数据库】
➢ 联合国商品贸易统计数据库:UNCOMTRADE /db/dqBasicQuery.aspx
联合国数据库操作介绍

1.1. Data Query & ExtractionSeveral functions provide the User with commodity-related results once selection parameters (commodity, country, year…) are set. The data query functions are activated through the links below:Figure 1: Data Query & Extraction links1.1.1. Quick SearchAlthough not in the Data Query & Extraction group, the Quick Search processor makes it possible to retrieve data according to pre-defined reporter countries that can be selected from a list:Figure 2: Quick Search entries for first letter FA subset of the Quick Search list is displayed as soon as a letter is typed. Extra letters refine the selection, like in the example below:Figure 3: two-letter selection from the Quick Search listTo filter the selectionSelection summaryField displays its caption when pointed to by the mouseProcessor nameOn-line HelpNotes:1. The Query Processor name, Comtrade Explorer, appears at the top left of the form. The functionsdescribed in section 2.2 are in fact links to a small number of common query processors:• Shortcut Query• Comtrade Explorer• Basic Query• Express SelectionThese four processors can be directly accessed from the Data Query & Selection links and each of them has its own section in this document. Refer to the Table of Contents.2. An empty filter field means that no filtering takes place: the whole data set is selected. This is true allover this document.3. The Classification field defines the international codes that represent commodity descriptions. This pointis discussed later.4. The Quick Filter combo makes it possible to filter the selection by selecting an extra criterion thatrelates to partner country, year or commodity:Figure 5: Extra selection by commodity (first three letters are ‘pet’)(Continued on the next page)Selecting the first entry in the list above and clicking Apply produces the following report:Figure 6: results of selection by country (France) and commodity (gases except from petroleum)Finally, the Further Research combo allows Users to change the selection criteria without returning to the original interface. For instance, we can select other reporting countries:Figure 7: changing selection criteria in the Comtrade Explorer reportList of currently selected countriesListmanagementbuttonsNew country selectionCommodity code in the classificationList of classification codesQuery processornameList of actionsQuick filtercombo Selection summaryList of actionsProcessor name1.1.2.3. View GraphClicking View Graph in the list of actions brings up a pie chart that reflects the current selection:Figure 21: detailed information on two commodities – graphical formThis is the Comtrade Explorer Processor interface we already met in fig. 5; also see Note 1 below this figure. The pie chart shows the two selected items trade values compared to all the other commodities.Again, a “tooltip” text pops up when moving the mouse cursor over the pie chart.Back to fig. 5, we notice the already described Quick Filter and Further Research combos.1.1.2.4. Printable Forma tThis action simply displays the trade information in fig. 19 using the whole screen width, so as to get a full- page report. Also notice the included commodity labels:Figure 22: Printable Format display – may need enlargement1.1.2.6. SDMX DownloadThe results of a query can be downloaded to the User’s station in SDMX format, provided the User doesn’t download more than 1,000 records the same day.The SDMX format is introduced in the Data Transfer Mechanism Manual; it is based on the XML1 format and adapted to statistical data description and transfer.To illustrate this download operation, we can start from the following query results:Figure 25: Basic Query resultsClicking ‘SDMX Download’ brings up the following warning message box:Figure 26: file download warning messageNotice the constant filename. Clicking Save displays the usual ‘Save As’ interface that allows the User to select the destination file (path and name)1 Extensible Markup Language: a standard for designing and creating HTML documentsFinally, the downloaded file is visible through Windows Explorer:Figure 27: the downloaded SDMX file (highlighted) – the name was left unchangedAs stated before, this file has a XML-like structure; it can be read by Internet Explorer:Figure 28: SDMX file contents (partial view)1.1.2.7. View Not Available DataThis function points out the data items that are not available (i.e., that haven’t been provided by the selected country, or that have been rejected by UNSD…), for the selected year, classification and commodity. Most of the time, the data will be available, and the following form will pop up:Figure 29: not available data: none for this exampleAnother selection can show unavailable data for a specific year:Figure 30: data from Albania unavailable in 2002 for the selected commoditiesTab selection List of filter values (empty for the moment)Filter list management1.1.3.2. CommoditiesThe Commodities tab interface is reproduced below:Figure 32: selection of commodity “cars”The Source combo makes it possible to select the data source from which records will be selected:Figure 33: selecting the data selection sourceThese data selection sources are discussed in this paragraph, tagged with a ‘’ sign. (Continued on the next page)Selection-resulting tree symbol.Items finally selected – this is a ‘OR’ listNode and its descendants selectedNotice the signsSelectedExcludedSpecial ItemsThis entry selects commodities according to their code structure, namely their number of digits:Figure 39: selecting commodities by number of digits in codeThe digit-number selection can be added to commodity type conditions. Remember that the query processor makes the union (not the intersection) of selected commodities, like they appear, for instance, in fig. 37.The TOTAL entry means the total of trade flows. This entry should not be confused with (All): (All) means all the registered commodities (or countries, or years, depending on the current tab of the selection interface –see fig. 32). 'TOTAL' returns one summarized record while (All) returns all the available items, with one record per item.When it comes to country selection, (All) should neither be confused with ‘World’. ‘World’ is a pre-aggregated group of the countries that make up the world. (All) means all the partner countries. 'World' is similar to'TOTAL'.Note: when used by the Comtrade Explorer processor, TOTAL and (All) have other meanings. Refer to Comtrade Explorer section.My Favorite Commodities / Commodity GroupsGuest Users cannot define their own favorite items. They can use the standard, built-in groups of commodities and countries. There should be more of these groups in the near future. The picture below shows the standard country groups every guest User can select when the Reporter or the Partners tab is up:Figure 40: standard country groups (or trade agreements between countries)Nb of records retrieved Optional additional selection Selection summaryNew nb of recordsAnother extra selection can be carried out, for instance from the partners. If we click on Partner World in fig. 42, we get a country-broken down report:Figure 43: country-broken down report (first page partial view)We notice that the records themselves are now displayed: this is because there are less than 1,000 of them. In fact, this is more an aggregation than a filtering operation: retrieved records are aggregated by reporting countries. A true filtering by partner can be achieved through the Partners tab interfaceThe Quick Filter combo can also be used to filter the selection. Refer to the Shortcut Query section for details and examples.The Sort Order combo gives the list of all parameter permutations and makes it possible to select the order records will be displayed.Back to fig. 32, we notice a ‘Go to Comtrade Explorer’ button. Clicking this button leads to the Comtrade Explorer - snapshot display we already met in the Shortcut Query section, since Shortcut Query uses in fact the Comtrade Explorer processor. This processor is discussed in its own section.1.1.3.3. ReportersThe same –but far simpler, because there is only one level of data– filter operation can be carried out to select one or more reporting countries from the Reporters tab:Figure 44: Reporters tab interfaceThe Reporters selection has already been discussed in the Quick Search section. Keeping the Commodities selection of fig. 36, we can filter the query by two reporting countries:Figure 45: two countries (Italy and Japan) selected in Reporters interfaceThe new query gives the following results:Figure 48: query results for Commodities, Reporters and Partners selection (partial view)We notice that this time, the retrieved records are also displayed. This is because there aren’t too many of them.1.1.3.5. YearsOne or more years can be selected through the Years tab:Figure 49: additional selection by yearThe query results are now:Figure 50: selection by Commodities, Reporters, Partners and Years (full view)Only Trade Values >=1,000,000 will be keptSum up records with sameselection values exceptQuantity Unit codes Sorted by…‘Ignored for Aggregation’1.1.4. Comtrade Explorer1.1.4.1. Outline and ExamplesThe next entry in the Data Query & Extraction links is Comtrade Explorer. People familiar with Internet search engines (such as Google) will easily use this processor. In addition, some of its interfaces have already been described when discussing the Shortcut Query function.When clicking the Comtrade Explorer entry, the following interface pops up:Figure 54: Comtrade Explorer initial interfaceThe User can enter any word that defines a commodity, a county or a year. For instance:Figure 55: example of search stringClicking Search displays the following global results:Figure 56: Comtrade Explorer – global results for the query(Continued on the next page)Selection reminderPercentage repartition by countrySelection reminder: France added as PartnerSummary of reported dataMeta-language capabilities LinksThe Advanced Items frame allows Users to filter the available data according to Trade Values, to define a sort sequence and to set an aggregation option on Quantity units:Figure 66: Express Selection – Advanced Items tabThis interface has already been discussed in the Basic Query section, form Others.(Continued on the next page)List of actions Several pages to displayClicking View Graph displays summary information about the most important export Partners:Figure 68: Express Selection – top export Partners。
联合国贸易与发展会议的数据库使用
联合国贸易与发展会议的数据库使用联合国贸易与发展会议(简称UNCTAD)是一个全球性的国际组织,致力于通过促进可持续和包容性的国际贸易和投资,推动发展中国家的经济发展。
作为支持其目标的一项重要工具,UNCTAD拥有一个庞大的数据库,为研究人员、政策制定者和其他相关利益相关者提供了丰富的经济和贸易数据。
这篇文章将重点介绍UNCTAD数据库的使用方法和优势。
UNCTAD数据库包含了大量的统计数据、研究报告和政策文件。
其中包括国际贸易数据、投资流量、跨境资本流动、经济指标、开发指标等。
通过访问和使用这些数据,用户可以深入了解全球经济发展的趋势和模式,分析贸易和投资的影响,为制定政策和决策提供有力的依据。
在使用UNCTAD数据库之前,用户需要注册并创建一个个人账户。
注册过程简单且免费。
一旦完成注册,用户可以登录其账户,从而可以访问和利用全部的数据库资源。
用户可以根据自己的具体需求和兴趣选择不同的数据库功能和工具来获取需要的数据和信息。
UNCTAD数据库的主要优势之一是其全面性和权威性。
作为一个由联合国制定的全球性组织,UNCTAD收集、整理和发布的数据具有高度的权威性和可信度。
这些数据通常由各国统计机构提供,经过严格的审核和验证,可以用于准确反映全球经济和贸易情况。
此外,UNCTAD的研究报告和政策文件也是各国政府和研究机构的重要参考。
值得一提的是,UNCTAD数据库的使用不仅限于研究和学术领域,政策制定者、企业和社会组织等各类用户也可以从中受益。
政府可以利用UNCTAD数据来评估其经济政策的影响,为未来的发展制定相应的战略。
企业可以利用UNCTAD数据来洞察市场动态,制定国际化战略。
社会组织可以使用UNCTAD数据来推动可持续发展目标的实现,并为改善全球经济体系作出贡献。
总之,UNCTAD数据库是一个强大的工具,可以帮助用户深入了解全球经济和贸易发展的动态和模式。
通过使用这个数据库,用户可以获取、分析和解释大量的经济和贸易数据,为研究、决策和政策制定提供有力支持。
- 1、下载文档前请自行甄别文档内容的完整性,平台不提供额外的编辑、内容补充、找答案等附加服务。
- 2、"仅部分预览"的文档,不可在线预览部分如存在完整性等问题,可反馈申请退款(可完整预览的文档不适用该条件!)。
- 3、如文档侵犯您的权益,请联系客服反馈,我们会尽快为您处理(人工客服工作时间:9:00-18:30)。
选择Data QueryBasic Selection的步骤是这样的:
第一步是选择Commodity:
1. 首先要确保HS选项中,选择As reported,这个意思是商品的HS编码按照数
据报告国的选择。比如有些国家用的是07年的,有些是12年的,也许会有
不同。
2. 在step1. Select Source中,选择Commodities Search;在Step2. Select Items中,
填4410(刨花板的HS码),然后点Search,你会得到下图。然后,点开44
前面的加号,就可以看到4410编码。
3. 选中4410(这个过程要稍微等一下,需要几秒,等加载完成),点Add,这
个商品就已经选择成功了。如下图:Selected Items里的就是选定的商品。
然后可以按照这个步骤,再添加4411和4412,如果想删除Selected Items里的
商品,只需要选中后,点Remove,全删是Remove All就可以了。
第二步是选择Reporter:
这个您的操作是没问题的,只是要确保点了Add, 将World(Aggregate)填入
Selected Items
第三步是选择Partners:
选择All和World是不一样的, All返回的是所有国家的数据,World返回的是
整体数据。如果您需要世界整体出口数据,那选择World就可以了。
第四步是选择年份,与Partners相同。
最后是Others,可以选择进口或者出口、数据范围和输出的格式。
所有都选好后,应该就没有别的问题了。得到这样的数据:
这里面第一行的数据是所需要的,说实话,我还弄不清后两行的数据是什么意思。
Quantity Unit是8,代表kg,Flag是数字6,代表数量和重量都有估计。
选择Data Query Express Selection的步骤是这样的:
1. 首先还是要确保HS选项中,选择As reported
2. 然后填写这几个输入框。
Enter Commodity Codes / Text:商品编码
Enter Reporters Codes / Text:Repoter的编码
Enter Partners Codes / Text:Partners的编码
Enter Years:年份
Select Trade Flow:贸易流向
(如果不知道某种商品的编码,或者某个国家的编码,就点相应输入框后面的
Lookup,进行选择)
如果像上图一样,Reporter和Partner都填World,就会返回庞大的数据,所以网
站不建议在页面显示,可以下载下来。
但我们如果只需要世界整体的数据,那有个办法,点上图中的View Graph & Map,
就能得到下面的数据:
不光有总体数据,还有前五国的排名,如果电脑的显示允许的话,还能看到饼状
图。
如果想看每一个国家的出口额,就在Partners里填0,0代表整个世界,但跟World
的返回还不一样。
事实上,All、World和0都代表世界,在Reporter和Partner里都能填,但返回
的数据不同,您可以多尝试一些,就能找到规律。