CURRENCY EXCHANGE INFORMAL MARKET IN BRAZIL
巴西商业研究报告英文版

BUSINESS DYNAMICS: BRAZIL Euromonitor InternationalMay 2017LIST OF CONTENTS AND TABLESChart 1SWOT Analysis: Brazil (1)Regulatory Environment (1)Time Taken To Pay Taxes Is the Highest Globally in 2017 (1)Chart 2Overview of the Business Environment in Brazil (2)Operating Risks (2)Corruption Is Prevalent, But Lower Than Peers (2)Chart 3Case Study on Operating Risks: Brazil (3)Chart 4Operational Risks in Brazil (3)Access To Finance (4)Brazil Continued To Record the Highest Annual Lending Rates Regionally in 2017 (4)Chart 5Finance in Brazil (4)Transport and Infrastructure (5)Fourth Highest Logistics Ranking in the Region (5)Chart 6Infrastructural Environment in Brazil (5)Communications and Innovation (6)A Relatively Developed Ict Environment (6)Chart 7Case Study on Communication and Innovation: Brazil (7)Chart 8ICT Environment and Innovation in Brazil (7)Education and Skills (8)Skill Shortage Is A Key Challenge (8)Chart 9Education and Skills in Brazil (9)Employment and Labour Costs (10)Youth Unemployment Rate Surged To Reach A Record High Level in 2016 (10)Chart 10 An Overview of the Labour Market in Brazil (10)Regional Comparison (11)Chart 11Chart 11 Overview of Regional Comparison (11)BUSINESS DYNAMICS: BRAZILBrazil’s business environment benefits from generally open policies towards foreign direct investment (FDI), government support to infrastructure and innovation activities, and a developing information and communications technology (ICT) sector. However, several challenges remain in the form of excessive bureaucratic procedures, a cumbersome tax system, persistent corruption, rigid labour market and weak quality of education.Chart 1 SWOT Analysis: BrazilSource: Euromonitor InternationalREGULATORY ENVIRONMENTTime Taken To Pay Taxes Is the Highest Globally in 2017Brazil ranks to be one of the most difficult places to do business in Latin America:▪Brazil’s economic freedom ranking deteriorated over 2011-2017, making it the eighth most economically unfree nation regionally in 2017, due to its weak fiscal position, high state intrusion and inefficient regulations;▪Generally open policies towards FDI exist in Brazil, but limitations persists in certain sectors, including health, mass media, telecommunications and aerospace. The government in March 2016 passed a bill to ease restrictions on FDI in the airline companies to 49.0% from 20.0%, and also seeks to open agricultural lands to foreign buyers;▪The Ease of Doing Business ranking worsened in the past two years, making Brazil the 10th most difficult place to do business in Latin America in 2017, owing to excessive levels of red tape that prevail in its business regulations;▪Brazil recorded the fourth highest total tax rate regionally in 2017. While the country does offers tax rebates for exporters and investment made in less developed areas, the effective tax burden remains very high.Chart 2 Overview of the Business Environment in BrazilSource: Euromonitor International from the World Bank/Heritage FoundationNote: The Index of Economic Freedom Rankings 2017 are out of 180 nationsOPERATING RISKSCorruption Is Prevalent, But Lower Than PeersBurdensome regulations and persistent corruption make it difficult for businesses to operate: Corruption remains prevalent in Brazil despite various government initiatives. The Clean Company Act 2014 stipulates strict penalties for companies whose employees engage in corrupt acts. Under the ongoing ‘Operation Car Wash’, Brazil’s former President Dilma Rousseff was ousted in August 2016, accused of corruption;Brazil’s 2015 regulatory qua lity ranking worsened over the years and stood relatively lower, as firms operating here are known to suffer from long bureaucratic delays, efficiency losses, and additional costs owing to red tape.Chart 3 Case Study on Operating Risks: BrazilSource: Euromonitor InternationalChart 4 Operational Risks in BrazilSource: Euromonitor International from Transparency International/Institute for Economics andPeace/UNDOC/World BankNote: Global Terrorism Index 2016 scores were calculated for 162 countries. A higher score (out of 10.0) in the Global Terrorism Index implies a worsening country environment related to terrorism. A higher ranking in the Rule of Law Index implies better governanceACCESS TO FINANCEBrazil Continued To Record the Highest Annual Lending Rates Regionally in 2017It is getting tougher for businesses to get credit in Brazil, but the central bank recently slashed its key interest rate:▪Given low economic activity and inflation, between October 2016 and April 2017, Brazil’s Central Bank slashed its key interest rate by 300 basis points in total to reach 11.25%, signalling the reduced cost of borrowing;▪A low level of information available on borrowers as well as lenders, signals higher occurrences of defaults and fraudulence, making getting credit difficult in Brazil;▪To control inflation the central bank continuously raised interest rates over 2013-2016, causing the annual lending rate to rise to reach its highest level of 52.3% in more than a decade. Prolonged recession over 2013-2016, contributed to the rise in bank nonperforming loans over the years to become the fourth highest regionally in 2016;▪The country’s Stock Market Index was one of the worst performing globally as it contracted by 13.4% over 2011-2016, owing to four years of prolonged recession that caused both investor and consumer confidence to plunge.Chart 5 Finance in BrazilSource: Euromonitor International from IMF/IFS/World Bank/World Federation of Exchanges/national sources/OECD/UNTRANSPORT AND INFRASTRUCTUREFourth Highest Logistics Ranking in the RegionBrazil has a generally weak infrastructure network with logistics and transport services doing poorly:▪Brazil recorded the fourth highest ranking regionally in the Logistics Performance Index 2016, as its ranking improved since 2014, partly due to a higher score in the efficiency of customs and border clearance sub-category. However, the share of paved roads in Brazil was only 12.1% in 2016 compared to the OECD and Latin American averages of 70.6% and 21.0% respectively, contributing to logistical bottlenecks and rising transportation costs;▪In June 2015, the government launched an infrastructure package worth US$64.0 billion; a third of the amount will be spent by 2018 on transport infrastructure and the rest will be rolled out gradually commencing from 2019.Chart 6 Infrastructural Environment in BrazilSource: Euromonitor International from ICAO/World Bank/national statistics/IRF/International Union of Railways (UIC)/EurostatNote: A higher score in the Logistics Performance Index (and its sub-categories) implies a better logistical environmentCOMMUNICATIONS AND INNOVATIONA Relatively Developed Ict EnvironmentThe government is taking steps to enhance digital coverage in rural areas:▪Brazil’s Networked Readiness Ranking worsened over 2011-2016, but stood higher than most of its peers, thanks to its large mobile subscription rate. Purchase of digital devices is on the rise, driven by declining technology prices, an expanding access network and a growing ‘new middle class’. However, regional disparities in purchasing power and educ ation levels impact possession rates, as does the state of the network infrastructure. In 2015, the government announced a new National Broadband Plan, to encourage higher coverage among poorer consumers;▪R&D intensity of 1.2% in 2016 was the highest regionally, thanks to various government programmes launched to boost R&D amongst private enterprises.Chart 7 Case Study on Communication and Innovation: BrazilSource: Euromonitor InternationalChart 8 ICT Environment and Innovation in BrazilSource: Euromonitor International from UNCTAD/Eurostat/ITU/WEFNote: Networked Readiness Ranking (NRR) 2011 is out of 138 nations and NRR 2016 is out of 138 nations EDUCATION AND SKILLSSkill Shortage Is A Key ChallengeHigher education rate is rising, but was the second lowest regionally in 2016:▪While Brazil’s higher education rate continuously rose over 2011-2016, it still stood as the second lowest regionally in 2016, as a large proportion of Brazilians cannot afford to pay for higher education;▪Brain drain is somewhat a problem, but Brazil’s resilience during the 2008-2009 globalfinancial crisis has helped ease it. The low quality educational system continues to generateskills shortages that are most evident for positions like doctors and engineers, hampering innovation in its high-tech industries.Chart 9 Education and Skills in BrazilSource: Euromonitor International from national statistics/UN/Eurostat/OECD/UNESCONote: PISA stands for Programme for International Student AssessmentEMPLOYMENT AND LABOUR COSTSYouth Unemployment Rate Surged To Reach A Record High Level in 2016Brazil has a very rigid labour market, due to its tough hiring and firing procedures:▪Huge layoffs across sectors caused the unemployment rate to reach its highest level in more than a decade in 2016 and the youth unemployment rate to reach its record high level of28.9% in 2016;▪Despite continuous decline, both wage per hour and in manufacturing ranked amongst the highest regionally in 2016, adversely impacting the competitiveness of Brazil’s manufacturing and services sectors. Conversely, the country’s mo nthly minimum wage stood relatively low in 2016, but the government recently increased it to BRL937 (US$288) in 2017 from BRL880 (US$270) in 2016;▪Powerful and well-organised labour unions have led to lack of flexibility in wage determination. Chart 10 An Overview of the Labour Market in BrazilSource: Euromonitor International from ILO/Eurostat/national statistics/World BankNote: (1) ‘Wholesale and Retail Trade’ includes Repair of Motor Vehicles, Personal and Household Goods;(2) ‘Financial Intermediation’ includes Real Estate, Renting and Business Activities;(3) ‘Undefined sectors’ refers to activities not adequately defined elsewhere in the other categories REGIONAL COMPARISONChart 11 Chart 11 Overview of Regional ComparisonSource: Euromonitor International from International from International Monetary Fund (IMF)/International Financial Statistics/ International Labour Organisation (ILO)/Eurostat/national statistics/World EconomicForum/World Bank。
巴西市场商业计划书英文

Dubeux Com. & Rep. Portfolio
Trevo IndustrySofima IndusaFiel Industrial EquipmentDaewooHidromineral AlegriaExttra Mineral
Company Resources
Main Office located in São PauloNortheast Office located in Recife to facilitate logistics operation.VPN IntegrationAsterisk Call Center SystemToll-free number and local area code Voip numbers for the 7 largest States.Website (Portuguese and Spanish)Same day product delivery for orders in São Paulo, Rio de Janeiro and Recife. Operated by a third party motorcycle courier company.
Romero Dubeux de Andrade
I was born and raised in Brazil. My father is an American citizen, which makes me a dual citizen by birth of both Brazil and the United States.I am fluent in Portuguese, Spanish and English.Graduated in International Business – Integrated University of Recife, PE, Brazil
人民币与巴西雷亚尔汇率变动对中巴贸易的影响及对策
人民币与巴西雷亚尔汇率变动对中巴贸易的影响及对策人民币与巴西雷亚尔的汇率变动是国际贸易中一个重要的影响因素。
中巴之间的贸易发展日益紧密,因此汇率的波动对两国经济和贸易关系将产生重要的影响。
本文将探讨人民币与巴西雷亚尔汇率波动对中巴贸易的具体影响,并提出相应的对策。
一、人民币升值对中巴贸易的影响人民币升值对中巴贸易产生了一定的影响。
首先,人民币升值导致巴西货币的相对贬值,使得巴西商品在中国市场上的竞争力下降,中国进口巴西商品的成本相应增加。
这将对中国进口巴西商品的规模和贸易结构产生一定的影响。
其次,人民币升值加大了巴西对华贸易的风险,使得巴西企业在中国市场的投资意愿减弱,甚至可能导致巴西企业撤离中国市场。
这对于中巴贸易的经营稳定性和发展前景均带来不确定性。
二、巴西雷亚尔贬值对中巴贸易的影响巴西雷亚尔贬值对中巴贸易同样产生了影响。
首先,巴西雷亚尔贬值使得中国商品在巴西市场上的价格相对上升,中国对巴西的出口可能会受到一定的压力。
这将对中巴贸易总额产生一定的影响。
其次,巴西雷亚尔贬值会提高巴西对华贸易的成本,加大巴西企业在进口中国商品时的财务压力。
这可能导致巴西对华贸易的减少,对巴西经济产生一定的负面影响。
三、应对人民币与巴西雷亚尔汇率变动的对策为了应对人民币与巴西雷亚尔汇率的波动,中巴两国可以采取一系列的对策。
首先,加强贸易合作,增加双边贸易总额,以减轻汇率波动对贸易的影响。
中巴两国可以进一步推进贸易便利化,加强贸易促进机制的建设,提升贸易的便利程度与效率。
其次,建立货币互换机制,降低贸易结算的汇率风险。
中巴两国可以积极推进双边本币互换协议的签订,增加双边贸易结算中本币的使用比例,减少对第三国货币的依赖。
此外,中巴两国还可以探索建立货币联动机制,通过汇率固定、浮动联动等方式,减轻汇率波动对贸易造成的影响。
另外,中巴两国还可以加强经济合作,在贸易以外的领域加强合作,推动双边投资合作的发展。
通过加强产能合作、技术交流等方式,提高贸易的多元化和稳定性,减轻汇率波动对贸易的影响。
china's export中国进出口分析外文文献

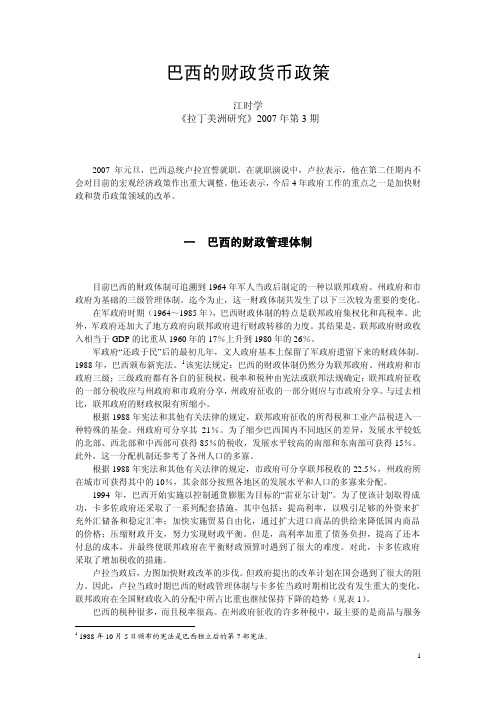
Rev World Econ(2013)149:565–585DOI10.1007/s10290-013-0149-2O R I G I N A L P A P E RChina’s fare share?The growth of Chinese exportsin world tradeSteven Husted•Shuichiro NishiokaPublished online:6February2013ÓKiel Institute2013Abstract The growth of Chinese exports in market share over the past two dec-ades is a singular event in the history of world ing data from1995–2010, we document this growth in a variety of ways.We show that the expanded trade is pervasive.Virtually every country in the world has seen China claim a larger share of its import market.Then,we use Constant Market Share analysis to determine which country or countries have lost market share as China’s trade has grown. Contrary to much discussion in the popular press,wefind strong evidence that other developing countries have not seen export shares fall as a result of China’s gains. Rather,our results suggest that China’s share growth has come largely at the expense of exporters based in developed countries,especially Japan and the United States.Keywords Chinese exportsÁConstant market share analysisÁExport shares JEL Classification F14ÁP331IntroductionOver the past two decades the Chinese economy has grown at a remarkable pace. Between1995and2007Chinese real GDP grew at an average annual rate of more S.Husted(&)Department of Economics,University of Pittsburgh,4508WW Posvar Hall,Pittsburgh,PA15216,USAe-mail:husted1@S.NishiokaDepartment of Economics,West Virginia University,1601University Avenue,Morgantown,WV26506-6025,USAe-mail:Shuichiro.Nishioka@566S.Husted,S.Nishioka than10%.Per capita real GDP rose by250%over this period.1One of the leading factors driving this economic growth has been the extraordinary performance of Chinese exports.According to the World Trade Organization(WTO),in2010China rankedfirst in exports to the world market with merchandise export sales of more than$1.5trillion and a world market share of10.4%.In1998,China had less than 2%of the world market.Twenty years earlier,China’s share was essentially zero. As China’s share of world exports has grown,it has come under increasing pressure to allow its currency to appreciate;often the criticism of its exchange rate practices includes charges that other developing and emerging market economies have borne the brunt in terms of lost export markets.2The purpose of this paper is to provide an analysis of Chinese export growth over the period when its share of world exports rose most rapidly,the years1995–2010. We provide detail on the commodity composition of Chinese exports and how this composition has changed.We also discuss some aspects of the geographic pattern and commodity composition of Chinese trade.In addition,a fundamental contribution of this paper is that we provide considerable evidence that the principal exporting countries that have lost market share to China are developed countries,especially Japan and the United States.We use Constant Market Share(CMS)analysis(i.e.,Fagerberg and Sollie1987) to determine which offive factors(i.e.,market share,commodity composition, commodity adaptation,market composition,and market adaptation)are responsible for the rise of Chinese share.During the period we consider,the market share effect is the critical factor to explain the share change in the world trade.This element of trade growth captures the extent to which an exporter gains or loses market share against other exporters independent of changes in the product and destination pattern of world imports.In particular,almost all share gains of China over the period1995–2010(i.e.,the market share effect accounts for11.6of12.9percentage points(pp.)of Chinese share gains)stem from the market share effects.3 We also apply CMS analysis to the sub-periods of1995–2000,2000–2005,and 2005–2010.In the period of1995–2000,the share gain of China was relatively moderate (2.9pp.)and Japan and Germany lost market share in roughly equal amounts(2.4and 2.2pp.,respectively).The United States also saw its world export market share rise during this period,due primarily to the commodity composition effect.That is,the United States gained market share because the structure of world import demand changed toward the types of goods that the United States exports.During the period2000–2005,Chinese market share increased by5.8pp.and the majority of Chinese share gains were accompanied by the significant market share loss of the United States(-4.0pp.).Finally, over the sub-period(2005–2010)that included the great trade collapse of2008–2009, 1These numbers use China Version2data from the PWT6.3data set.See‘‘What is New in PWT6.3?’’link on the Penn World Tables site,/php_site/pwt_index.php,for a discussion of the differences between this version of Chinese data and official Chinese data.2See,for instance,Arvin Subramanian,‘‘Who Pays for the Weak Renminbi?’’,11February2010,Vox Front Page,/index.php?q=node/4604.3With the exception of Sect.2,the discussion of share changes in the remainder of this section and the rest of the paper refers to trade in manufactured goods(SITC categories5–9)among a sample of92 countries and Hong Kong.China’s fare share567 China’s share increased by4.2pp.and the market share and commodity adaptation effects both explain the share changes.While developed countries’demands for manufacturing goods had slowed due to thefinancial crisis,developing countries’demands for foreign manufacturing goods were relatively strong.China had increased its world market share by exporting intensively to emerging developing countries.4 The rest of the paper proceeds as follows.In Sect.2we present an overview of Chinese trade expansion.In Sect.3we discuss CMS analysis,an empirical technique that provides a method for studying changes in export market shares.In Sect.4,we apply CMS to study trade patterns among a sample of94countries over the period1995–2010in commodity trade disaggregated at the5-digit SITC level. We also apply CMS to study the periods to1995–2000,2000–2005,and2005–2010. In Sect.5,we expand our analysis by focusing on export behavior across industries and in individual export markets.Section6offers our conclusions.2An overview of Chinese export performanceFigure1provides a time series plot of world export shares forfive of the world’s leading exporting countries,Germany,China,Japan,the United Kingdom,and the United States over the post World War II era.As thefigure shows,since the end of World War II,only Germany has seen as rapid and as large a rise in world export share as China.In the eleven year span from1948to1958,Germany’s share of world exports rose from1.3to10.3%,roughly matching in both magnitude and duration China’s performance.However there are several major differences between the two. First,Germany’s growth almost certainly represented a return for that country to a market position similar to the one that it had held prior to the war era.Second,at the time of Germany’s significant growth there were far fewer major exporters competing for market share.For instance,in the1950s the combined world export share of the countries now known as the Asian Newly Industrialized Countries (NICs)(Korea,Malaysia,Singapore,and Thailand)was virtually zero.In contrast, since at least the onset of the industrial revolution and prior to the1990s,China had never held a significant share of world trade.And,China’s export growth came only slightly after significant growth by the NICs and simultaneously with major growth by several other countries that along with China make up the BRICs(Brazil,Russia, and India),all of whom now also hold relatively large shares of the world market.Like all major exporting countries,China has a market presence in virtually every country in the world;this presence has grown in almost every market in recent ing data from the United Nation’s Commodity Trade Statistics Database we calculated aggregate exporter market shares in92countries and1territory (Hong Kong),from all parts of the world.5Several interesting patterns emerge from 4In a related study,Wood and Mayer(2011)look at how the entry of China into international markets over the past three decades has impacted production of primary and labor-intensive products in a wide set of developing countries.Theyfind that although output and exports of labor-intensive goods continued to rise following the emergence of China in the1990s,the growth in these ratios was slower in the1990s than in the1980s.5These countries were chosen due to the availability of the import data from UN Comtrade.568S.Husted,S.NishiokaTable1China’s national export market share by regionCountries2010national market shares(%)Share changes1995–2010aAverage SD Maximum Minimum Average SD Maximum MinimumAfrica2015.99.349.1 6.213.09.145.5 3.1Asia and Pacific1318.910.749.1 4.211.8 3.415.9 3.8 Europe319.4 6.536.0 3.18.0 6.033.4 2.4 Middle East712.0 1.113.310.210.20.711.09.0 North America316.4 5.221.911.613.1 2.615.09.5 South America1912.77.735.1 5.211.77.435.1 4.2Total9313.28.449.1 3.110.7 6.935.1 2.4a Share changes are measured in percentage pointsthis exercise.First,the global extent of China’s trade expanded significantly between1995and2010.By2010,China had at least3%of the market in all of these countries.Moreover,market share growth was pervasive;over the1995–2010 period China’s market share grew in all of these markets.In many cases,especially in South America,Africa,and smaller European countries,shares were essentially zero prior to1995.Table1provides some additional summary statistics.According to the table,geography is clearly important for China’s trade.At the end of2010,its highest regional market share was in Asia where among the sample countries it had an average share of18.9%.Its highest market share among all the Asian countries in the sample stood at49.1%.6Its next highest average regional market share was in North America;this included16.7%of all U.S.merchandise 6This was China’s share of Hong Kong’s market.Among the other Asian countries in this sample China had more than25%of Japan’s market in2010and more than10%of the export markets of Thailand, South Korea,Pakistan,and Singapore.China’s fare share569 imports in2010.On average,China’s smallest regional market penetration was in Europe,where its average national market share in2010was9.4%.Since2005, China’s export shares have increased particularly in remote and low-income countries.For example,the average of China’s export shares in African countries increased from8.3to15.9%.For the South American countries in our sample, China’s average market share almost doubled,rising from6.6to12.7%.As detailed more fully below,China’s export market share has grown in recent years,and it has changed the mix of goods it supplies to world markets.By value, virtually all of Chinese exports are manufactured goods.Early on,these exports were concentrated in Miscellaneous Manufactured Articles(SITC Category8), including apparel and toys.While that category still accounts for a significant share of Chinese exports,more recently Chinese trade growth has been concentrated in Machinery and Transport Equipment(SITC Category7).In order to better focus on this change in the commodity composition of trade,we restrict our attention to exports of differentiated manufactured products disaggre-gated at the5-digit SITC level.In much of what follows we continue to analyze data from a set of94countries.7Our sample includes countries from every continent and includes countries at various standards of living;slightly more than one-third the countries chosen in our sample are classified by the World Bank as high-income countries.In2010,the countries used in our analysis accounted for76.8%of total world imports.8Trade among these countries accounted for a majority of all world merchandise trade in each of the years in our sample.Thefirst panel of Table2provides detail on the composition of Chinese exports in1995and2010across broad categories of goods to our sample of markets as well as the countries identified as developing countries.9Also included in the table is China’s portion of total world exports at the1-digit level(SITC Rev.3)in1995and 2010.As the table shows,Chinese exports have been centered in manufactures for some time.In1995,90%of Chinese exports to our sample countries came from industries classified in SITC sections5–9.By2010,that share had risen to almost 95%of total exports.Traditionally,Chinese exports have been concentrated in Miscellaneous Manufactured Articles(SITC Category8).This sector includes many labor intensive manufactured products such as clothing,footwear,and toys,items 7In addition to China,we use the following countries:(Africa)Algeria,Burkina Faso,Burundi, Cameroon,Coˆte d’Ivoire,Egypt,Ethiopia,Gambia,Kenya,Madagascar,Malawi,Mauritius,Morocco, Mozambique,Niger,Togo,Tunisia,Uganda,Tanzania,and Zambia;(Asia and Pacific)Australia,Hong Kong,India,Indonesia,Japan,South Korea,Malaysia,Maldives,New Zealand,Pakistan,the Philippines, Singapore,and Thailand;(Europe)Austria,Croatia,Cyprus,the Czech Republic,Denmark,Estonia, Finland,France,Germany,Greece,Hungary,Iceland,Ireland,Italy,Kazakhstan,Kyrgyzstan,Latvia, Lithuania,Malta,Moldova,the Netherlands,Norway,Poland,Portugal,Romania,Slovakia,Slovenia, Spain,Sweden,Switzerland,and the United Kingdom;(Middle East)Bahrain,Israel,Jordan,Oman, Qatar,Saudi Arabia,and Turkey;(North America)Canada,Mexico,and the United States;(Central and South America)Argentina,Barbados,Belize,Bolivia,Brazil,Chile,Colombia,Costa Rica,Dominica, Ecuador,El Salvador,Guatemala,Jamaica,Nicaragua,Panama,Paraguay,Peru,Suriname,and Venezuela.8Our data set consists of bilateral trade of93countries.We calculate the total world imports from the sum of total imports of all available countries in UN Comtrade.9Developing countries are those not classified as being a high-income country by the World Bank in its 2009World Development Report.long identified as characteristic examples of Chinese exports.Twenty seven percent of Chinese exports to our sample countries in 2010came from this sector.However,this share had stood at 47%of total exports to these markets in 1995.Instead,in recent years,the share of Chinese exports of more sophisticated manufactures has risen substantially with exports in Machinery and Transport Equipment (SITC Category 7)more than doubling to 51%of its exports to the sample markets.The period 2005–2010includes the onset of the Great Recession in the United States and elsewhere and the consequent 2008–2009collapse in world trade.10AsTable 2Structure of world exports and imports SITC Rev 3Commoditiesposition of Chinese exports all countries II.China’s shares in world (China’s/World exports)1995201019952010(a)Structure of Chinese exports 0Food and live animals 4.5 2.0 3.4 5.01Beverages and tobacco 0.40.1 2.4 1.92Crude materials 2.40.8 2.8 2.33Mineral fuels2.4 1.0 2.3 1.34Animal and vegetable oils 0.10.0 1.10.65Chemicals and related products3.94.7 2.25.86Manufactured goods (materials)15.312.6 5.515.07Machinery and transport equipment 23.250.8 3.119.08Miscellaneous manufactured articles 47.327.418.933.39Other commodities 0.50.8 1.03.8SITC Rev 3CommoditiesIII.The levels of total imports (2005=1)Developing countries Developed countries 1995201019952010(b)Structure of world imports 0Food and live animals 0.789 1.6470.788 1.6421Beverages and tobacco 1.296 2.108 1.840 1.8532Crude materials 0.360 1.7280.533 1.5333Mineral fuels0.248 2.7290.542 3.7484Animal and vegetable oils 0.495 1.3450.935 1.6925Chemicals and related products 0.448 1.7030.629 1.3196Manufactured goods (materials)0.583 1.6840.841 1.2837Machinery and transport equipment 0.561 1.5580.8670.9348Miscellaneous manufactured articles 0.391 1.6220.843 1.0229Other commodities2.8411.4710.5361.394We use import data of 94countries for panels I and II10For detail on this period see Richard Baldwin,The Great Trade Collapse:Causes,Consequences,and Prospects ,VoxEU eBook,2009,/index.php?q=node/4297.570S.Husted,S.NishiokaChina’s fare share571 has been documented by the Nabli(2010)developing countries have rebounded much more strongly from the downturn,and these countries have accounted for much of the growth in trade over the past several years.This pattern shows up well in the second panel of Table2where we document the levels of imports for developing and developed countries for each product group.We set the import values of year2005as1.For example,while the import values of Category7 increased from1in2005to1.558in2010and those of Category8increased from1 to1.622for developing markets,the corresponding values are0.934and1.022for exports to developed country markets.China’s world market shares changes over this period followed the transforma-tion described above.Between1995and2010,its share of Industry7exports to the world increased by a factor of six,while its Industry8market share increased by slightly less than15pp.We are not thefirst to point out the recent growth in the sophistication of Chinese exports.Rodrik(2006,p.4)calculates that by2002China had an export bundle‘‘of a country with an income per capita level three times higher than China’s’’.In a related study,Schott(2008)focuses on Chinese exports to the United States.Hefinds that the composition of this export bundle ‘‘increasingly overlaps with that of the world’s most developed economies’’(Schott 2008,p.34).The data in Tables1and2document the growth of Chinese exports and the change in the sectoral composition of these goods over the period1995–2010. Clearly,the rapid growth of China in the world market has had market share implications for other exporting nations.A number of papers have focused on various aspects of the recent growth of Chinese exports on global competition.One focus of attention has been on whether the growth has occurred due to an expansion of the variety of goods exported(the extensive margin)or a growth in trade of existing varieties(the intensive margin).Broda and Weinstein(2006)find that over the last quarter of the twentieth century roughly30%of U.S.import growth was at the extensive margin,with China the largest contributor.However, using Chinese export data disaggregated at the HS-8level,Amiti and Freund(2010) report that most of Chinese export growth to the world between1997and2005was in existing varieties.Most recently,Manova and Zhang(2009)usingfirm level data on Chinese tradingfirmsfind that a relatively few largefirms are responsible for substantial share of exports;thesefirms export to many markets,and many are foreign owned.A principal focus of our paper is on which other exporting countries are losing foreign markets due to the rise of China.Other papers have also attempted to address this ing a gravity model,Hanson and Robertson(2010)study ten developing countries they identify as potential losers to Chinese competition. However,theyfind Chinese export expansion over the1995–2005period has had only a modest negative impact on the exports of these other countries.In an earlier study,Ahearne et al.(2003)use VAR analysis to see if Chinese exports reduce the exports of other Asian economies.Theyfind instead a positive correlation between exports from these two sources.Thesefindings along with the industry classifica-tions of Chinese exports suggest that major competing countries with China in world export markets may be developed rather than developing countries.In theremainder of this paper,we try to identify which countries have lost share and to provide a measure of the size of the losses.We also focus on the growth of Chinese exports at broad industry levels and in individual export markets.We turn now to describe the modeling strategy we employ to answer these questions.3Market shares methodologyConstant Market Share(CMS)analysis has long been used to study export performance.11This modeling approach treats as a norm of behavior that a country’s market share will remain constant over time.If instead it changes,that must be due to changes in competitiveness or changes in demand from the world as a whole or in individual markets.The analysis then proceeds to decompose export share changes in order to identify these factors.In the1950s and1960s,CMS was a popular tool of analysis.In a well-known paper,however,Richardson(1971)criticized its use, arguing that the signs and magnitudes of the measured effects depend upon in part on the methods used in their calculation.Taking these criticisms into account,Fagerberg and Sollie(1987)(hereafter FS)have proposed several refinements to traditional CMS analysis.These include improved theoretical consistency via the use of Laspeyres weights throughout and an explicit economic interpretation of all decomposed terms.They have also extended the traditional model to include two additional terms which measure the adaptability of the export sector of a country to changes in the commodity and national market composition of world exports.12We now turn to a brief derivation of their model.First,consider the change in exporters’shares in each importer’s market.We define the value of imports of product i from country k to l is defined as m i kl.The market share of country k(an exporter)in product i in market l(an importer)isa kl i ¼m kl i=Xkm klið1ÞProduct i’s share of country l’s total imports is defined asb l i ¼Xkm kli=XiXkm klið2ÞSince the market share of country k is written asM kl¼Xi a klib li;the change in country k’s share of market l between an initial year(time0)and year t isD M kl¼M kl tÀM kl0:11See Leamer and Stern(1970)Chapter7for a derivation of the original model and the references therein for examples of its use.12Irwin(1995)uses the FS approach to study changes in the export market share of Great Britain in the early twentieth century.572S.Husted,S.NishiokaThis equation can be rewritten as the sum of three terms:D M kl ¼D M kl a þD M kl b þD M klabð3ÞwhereD M kl a¼X iða kl it Àa kl i 0Þb li 0ð4ÞD M klb ¼Xi a kl i 0ðb l it Àb l i 0Þð5ÞD M kl ab¼Xiða kl it Àa kl i 0Þðb l it Àb li 0Þð6ÞEquation (4)is the effect of changes in the market share,weighting the change inexporter k ’s share of product i exports by the initial share of the product in market l .Equation (5)is the effect of changes in the product composition of importer l ,weighted by the initial share of the product from country k .The final term,Eq.(6),is a residual term which can be written asD M kl ab ¼r kl ab X iða kl it À"a kl t Àa kl i 0þ"a kl 0Þ2"#0:5Xiðb l it Àb l i 0Þ2"#0:5ð7Þwhere r klab is the correlation coefficient between the changes in market shares and the changes in product shares.FS then extend the decomposition exercise from one market to the world market.The country l ’s share of world imports is defined as:c l ¼X kX im kl i =X kX lXim kl ið8ÞIn this case,we can write the market share of county k in world market as M k ¼X lM kl c l :The change in M k between time 0and time t isD M k ¼D M k m þD M k c þD M kmc¼D M k a þD M k b þD M k ab þD M k c þD M kmcwhereD M k a ¼Xlc l 0Xiða kl it Àa kl i 0Þb li 0"#ð9ÞD M kb ¼X lc l 0Xia kl i 0ðb l it Àb li 0Þ"#ð10ÞD M kab ¼Xlc l 0Xiða kl it Àa kl i 0Þðb l it Àb li 0Þ"#ð11ÞChina’s fare share 573D M kc ¼XlM klðc l tÀc l0Þð12ÞD M kmc ¼XlðM kl tÀM kl0Þðc l tÀc l0Þð13ÞOur analysis focuses on Eqs.(9)–(13);following FS,each can be interpreted as a separate factor that influences export performance.Equation(9)is the market share effect.This term captures the change in an exporter’s share of each product in each country,holding constant the initial commodity composition and the country distribution of world imports.Thus,it captures the extent to which an exporter gains market share independent of changes in the product and destination pattern of world imports.Equation(10)is the commodity composition effect.The commodity composition effect measures the influence of the changing share of products in world trade on an exporter’s overall share.If,for instance,the structure of world imports changes towards more manufactured goods and away from agricultural products,the exporters of manufactured goods(agricultural goods)would see an increase(a decrease)in their market shares.Equation(11)is the commodity adaptation effect.The commodity adaptation effect identifies whether the change in the structure of a country’s exports is correlated with changes in the commodity composition of world imports.This number is zero if the country changes its export structure at the same rate as all countries exporting to the world market.Equation(12)is the market composition effect.This effect measures the influence of changes in the country demand pattern of world imports.Thus,it identifies the countries that increase their world market share by selling their products heavily in expanding markets.Finally,Eq.(13)is the market adaptation effect.This effect captures the correlation between a country’s export destinations and world export destinations.4Empirical results from the CMS approach4.1Share changes from1995to2010For each country in our study,the change in market share of the world market is decomposed into thefive effects discussed above.The results from1,832products for regional exports and a selected set of countries are given in Table3.13The right-most column in table provides the overall percentage change in the total sample export market share for each of the regions and sample countries over the period 13We concentrate on1,8325-digit exports of goods that Rauch(1999)and Hallak(2006)define as differentiated products at the3-digit level.To be consistent across93countries for years1995,2000, 2005,and2010,we use the5-digit level data,which is the highest disaggregation possible for our study. Most of these products are from1-digit SITC sectors of5–8.Since there are gaps in5-digit sub-products 673and676(some types of iron and steel products),we exclude products from these two sectors.We study the CMS decomposition for the country and region level separately.While we use93countries for each of l and k for the country-level analysis,we use the country aggregates of6regions for each of l and k for the regional analysis.574S.Husted,S.Nishioka1995–2010.14The other five columns represent different effects,corresponding to Eqs.(9)–(13),and add up to the total change.The first thing to note about the table is that for most countries in the study,overall export shares hardly changed over the sample period (see the last column).This stability of trade shares is a stylized fact of trade patterns at the bilateral level first pointed out and analyzed by Cassing and Husted (2004,2009)in two related studies.The principal exceptions to this pattern of export share stability over the sample period are China (?12.87pp.),Japan (-5.28pp.)and the United States (-4.29pp.),and four European countries (Germany,France,Italy,and the United Kingdom)combined (-5.25pp.).These results clearly imply that the growth in Chinese export market share has come largely at the expense of exporters in developed countries,in particular Japan and the United States,rather than exporters in developing countries.Since Canada also lost market share,each of the G7countries saw market shares drop over this period,several by more than one percentage point.In fact,the G7countries explain around 80percent of all the share losses.We turn now to discuss what factors have contributed to these changes in trade shares.Table 3Export market share change decomposition:selected countries (1995–2010)Fagerberg and Sollie decomposition (1,832SITC 5-digit products)Market shareCommodity composition Commodity adaptation Marketcomposition Market adaptation Total change in share Africa 0.111-0.0590.0330.0110.0110.108Kenya 0.000-0.002-0.0020.006-0.003-0.001Asia and Pacific 5.353-3.995 5.078-0.0680.350 6.719China 11.594-0.808 3.048-1.1310.16312.867India 0.6760.0380.114-0.061-0.0120.755Indonesia 0.266-0.0290.011-0.039-0.0650.145Japan -6.450-1.359 1.7670.3690.396-5.277Malaysia -0.640-0.3960.520-0.3810.232-0.665South Korea -0.993-1.051 1.7750.1300.6610.523Europe -6.499 2.293 1.258-0.129-0.260-3.337France -1.5390.3070.2010.050-0.037-1.018Germany -1.7040.1480.1520.644-0.178-0.938Italy-1.267-0.281-0.1630.228-0.131-1.616United Kingdom -2.0110.864-0.337-0.130-0.065-1.680North America -6.155 1.5250.3110.021-0.123-4.420Canada -1.1730.2010.139-0.1690.025-0.977Mexico 0.7320.0550.283-0.132-0.0910.847United States -5.9770.8080.9790.284-0.383-4.290South America 0.2310.063-0.1690.1650.0030.293Brazil -0.0210.0200.0280.0310.0250.083Middle East0.4760.146-0.0030.0000.0180.637For the regional-level analysis,we use the country aggregates of 6regions for k and l14Values for the countries not listed in Table 3tended to be very small.They are available on request.123。
有关汇率英语作文
有关汇率英语作文In the global economy, the exchange rate is a critical financial metric that influences trade, investment, and the overall economic health of a country. An exchange rate is the value of one country's currency in terms of another country's currency, and it plays a pivotal role in international transactions.Firstly, exchange rates are determined by the foreign exchange market, where supply and demand for currencies are constantly changing. Factors such as interest rates, economic performance, and political stability can all affect the value of a currency. For instance, if a country has a strong economy with low inflation and high interest rates, its currency is likely to be in high demand, leading to an appreciation in value.Secondly, the fluctuation of exchange rates can have significant implications for businesses and consumers. For businesses engaged in international trade, a favorable exchange rate can reduce costs and increase competitiveness. Conversely, an unfavorable rate can erode profits and make products less attractive in foreign markets.Moreover, exchange rates are crucial for tourists and students studying abroad. A strong domestic currency can make travel more affordable, as it requires less of the home currency to purchase foreign currency. However, this can alsolead to a decrease in tourism from other countries, as the destination becomes more expensive for foreign visitors.Furthermore, governments and central banks often intervene in the foreign exchange market to manage their currency's value. This can be done through various monetary policies, such as adjusting interest rates or engaging in currency swaps. Such interventions aim to stabilize the currency and protect the economy from excessive volatility.Lastly, understanding exchange rates is not just importantfor economists and financial analysts; it is also essential for anyone involved in international dealings. Knowledge of exchange rates can help individuals make informed decisions about when to travel, invest, or conduct business abroad.In conclusion, the exchange rate is a complex and dynamic aspect of the global economy that affects everyone from multinational corporations to individual consumers. By staying informed about exchange rate movements and their underlying causes, one can better navigate the complexities of international finance.。
高二英语英语中的货币表达单选题40题
高二英语英语中的货币表达单选题40题1. If the exchange rate is 1 dollar to 6 yuan, how much is 500 dollars in yuan?A. 3000B. 2500C. 3500D. 2000答案:A。
解析:1 美元兑换6 元人民币,500 美元则是500×6 = 3000 元人民币。
选项B 计算错误,500×5 = 2500;选项C 计算错误,500×7 = 3500;选项D 计算错误,500×4 = 2000。
2. The price of a coat is $80 in the US. How much is it in pounds if the exchange rate is 1 dollar to 0.8 pounds?A. 64B. 56C. 72D. 48答案:A。
解析:80 美元乘以汇率0.8 等于64 英镑。
选项B 计算错误,80×0.7 = 56;选项C 计算错误,80×0.9 = 72;选项D 计算错误,80×0.6 = 48。
3. A book costs £20 in the UK. What is the price in dollars if the exchange rate is 1 pound to 1.3 dollars?A. 26B. 20C. 15D. 18答案:A。
解析:20 英镑乘以汇率1.3 等于26 美元。
选项B 计算错误,20×1 = 20;选项C 计算错误,20÷1.3 ≈ 15.38;选项D 计算错误,20×0.9 ≈ 18。
4. The value of 100 euros is equal to how many yen if the exchange rate is 1 euro to 130 yen?A. 13000B. 10000C. 12000D. 15000答案:A。
巴西的财政货币政策
巴西的财政货币政策江时学《拉丁美洲研究》2007年第3期2007年元旦,巴西总统卢拉宣誓就职。
在就职演说中,卢拉表示,他在第二任期内不会对目前的宏观经济政策作出重大调整。
他还表示,今后4年政府工作的重点之一是加快财政和货币政策领域的改革。
一巴西的财政管理体制目前巴西的财政体制可追溯到1964年军人当政后制定的一种以联邦政府、州政府和市政府为基础的三级管理体制。
迄今为止,这一财政体制共发生了以下三次较为重要的变化。
在军政府时期(1964~1985年),巴西财政体制的特点是联邦政府集权化和高税率。
此外,军政府还加大了地方政府向联邦政府进行财政转移的力度。
其结果是,联邦政府财政收入相当于GDP的比重从1960年的17%上升到1980年的26%。
军政府“还政于民”后的最初几年,文人政府基本上保留了军政府遗留下来的财政体制。
1988年,巴西颁布新宪法。
1该宪法规定:巴西的财政体制仍然分为联邦政府、州政府和市政府三级;三级政府都有各自的征税权,税率和税种由宪法或联邦法规确定;联邦政府征收的一部分税收应与州政府和市政府分享,州政府征收的一部分则应与市政府分享。
与过去相比,联邦政府的财政权限有所缩小。
根据1988年宪法和其他有关法律的规定,联邦政府征收的所得税和工业产品税进入一种特殊的基金。
州政府可分享其21%。
为了缩少巴西国内不同地区的差异,发展水平较低的北部、西北部和中西部可获得85%的税收,发展水平较高的南部和东南部可获得15%。
此外,这一分配机制还参考了各州人口的多寡。
根据1988年宪法和其他有关法律的规定,市政府可分享联邦税收的22.5%,州政府所在城市可获得其中的10%,其余部分按照各地区的发展水平和人口的多寡来分配。
1994年,巴西开始实施以控制通货膨胀为目标的“雷亚尔计划”。
为了使该计划取得成功,卡多佐政府还采取了一系列配套措施,其中包括:提高利率,以吸引足够的外资来扩充外汇储备和稳定汇率;加快实施贸易自由化,通过扩大进口商品的供给来降低国内商品的价格;压缩财政开支,努力实现财政平衡。
新高考八省最新名校联考试题汇编:专题05 语法填空 (原卷版)
专题05 语法填空新高考八省最新名校联考试题汇编距离高考还有一段时间,不少有经验的老师都会提醒考生,愈是临近高考,能否咬紧牙关、学会自我调节,态度是否主动积极,安排是否科学合理,能不能保持良好的心态、以饱满的情绪迎接挑战,其效果往往大不一样。
以下是本人从事10多年教学经验总结出的以下学习资料,希望可以帮助大家提高答题的正确率,希望对你有所帮助,有志者事竟成!养成良好的答题习惯,是决定高考英语成败的决定性因素之一。
做题前,要认真阅读题目要求、题干和选项,并对答案内容作出合理预测;答题时,切忌跟着感觉走,最好按照题目序号来做,不会的或存在疑问的,要做好标记,要善于发现,找到题目的题眼所在,规范答题,书写工整;答题完毕时,要认真检查,查漏补缺,纠正错误。
总之,在最后的复习阶段,学生们不要加大练习量。
在这个时候,学生要尽快找到适合自己的答题方式,最重要的是以平常心去面对考试。
英语最后的复习要树立信心,考试的时候遇到难题要想“别人也难”,遇到容易的则要想“细心审题”。
越到最后,考生越要回归基础,单词最好再梳理一遍,这样有利于提高阅读理解的效率。
另附高考复习方法和考前30天冲刺复习方法。
1.【广东省六校2023年高三联考】阅读下面短文,在空白处填入1个适当的单词或括号内单词的正确形式。
A Lifelong Journey, a historical drama which records China’s great transformation over 50 years,____36____ (earn) widespread applause, shattering records and becoming the most-watched TV series on State broadcaster China Media Group within the past five years. The TV series consisting of 58 episodes is ____37____ huge hit on TV and online, ____38____(adapt) from Liang Xiaosheng’s novel In the World. The novel ____39____(win) the writer Liang the 10th Mao Dun Literature Prize in 2019, one of China’s top literary awards. Millions of people have been touched by the family’s story, revealing and reacquainting readers with ____40____ lies deep in their hearts.The TV series paints a picture of ordinary Chinese people living in the changing times. ____41____(start) in the late 1960s, the story follows the ups and downs of three siblings from a worker’s family and explores the themes of family, friendship, and romance in a bittersweet story. What strikes a chord with viewers are its vividdetails bringing them back to old times. Many viewers describe the show____42____ a time machine to drift into the past, reflecting ____43____ we got here, the TV series also____44____(successful) gives viewers an insight into the lives of ordinary Chinese _____45_____ (citizen) who have turned a country in poverty into the world’s second-largest economy.2.【2023届福建省漳州高三第二次质量检测英语试题】阅读下面短文,在空白处填入1个适当的单词或括号内单词的正确形式。
- 1、下载文档前请自行甄别文档内容的完整性,平台不提供额外的编辑、内容补充、找答案等附加服务。
- 2、"仅部分预览"的文档,不可在线预览部分如存在完整性等问题,可反馈申请退款(可完整预览的文档不适用该条件!)。
- 3、如文档侵犯您的权益,请联系客服反馈,我们会尽快为您处理(人工客服工作时间:9:00-18:30)。
Us ing Ce ntral Bank
Obtains Import License using Pro-f orma inv oice
Importer has 180 day s to reciev e goods
Legal
f unds transf erred to exporter
START
Importer
exchange Euro/Dollar f or Real/Peso
Currency Exchanged using Parallel Market Rate South American Cambio/ Trav el Agent
Large Cambio
U.S. Money Serv ice Business
U.S. Bank
LEGAL IMPORTATION PROCEDURE IN BRAZIL
Le gal M e thod of Im porting goods to Brazil
• 2
Brazilian Importer
Le gal Trade in Brazil
Central Bank of Brazil Goods reciev ed by Importer
purchases a wire transf er f rom local bank in Brazil @ of f icial rate
goods shipped to importer
Illegal
Pay Duties 10%-100%
Finished MSB/Own acct. gets wire f rom Importer Importer reciev es goods MSB has a U.S. bank account in U.S. Dollar Adds more f unds v ia parallel
Obtains Import License using Pro-f orma Inv oice
Importer wire transf ers pay ment to exporter using of f icial channels
Importer pay s duties on goods to Brazilian Customs
Exporter ships goods to Importer
PARALLEL MARKET METHOD OF IMPORTATION IN BRAZIL
Typical Paralle l M ark e t M e thod of Im porting goods to Brazil
• 3
Central Bank of Brazil
• •
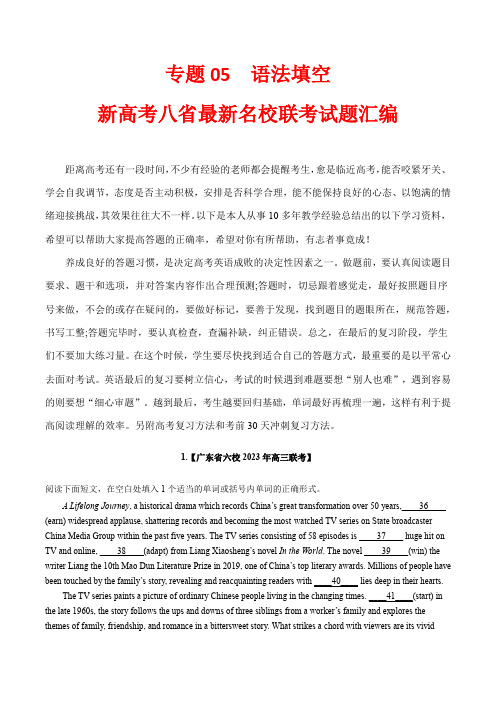
CURRENCY EXCHANGE INFORMAL MARKET IN BRAZIL
• 1
Curre ncy Exchange in the Paralle l M ark e t
Cash, Traveler's Checks, and Bank Checks
European/ US Tourists
TYPES OF ASSETS EXCHANGED BY BRAZILIAN DOLEIROS.
•
•1Leabharlann CASHMost strong currencies are exchanged in Brazil. The US Dollar is the # 1 sought after but European Euros are becoming a close 2nd. Japanese Yen, Swiss Francs and any other “Well Known” currency is exchangeable. On the bordering cities, the bordering countries currencies are also readily converted into any other.
•
•
2
TRAVELLERS’CHECKS
Don’t leave home without them. They are also widely accepted and exchanged all over the country.
• •
3
PERSONAL & CORPORATE CHECKS (INCLUDING PENSION CHECKS |US & Foreign| - SOCIAL SECURITY/IRS, ETC) Usually exchanged by expatriates, retirees and foreign workers, corporations, Brazilians with foreign accounts, consulates and embassies (Including the US). These drafts are only exchanged after the Doleiro knows his customer or if it bears another Doleiro guarantee (usually a stamp on the back of the document). Remember the 70’s smurfs? 4 WIRE TRANSFERS Bought and sold by Doleiros and their clients. The actual strong currency never gets to Brazil. It stays within the banking system abroad. Sources for wire transactions are the checks and tc’s acquired abroad, local msb’s remittances to Brazil and foreign commercial and parked worldwide funds by persons and corporations that do business or live in Brazil.