LAPW frozen-phonon calculation, shell model lattice dynamics and specific-heat measurement
掺杂维度和浓度调控的δ掺杂的La:SrTiO_(3)超晶格结构金属-绝缘体转变
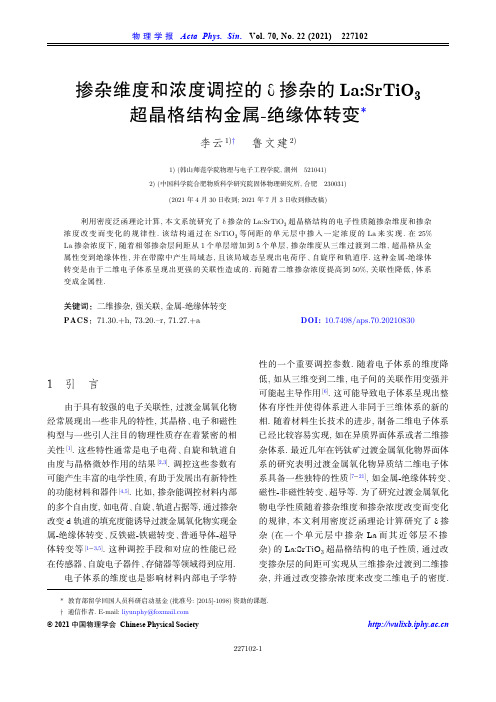
掺杂维度和浓度调控的d掺杂的La:SrTiO3超晶格结构金属-绝缘体转变*李云1)† 鲁文建2)1) (韩山师范学院物理与电子工程学院, 潮州 521041)2) (中国科学院合肥物质科学研究院固体物理研究所, 合肥 230031)(2021 年4 月30日收到; 2021 年7 月3日收到修改稿)利用密度泛函理论计算, 本文系统研究了d掺杂的La:SrTiO3超晶格结构的电子性质随掺杂维度和掺杂浓度改变而变化的规律性. 该结构通过在SrTiO3等间距的单元层中掺入一定浓度的La来实现. 在25% La掺杂浓度下, 随着相邻掺杂层间距从1个单层增加到5个单层, 掺杂维度从三维过渡到二维, 超晶格从金属性变到绝缘体性, 并在带隙中产生局域态, 且该局域态呈现出电荷序、自旋序和轨道序. 这种金属-绝缘体转变是由于二维电子体系呈现出更强的关联性造成的. 而随着二维掺杂浓度提高到50%, 关联性降低, 体系变成金属性.关键词:二维掺杂, 强关联, 金属-绝缘体转变PACS:71.30.+h, 73.20.–r, 71.27.+a DOI: 10.7498/aps.70.202108301 引 言由于具有较强的电子关联性, 过渡金属氧化物经常展现出一些非凡的特性, 其晶格、电子和磁性构型与一些引人注目的物理性质存在着紧密的相关性[1]. 这些特性通常是电子电荷、自旋和轨道自由度与晶格微妙作用的结果[2,3]. 调控这些参数有可能产生丰富的电学性质, 有助于发展出有新特性的功能材料和器件[4,5]. 比如, 掺杂能调控材料内部的多个自由度, 如电荷、自旋、轨道占据等, 通过掺杂改变d轨道的填充度能诱导过渡金属氧化物实现金属-绝缘体转变、反铁磁-铁磁转变、普通导体-超导体转变等[1−3,5]. 这种调控手段和对应的性能已经在传感器、自旋电子器件、存储器等领域得到应用.电子体系的维度也是影响材料内部电子学特性的一个重要调控参数. 随着电子体系的维度降低, 如从三维变到二维, 电子间的关联作用变强并可能起主导作用[6]. 这可能导致电子体系呈现出整体有序性并使得体系进入非同于三维体系的新的相. 随着材料生长技术的进步, 制备二维电子体系已经比较容易实现, 如在异质界面体系或者二维掺杂体系. 最近几年在钙钛矿过渡金属氧化物界面体系的研究表明过渡金属氧化物异质结二维电子体系具备一些独特的性质[7−21], 如金属-绝缘体转变、磁性-非磁性转变、超导等. 为了研究过渡金属氧化物电学性质随着掺杂维度和掺杂浓度改变而变化的规律, 本文利用密度泛函理论计算研究了d掺杂(在一个单元层中掺杂La而其近邻层不掺杂)的La:SrTiO3超晶格结构的电子性质, 通过改变掺杂层的间距可实现从三维掺杂过渡到二维掺杂, 并通过改变掺杂浓度来改变二维电子的密度.* 教育部留学回国人员科研启动基金(批准号: [2015]-1098)资助的课题.† 通信作者. E-mail: liyunphy@© 2021 中国物理学会 Chinese Physical Society 计算结果表明, 调节这些参数可改变电子关联强度进而实现体系的金属-绝缘体转变.2 计算方法计算由VASP 程序包执行[22], 其中采用PBE 型广义梯度近似泛函(PBE-GGA)[23]和投影缀加平面波方法[24,25], 平面波截断动能为500 eV. Ti 3d 轨道局域性较强, 轨道中电子的在位库伦相互作用较强, 计算中采用Dudarev 的LSDA+U 方法近似描述[26]. 计算中Ti 3d 轨道电子的在位库伦相互作用能分别取U =0, 2.0, 3.0, 3.5, 3.7, 4.4, 5.0 eV 等数值, 将不同数值得到的基态电子态与实验测得的电子性质对比进而确定出合适的U 值. 图1展示了两种超晶格原胞结构, 即[Sr 0.75La 0.25TiO 3]1|[SrTiO 3]n (n = 1, 5)(简写为[SLTO]1|[STO]n ), 其中掺杂层中25%的Sr 原子被La 原子替代, 沿着[001]方向周期性重复, 面内周期为4 × 4. 相应地,采用4 × 4 × 4和4 × 4 × 2的Monkhost 型k 点网格在布里渊区中取样. 有限温度展宽采用Gaussian 方法, 其中s = 0.1 eV. 计算中所有原子都充分弛豫, 直到受力小于0.01 eV/Å.(a)(b)(c)图 1 (a) 超晶格结构面内4 × 4周期俯视图; (b) [SLTO]1|[STO]1侧视图; (c) [SLTO]1|[STO]5侧视图. 绿色球代表Sr 原子, 蓝色代表La 原子, 红色代表O 原子, Ti 原子在八面体中心Fig. 1. (a) Top view of the superlattices with in-plane 4 × 4unit cells; (b) side view of [SLTO]1|[STO]1; (c) side view of [SLTO]1|[STO]5. Green balls represent Sr atom, blue balls La atom, red balls O atom, Ti atoms are at the centre ofthe octahedrons.3 结果和讨论SrTiO 3导带底部态主要由Ti 3dt 2g (d xy , d yz ,d xz ) 轨道构成, 掺杂La 的价电子轨道5d6s 能级高于SrTiO 3中的Ti 3dt 2g 轨道能级, La 掺杂产生的电子全部进入Ti 3dt 2g 轨道能级. 计算中Ti 3d 轨道在位库伦相互作用能U 为可调参数, 本文通过比较计算结果与实验结果来确定U 的最佳数值.图2展示了两种典型的U 计算的结果. 如图2(a)和图2(b)所示, 在U = 2 eV 情况下, 费米能级穿过导带下部, 两种结构都为金属态. 在U = 3.7 eV 情况下, 如图2(c)和图2(d)所示, [SLTO]1|[STO]1仍然为金属态, 而[SLTO]1|[STO]5为绝缘态, 费米能级穿过带隙, 且在带隙里出现局域态. 计算表明当U < 3.5 eV 时两种体系都是金属态, 而当U ≥ 3.5 eV 时[SLTO]1|[STO]5才会展现为绝缘态基态. 实验中观察到[SLTO]1|[STO]1呈现金属性,而[SLTO]1|[STO]5的电阻温度曲线为绝缘态且光电导检测表明带隙内存在局域态. 又考虑了50%La 掺杂结果和带隙宽度等因素后, 确定在上述超晶格体系中U = 3.7 eV 的计算结果与实验结果吻合最好.为了澄清[SLTO]1|[STO]5带隙内局域态的性质, 图3(a)和图3(b)详细地展示了其能带结构和局域态对应的空间电荷分布. 带隙内的局域态出现在掺杂的SrO 层两侧的TiO 2层内, 掺杂电子局域在Ti 原子的3dt 2g 轨道内, 则这部分有局域电子占据的Ti 原子呈现+3价, 其他Ti 原子呈现+4价. 计算表明Ti 3+—O 键长大于Ti 4+—O 键长, 由于外延生长限制xy 面内的晶格常数, 这导致掺杂层的TiO 6八面体受到了xy 面内的压缩应力, 使得原来简并的d xy , d yz , d xz 三个轨道劈裂, 最终d xy 轨道略高于d xz 和d yz 轨道, 因而电子优先占据d xz 和d yz 轨道. 如图3(b)所示, 在掺杂SrO 层一侧掺杂电子分布在Ti d xz 轨道, 而在另一侧则分布在d yz 轨道. 通过对多种自旋构型的计算比较, 结果表明图3(b)所示的反铁磁自旋序具备更低的能量. 图3(c)展示了局域态所在的Ti 3+与近邻的6个O 原子的键长, 沿着y , z 方向键长明显大于x 方向, 这与电子占据Ti d xz 和d yz 轨道相吻合. 计算结果还表明Ti 3+与近邻的O 原子的键长也明显大于Ti 4+与近邻的O 原子的键长.从体掺杂的角度看, [SLTO]1|[STO]5结构中La 离子平均体密度为4.17%, 而[SLTO]1|[STO]1结构中La 离子平均体密度为12.5%, 似乎La 离子的体密度与上述金属绝缘体转变有关. 而Tokura等[27]和Okuda 等[28]的实验结果表明在STO 内La 离子体掺杂密度在1.5%—92%区间内体系都呈现金属态. 由此可知, 在STO 中均匀掺杂4.17%的La 会导致金属态. 而d 掺杂的[SLTO]1|[STO]5超晶格结构中La 离子平均体密度同为4.17%, 却呈现绝缘体性, 这意味着掺杂维度变化是导致上述金属绝缘体转变的决定因素. 图4展示了三维掺杂和二维掺杂情况下杂质离子层在空间中产生的电势分布示意图. 在[SLTO]1|[STO]1掺杂情况下,如图4(a), 相邻的杂质离子层较近, 其吸引势相互D O S(a1)-4-20Energy/eV24 /e V(a2)3210-1/e V(c2)3210-1D O S(c1)-4-20Energy/eV24 /e V(d2)3210-1/e V(b2)3210-1D O S(b1)-4-20Energy/eV24D O S(d1)-4-20Energy/eV24图 2 分自旋总态密度图和能带图 (a1), (a2) U = 2 eV, [SLTO]1|[STO]1; (b1), (b2) U = 2 eV, [SLTO]1|[STO]5; (c1), (c2) U =3.7 eV, [SLTO]1|[STO]1; (d1), (d2) U = 3.7 eV, [SLTO]1|[STO]5, 红色箭头所指为带隙内局域态. 图中红线为费米能级, 价带顶部设为能量零点. 态密度图中水平线上部为上自旋态密度, 下部为下自旋态密度Fig. 2. Spin-polarized total densities of states and band structures: (a1), (a2) U = 2 eV, [SLTO]1|[STO]1; (b1), (b2) U = 2 eV,[SLTO]1|[STO]5; (c1), (c2) U = 3.7 eV, [SLTO]1|[STO]1; (d1), (d2) U = 3.7 eV, [SLTO]1|[STO]5, the in-gap localized states are pointed out by the red arrow. The red lines are Fermi level, the top of valence band is set to be zero.dddd(b)(c)Ti 3+Ti 3+2.012.082.022.07Ti 4+Ti 3+2.062.07Ti 4+-11/e Vdfd 23图 3 (a) [SLTO]1|[STO]5能带结构图, 其中带隙内局域态为Ti d xz 和d yz 轨道态. 水平红色虚线为费米能级; (b) [SLTO]1|[STO]5带隙内局域态电荷空间分布, 局域态为Ti d xz 和d yz 轨道态, 上下箭头代表自旋方向; (c)掺杂层局部结构和Ti 3+O 6八面体键长, 沿着y 和z 方向Ti 3+—O 键较长Fig. 3. (a) Band structure of [SLTO]1|[STO]5, in which the in-gap states mainly consist of Ti d xz and d yz orbitals; (b) charge distri-bution of the in-gap states, the charge is mainly localized at Ti d xz and d yz orbitals. The arrows represent spin directions; (c) local structure of the doped layer and bond lengths of Ti 3+—O bonds of the Ti 3+O 6 octehedron.重叠较大, 最终在空间产生较为平缓的势. 而在[SLTO]1|[STO]5掺杂情况下, 如图4(b)所示, 相邻的杂质离子层较远, 其吸引势重叠小, 最终在掺杂层形成势阱, 该势阱束缚了电子在垂直掺杂面方向的运动, 结果电子只能在掺杂层内运动. 通常,电子系统的能量取决于电子在邻近格点间跳跃的动能和电子间排斥势能的总和, 关联性强弱大致取决于电子间排斥势能与电子动能的比值, 比值越大则关联性越强. 相比三维掺杂, 二维掺杂情况下电子在杂质离子层的势阱中运动, 在垂直方向运动受限制, 允许电子跳跃的近邻格点变少, 总动能变小,电子运动关联性变强. 二维体系情况下, 若体系呈现金属态, 即电子可在近邻格点巡游, 则动能较低,但存在两个电子同时占据同一个Ti 原子3d 轨道的几率, 由于Ti 3d 轨道上存在较大的在位库伦排斥能, 这会导致较大的电子间排斥势能, 体系的总能量可能因此更高. 若体系呈现绝缘态, 带隙内局域态电子不能在近邻格点巡游, 则动能较大, 但避免了两个电子同时占据同一个Ti 原子3d 轨道引起的较大的在位库伦排斥能, 这降低了电子间排斥势能, 体系的总能量可能因此更低. 这意味着在同样的在位库伦排斥能情况下, 相比三维电子体系,二维电子体系具有更小的动能, 即更强的关联性,更容易变为绝缘态. 上述计算中得到的SrTiO 3中层状25% La 掺杂导致的金属-绝缘体转变正是电子维度降低导致关联性增强的一个实例.此外, 二维电子的密度也影响着体系关联性.从平均场的角度看, 二维电子体系的电子间排斥势能正比于n 1/2(n 为二维电子密度), 动能正比与n ,则电子间排斥势能与动能比值约为n –1/2[29]. 这意味随着二维掺杂浓度的提高, 关联性会变弱, 体系有可能从绝缘态变为金属态. 实验研究[16]和本文的计算都验证了这一点, 图5所示的态密度和能带结构表明当二维La 掺杂的掺杂浓度为50%时上述超晶格结构呈现金属态.D O S(a)-4-20Energy/eV24 /e V(b)3210-1图 5 50% La 掺杂的[SLTO]1|[STO]5总态密度图(a)和能带结构图(b), 红线为费米能级Fig. 5. Total density of states (a) and band structure (b) of [SLTO]1|[STO]5 with 50% La doping in the doping layer.4 结 论本文利用第一性原理计算研究了d 掺杂的La:SrTiO 3中掺杂维度和浓度变化引起的金属绝缘体转变. 在La 掺杂浓度为25%情况下, 随着掺杂层间隔增加, 即掺杂维度从三维过渡到二维, 体系从金属态过渡到绝缘体态. 二维掺杂在SrTiO 3带隙内产生了局域态, 并且局域态呈现出一定的电荷序、反铁磁自旋序和轨道序. 分析表明, 局域态的电子是由二维体系情况下关联性增强引起的. 此外, 二维掺杂的电子密度也影响着体系的状态, 在二维La 掺杂的结构中掺杂浓度为50%时, 体系又呈现金属态. 本文的研究结果加深了对于过渡金属氧化物中电子关联性与其维度和浓度关系的认识,有助于利用维度和浓度调控过渡金属氧化物电子器件的性能.S r 0.75L a 0.25OT i O 2S rO(a)S r 0.75L a 0.25OT i O 2S rO(b)图 4 掺杂离子层的电势V 和掺杂电荷r 分布示意图 (a) [SLTO]1|[STO]1, 虚线代表单个掺杂层阳离子产生的吸引势, 实线代表相邻掺杂层阳离子吸引势叠加后总的吸引; (b) [SLTO]1|[STO]5Fig. 4. Diagrams of electric potential V and charge distribution: (a) [SLTO]1|[STO]1, dashed lines present the potential produced by a single impurity layer, the solid lines present the total potential of all impurity layers; (b) [SLTO]1|[STO]5.参考文献I mada M, Fujimori A, Tokura Y 1998 Rev. Mod. Phys. 701039[1]D agottoE 2005 Science 309 257[2]T okura Y, Nagaosa N 2000 Science 288 462[3]A hn C H, Triscone J M, Mannhart J 2003 Nature 424 1015[4]M annhart J, Schlom D G 2010 Science 327 1607[5]C amjayi A, Haule K, Dobrosavljević V, Kotliar G 2008 Nat.Phys. 4 932[6]B oris A V, Matiks Y, Benckiser E, et al. 2011 Science 332 937[7]O htomo A, Muller D A, Grazul J L, et al. 2002 Nature 419 378[8]O htomo A, Hwang H Y 2004 Nature 427 423[9]R eyren N, Thiel S, Caviglia A D, et al. 2007 Science 317 1196[10]C aviglia A D, Gariglio S, Reyren N, et al. 2008 Nature 456624[11]L i L, Richter C, Mannhart J, Ashoori R C 2011 Nat. Phys. 7 762[12]B rinkman A, Huijben M, Van Zalk M, et al. 2007 Nat. Mater.6 493[13]A riando, Wang X, Baskaran G, et al. 2011 Nat. Commun. 2188[14]W ang Z, Okude M, Saito M, et al. 2010 Nat. Commum. 1 106 [15]C hoi W S, Lee S, Cooper V R, et al. 2012 Nano Lett. 12 4590[16]K ornblum L 2019 Adv. Mater. Interfaces 6 1900480[17]N iu W, Wang X F, Xu Y B, Zhang R 2021 ACS Appl.Electron. Mater. 3 128[18]M ardegan J R L, Christensen D V, Chen Y Z, et al. 2019 Phys. Rev. B 99 134423[19]S ong Q, Yu T L, Lou X, et al. 2019 Nat. Commum. 10 758[20]C hen J K, Mao W, Gao L, et al. 2019 Adv. Mater. 321905060[21]K resse G, Furthmüller J 1996 Phys. Rev. B 54 11169[22]P erdew J P, Burke K, Ernzerhof M 1996 Phys. Rev. Lett. 77 3865[23]B löchl P E 1994 Phys. Rev. B 50 17953[24]K resse G, Joubert D 1999 Phys. Rev. B 59 1758[25]D udarev S L, Botton G A, Savrasov S Y, et al. 1998 Phys.Rev. B 57 1505[26]T okura Y, Taguchi Y, Okada Y, Fujishima Y, Iye Y 1993 Phys. Rev. Lett. 70 2126[27]O kuda T, Nakanishi K, Miyasaka S, Tokura Y 2001 Phys.Rev. B 63 113104[28]B ruus H, Flensberg K 2004 Many-body Quantum Theory inCondensed Matter Physics - An Introduction (New York: Oxford University Press) p41[29]Tuning metal-insulator transition in d-doped La:SrTiO3 superlattice by varying doping dimensionality andconcentration*Li Yun 1)† Lu Wen -Jian 2)1) (School of Physics and Electronic Engineering, Hanshan Normal University, Chaozhou 521041, China)2) (Institute of Solid State Physics, HFIPS, Chinese Academy of Sciences, Hefei 230031, China)( Received 30 April 2021; revised manuscript received 3 July 2021 )AbstractElectronic properties in d-doped La:SrTiO3 superlattices varying with the doping dimensionality and concentration are systematically studied through using first-principles calculation. The superlattices consist of periodically repeated La-doped single SrTiO3 layers in SrTiO3 film, and the doping dimensionality can be tuned by varying the space of the neighboring doped layers. At 25% doping concentration, the spacing between SrTiO3 layers increases from 1 unit-cell layer to 5 unit-cell layers, i.e. the doping dimensionality changes three dimensions to two dimensions, the superlattice charater changes from metallic character into insulating character, and the charge sequence, spin sequence and orbital sequence are present in a localized state. This metal-insulator transition is ascribed to the stronger correlation effect in the two-dimensional electron system. With the two-dimensional doping concentration increasing to 50%, the correlation effect becomes weak and the system becomes metallic.Keywords: two dimensional doping, strong correlation effect, metal-insulator transitionPACS: 71.30.+h, 73.20.–r, 71.27.+a DOI: 10.7498/aps.70.20210830* Project supported by the Scientific Research Staring Foundation for the Returned Overseas Chinese Scholars, Ministry of Education of China (Grant No. [2015]-1098).† Corresponding author. E-mail: liyunphy@。
材料设计—25-密度泛函理论-基组-缀加平面波和PAW

ik r l
* ' i Ylm (k ) jl (k ) / Rl ( E , )
最后,只要把上面的alm的表达式带入 APW的基函数就可以得到最后的基组形式:
almYlm ( ) Rl ( E , ) ( ) l 0 ml e ik
体现在基函数上,就是在Muffin-tin球内 给APW基函数增加一项对能量求导的项,使得 径向薛定谔方程的解不再是能量本征值的函数 ,而是某一个带选定的能量参数,这就是线性 缀加平面波方法(LAPW)。
径向波函数的在能量E0展开形式:
(E) Rl ( E ) Rl ( E ) R l
M
K
0
M
K
M
K
PAW结合了PP和FLAPW方法 PAW具有FLAPW的精度,芯电子被冻结, 但能够得到真正的价电子波函数,这个对磁 性和光学性质有重要意义。 PAW采用平面波很展开,具有和USPP类似 的效率。程序结构也可以和PP的程序类似 。
PAW是一种全电子的方法!
常见的使用PAW方法的程序:
V (r ) (r R m ) V (r ) (r R m ) 0
Muffin-tin势的选取可有不同的方法。位于原点 的原子产生的势场在该Muffin-tin球中贡献最大, 然后还有周围最近邻原子对该球空间的贡献,然 后还有次近邻及更远的原子的贡献,当然贡献是 逐渐减弱的。 L. F. Mattheiss提出中心原子势场上叠加上周 围原子势场在以该中心原子为原点的球谐函数展 开项,如果只取首项,那么就是球形近似;如果 取更多的展开项,那么就不再有任何形状近似。
在多了一个R的导数项后,自然多了一个待 定系数blm,我们可以采用基函数在球面上连续 以及导数也连续的条件确定这两个系数:
单晶硅超精密加工的分子动力学仿真研究进展

层、 恒温原子层 和 牛 顿 原 子 层。 边 界 区 的 原 子 被 固 定在各自位置上, 晶格振动被忽略, 以减少边界效应 和保证晶格结构 的 对 称 性; 恒温区的原子需要被标 定, 以保持该区域温度的恒定; 牛顿区的原子服从牛 刀具的原子也被分为三层。 顿第二定律。在图 % 中,
[&] (’) ()*+,-- 势能函数
>
引言
述, 该系统既可 以 是 少 体 系 统, 也 可 以 是 多 体 系 统。 该方法的基本原理是: 建立一个粒子系统, 对所研究 的微观现象进行 仿 真, 系统中各粒子之间的相互作 用根据量子力学来确定。对于符合经典牛顿力学规 律的大量粒子系 统, 通过粒子运动学方程组的数值 求解, 得出粒子在相空间的运动规律和轨迹, 然后按 照统 计 物 理 原 理 得 出 该 系 统 相 应 的 宏 观 物 理 特
图! 微切削的分子动力学模型
用的存储量少得多, 因此被广泛使用。改进的 I’%F’J 算法为
, & ," 6 3 2 & , " 6 27 " 6
超精密加工仿真时, 首先必须确定合理的势能函数。 目前的分子动力学仿真一般采用经验势函数。经验 势函数可分为 ! 体、 " 体和多体势函 数。 ! 体 势 函 数 包括 #$%&’ 势 函 数、 ($%)*#+,’% 势 函 数 和 -’))+%.* 单晶铝和 /$)’& 势函数。 ! 体 势 函 数 适 用 于 单 晶 铜、 锗等金属材料。 " 体和多 体 势 函 数 则 考 虑 了 具 有 共 价键的晶体结构和晶格方向, 适用于硅、 碳及金刚石 等材料。硅原子 之 间 是 以 共 价 键 结 合 在 一 起 的, 在 仿真中应采用 0’%&$11 势函数, 其函数形式为
高温对含氢DLC_涂层的微观结构及力学性能的影响
表面技术第53卷第5期高温对含氢DLC涂层的微观结构及力学性能的影响贾伟飞1,梁灿棉2,胡锋1,2*(1.武汉科技大学 高性能钢铁材料及其应用省部共建协同创新中心,武汉 430081;2.广东星联精密机械有限公司,广东 佛山 528251)摘要:目的针对含氢DLC涂层热稳定性很差的问题,探究高温下含氢DLC涂层的微观组织变化特征,以及高温对其力学性能的影响。
方法采用等离子体强化化学气相沉积(Plasma Enhanced Chemical Vapor Deposition, PECVD)在S136模具不锈钢表面沉积以Si为过渡层的含氢DLC复合涂层,利用光学显微镜、扫描电镜、拉曼光谱、X射线电子衍射仪、三维轮廓仪研究DLC涂层的微观结构,采用划痕测试仪、往复式摩擦磨损试验机、纳米压痕仪研究DLC涂层的力学性能,并通过LAMMPS软件,利用液相淬火法建立含氢DLC模型,模拟分析经高温处理后涂层的组织变化特征和纳米压痕行为。
结果在400 ℃、2 h的退火条件下,拉曼谱峰强度I D/I G由未退火的0.7增至1.5,涂层发生了石墨化转变,同时基线斜率下降,H元素析出;XPS结果表明,在此条件下涂层中sp2杂化组织相对增加,氧元素增多,涂层粗糙度增大;在600 ℃、2 h退火条件下,DLC发生了严重氧化,LAMMPS模拟结果表明,在400 ℃高温下涂层的分子键长变短,表明sp3杂化组织在高温下吸收能量,并向sp2杂化转变。
纳米压痕模拟结果显示,在400 ℃下退火后,涂层的硬度下降。
结论在400 ℃下退火处理后,涂层中的H元素释放,涂层内应力减小,保证了涂层的强度;在600 ℃退火条件下,过渡层的Si和DLC在高温下形成了C—Si键,使得DLC薄膜部分被保留;LAMMPS 模拟结果表明,在高温下涂层发生了石墨化转变,涂层的硬度减小。
关键词:含氢DLC涂层;退火处理;微观组织;力学性能;LAMMPS模拟中图分类号:TB332 文献标志码:A 文章编号:1001-3660(2024)05-0174-10DOI:10.16490/ki.issn.1001-3660.2024.05.018Effect of High-temperature on Microstructure and MechanicalProperties of Hydrogen-containing DLC CoatingJIA Weifei1, LIANG Canmian2, HU Feng1,2*(1. Collaborative Innovation Center for Advanced Steels, Wuhan University of Science and Technology, Wuhan 430081,China; 2. Guangdong Xinglian Precision Machinery Co., Ltd., Guangdong Foshan 528251, China)ABSTRACT: The thermal stability of hydrogen-containing DLC coating is poor, and the work aims to explore the microstructure changes of hydrogen-containing DLC coating at high temperature and their impact on mechanical properties. The收稿日期:2023-01-09;修订日期:2023-05-18Received:2023-01-09;Revised:2023-05-18基金项目:中国博士后科学基金(2021M700875)Fund:China Postdoctoral Science Foundation (2021M700875)引文格式:贾伟飞, 梁灿棉, 胡锋. 高温对含氢DLC涂层的微观结构及力学性能的影响[J]. 表面技术, 2024, 53(5): 174-183.JIA Weifei, LIANG Canmian, HU Feng. Effect of High-temperature on Microstructure and Mechanical Properties of Hydrogen-containing DLC Coating[J]. Surface Technology, 2024, 53(5): 174-183.*通信作者(Corresponding author)第53卷第5期贾伟飞,等:高温对含氢DLC涂层的微观结构及力学性能的影响·175·hydrogen-containing DLC composite coating with Si as the transitional layer was deposited on the surface of S136 stainless steel by plasma enhanced chemical vapor deposition (PECVD). The microstructure of DLC coating was investigated by optical/scanning electron microscopy, Raman spectroscopy, XPS (X-ray photoelectron spectroscopy) and three-dimensional profiler, the mechanical properties of DLC coating were studied by scratch, reciprocating friction wear and nano-indentation experiment, and the nano-indentation experiment behavior of DLC coating was simulated by LAMMPS to analyze the microstructure characteristics in annealing. The coating was subject to annealing conditions of 400 ℃for 2 hours and 600 ℃for 2 hours. Under the former condition, Raman spectroscopy showed an increase in the intensity ratio of the I D/I G peaks from0.7 to 1.5, indicating graphitization transition, accompanied by a decrease in baseline slope and H element segregation. XPSanalysis revealed an increase in sp2 hybridization and oxygen content in the coating under this condition, as well as an increase in surface roughness. At 600 ℃, severe oxidation of the DLC coating was observed. Under that condition, the matrix stainless steel was also oxidized. Molecular dynamics simulations using LAMMPS suggested a decrease in molecular bond length at 400 ℃high temperature. The three-dimensional profile test showed that the roughness under the unannealed condition was mainly from the large particles produced during deposition. At 400 for 2℃h, the coating had the minimum surface roughness. At this time, some large particles in the coating structure fell off, and the coating was basically completely damaged at 600 for℃ 2 h. The roughness was mainly from the original stainless steel roughness. The scratch test showed that under the condition of 400 for℃2 h, due to the release of the internal stress of the coating and the tighter bonding of the transition layer, the coating had the bestbonding effect with the substrate and was the least likely to fall off. The statistical results of LAMMPS simulation showed that the chemical bonds of the original DLC model tended to become shorter after annealing at high temperature. Relative to the unannealed DLC coating, the mechanical properties of DLC coating were best under 400 for℃ 2 h. Under this condition, the precipitation of mixed H elements in the coating led to the transformation of the original C—H sp3 structure, which occupied a large space to the smaller C—C sp3 and C—C sp2 structure, releasing internal stress in the coating, while ensuring the strength.The nano-indentation experiments showed that the elastic recovery and hardness of the coating were the highest at 400 for℃ 2 h, compared with that at other annealing temperature. The structure of the DLC coating containing hydrogen changed due to the precipitation of H element at 400 ℃. On the one hand, the coating structure changed from sp3 to sp2 due to high temperature, and on the other hand, the precipitation of H element changed the original C—H sp3 to C—C sp3, reducing the internal stress of the coating and improving the mechanical properties. The coating is basically damaged at 600 for 2 h, but the substrate still℃retains part of the coating. This is because the transition layer Si reacts with the coating to improve the heat resistance of the remaining coating. Molecular dynamics simulations using LAMMPS showed that the coating undergoes a graphitization transition at high temperature, leading to a reduction in its hardness.KEY WORDS: hydrogen-containing DLC coating; annealing treatment; microstructure; mechanical properties; LAMMPS simulationDLC(Diamond-Like Carbon,类金刚石碳,简称DLC)涂层材料具有超高硬度、低摩擦因数、优良化学稳定性等特点,广泛应用于机械、电子、生物医学等领域[1-3]。
LJ势氩系统分子动力学模拟中截断半径的选择
过程工程学报The Chinese Journal of Process Engineering第21卷第3期2021年3月Vol.21 No.3Mar. 2021.-------1流动与传递匸DOI: 10.12034/j.issn.l 009-606X.220107¢35-Application of cutoff distance selection in molecular dynamicssimulation of LJ argon systemChenyang SUN 1'2, Chaofeng HOU 1*, Wei GE 1-21. Institute of Process Engineering, Chinese Academy of Sciences, Beijing 100190, China2. School of Chemical Engineering, University of Chinese Academy of Sciences, Beijing 100049, ChinaAbstract: In Lennard-Jones (LJ)potential argon system investigated bymolecular dynamics simulation, thedifferent cutoff distances are frequentlyapplied to calculate the interactive force between atoms, and some reports havegiven out the influence of the cutoffdistances on the simulation systems.More and more calculations suggest to use 4.5 cr or even larger truncationdistances (a is the diameter of argon atom) to obtain the more accurate thermodynamic properties of the1.0 1.10.9TemperatureMapping between thermodynamic states under different r c .sctu od o E o le -I o c I-1.5-2.0-2.5-3.0-3.5-4.0-4.5Lennard-Jones potentialc w.u-gp u n ju o u n q'E-.sp e y0;8 '="a u o 3o l n eComparison of system properties under different r c .systems. In this work, a simple method was proposed to solve the problem of superheating encountered in the calculation of melting point by direct heating, where an independent track and ensemble at each temperature point are run. And then, the effect of different cutoff distances on the phase diagrams of the melting and boiling points of argonsystem in the NPT ensemble was studied. The melting point was in good agreement with the experimental and theoretically calculated values when the cutoff d istance of 2.5crwas used. However, the deviation from the experimentalmelting point became more evident when the larger cutoff distances were employed. In order to find out the underlying mechanism behind the deviation, the radial distribution functions and velocity autocorrelation function at the meltingpoints and different thermodynamic states of the liquid argon with different cutoff distances were analyzed. It wasfound that the same thermodynamic properties can be obtained at the corresponding thermodynamic state points underdifferent truncation distances. The mapping between the different thermodynamic state points was understandable dueto the different thermodynamic states at the same temperatures under the varied truncation distances, and was beneficial to significantly reduce the computational workload at the smaller cutoff distance. This work proposed an exploratoryway for the selection of the cutoff distance in the simulation of liquid argon, where the truncation distance of 2.5 cr canmeet the requirements of computational accuracy and performance in the simulations.Key words: molecular dynamics simulation; LJ potential; cutoff distance; liquid argon收稿:2020-03-27.修回:2020-05-10,网络发表:2020-05-25, Received: 2020-03-27, Revised: 2020-05-10, Published online: 2020-05-25基金项目:国家自然科学基金(编号:21776280; 91834303; 91934302);中国科学院资助项目(编号:XDC01040100; QYZDJ-SSW-JSC029);北京市自然科学基金委员会■■北京市教育委员会联合资助项目(编号:KZ201910017019);多相复杂系统国家重点实验室自主研究课题(编号:MPCS-2019-A-10)作者简介:孙晨阳(1993-),男,山东省滨州市人,硕士研究生,化学工程专业,E-mail: *************.cn :侯超峰,通讯联系人,E-mail:************.cn .引用格式:孙晨阳,侯超峰,葛蔚.LJ 势氮系统分子动力学模拟中截断半径的选择.过程工程学报,2021,213:259-264.Sun C Y, Hou C F, Ge W. Application of c utoff distance selection in molecular dynamics simulation of LJ argon system (in Chinese). Chin. J. Process Eng., 2021, 21(3): 259-264, DOI: 10.12034/j.issn. 1009-606X.220107.260过程工程学报第21卷LJ势氮系统分子动力学模拟中截断半径的选择孙晨阳12,侯超峰",葛蔚121.中国科学院过程工程研究所,北京1001902.中国科学院大学化学工程学院,北京100049摘要:近年来在分子动力学方法研究LJ(Lennard-Jones)势氨系统时,越来越多的计算建议釆用4.5cr甚至更大的截断半径为氨原子直径)。
【豆丁推荐】-》一种基于第一性原理的4H_SiC结构缺陷计算模型
0.引言SiC 材料具有宽禁带、高临界击穿电场、高饱和电子漂移速度和高的热导率等各种优秀特性。
目前,SiC 外延生长技术的主要问题是外延层中高密度的缺陷。
主要包括螺旋位错(TSDS)、刃型位错(TEDS)和基面位错(BPDS)等,其密度分别为104,104~105,104~105cm -2[1]。
在4H-SiC 外延生长工艺中,衬底上的基面位错能够转化成外延层中的刃型位错。
这种转化降低了外延层中基面位错的密度,也就减小了外延层中缺陷对SiC 器件的损害。
通过对基面位错的模拟,可以计算位错的密度和分布,态密度,能带结构,基面位错的转化等[2]。
将结构缺陷模拟应用于PIN 二极管的优化,在实验无法勘察位错外貌和结构,或者研究自然条件下很难出现位错的界面时,用计算机模拟位错可以为位错研究提供依据。
基于计算模拟,人们对碳化硅材料特性进行了广泛的研究。
1986年Bacon ,Liang 等人采用Linnard-Jones 势模拟了多种六角密集结构的金属位错结构;1994年MeijieTang [3]等通过修正Tersoff 势函数,延长粒子之间作用的范围,对晶体SiC 材料的力学性质进行了模拟。
Chang K J [4]等,利用abinitio 分子动力学模拟对SiC 的结构、电子云密度进行了模拟。
目前对于4H-SiC 位错的模拟还很少,它的结构及模型还待于探索和研究。
本文主要介绍了一种4H-SiC 结构位错模型及计算模拟过程中的主要技术细节。
1.4H-SiC 的计算模拟基本模拟过程是在一定系统及已知分子势能函数下,从计算分子间作用力着手,求解牛顿运动方程,来计算作用在原子集团上每个原子的力[5]。
准确确定位错芯原子组态的合理方法是采用半离散模型,即把晶体划分为两个区域:靠近位错芯(包含位错芯)的区域I ,在次以外的区域为区域II 。
在区域I 中引入一缺陷,此时要根据弹性理论所预计的位移来改变原子坐标,然后原子同时弛豫,通过反复迭代方程,使系统中每个原子逐步位移到势能最低位置,从而确定出最小势能的原子组态。
第六章 晶格动力学
第六章 晶格动力学 6.1 密度泛函微扰理论固体物理性质的变化依赖于他们的晶格动力学行为:红外、拉曼和中子散射谱;比热,热膨胀和热导;和电声子相互作用相关的现象如金属电阻,超导电性和光谱的温度依赖关系是其中的一部分。
事实上,借助于声子对这些问题的了解最令人信服地说明了目前固体的量子力学图像是正确的。
晶格动力学的基础理论建立于30年代,玻恩和黄昆1954年的专题论文至今仍然是这个领域的参考教科书。
这些早期的系统而确切地陈述主要建立了动力学矩阵的一般性质,他们的对称和解析性质,没有考虑到和电子性质的联系,而实际上正是电子性质决定了他们。
直到1970年才系统地研究了这些联系。
一个系统电子的性质和晶格动力学之间的联系的重要性不仅在原理方面,主要在于通过使用这些关系,才有可能计算特殊系统的晶格动力学性质。
现在用ab initio 量子力学技术,只要输入材料化学成分的信息,理论凝聚态物理和计算材料科学就可以计算特殊材料的特殊性质。
在晶格动力学性质的特殊情况下,基于晶格振动的线性响应理论,大量的ab initio 计算在过去十年中通过发展密度泛函理论已经成为可能。
密度泛函微扰理论是在密度泛函理论的理论框架之内研究晶格振动线性响应。
感谢这些理论和算法的进步,现在已经可以在整个布里渊区的精细格子上精确计算出声子色散关系,直接可以和中子衍射数据相比。
由此系统的一些物理性质(如比热、熱膨胀系数、能带隙的温度依赖关系等等)可以计算。
1 基于电子结构理论的晶格动力学从固体电子自由度分离出振动的基本近似是Born-Oppenhermer (1927) 的绝热近似。
在这个近似中,系统的晶格动力学性质由以下薛定谔方程的本征值ε和本征函数()ΦR 决定。
()()()2222I I I E M εΦΦ⎛⎫∂-+= ⎪∂⎝⎭∑R R R R (6.1.1) 这里I R 是第I 个原子核的坐标,I M 是相应原子核的质量,{}I ≡R R 是所有原子核坐标的集合,()E R 是系统的系统的限位离子能量,常常称为Born-Oppenhermer 能量表面。
L12-Al3Li金属间化合物点缺陷浓度的第一原理计算
度较大。运用 Arrhenius 方程计算点缺陷的有效形成焓,结果显示 Al 反位和 Li 反位的有效形成焓较小且基本相
同,Li 空位次之,Al 空位最大。
关键词:Al3Li 金属间化合物;第一原理计算;点缺陷浓度;形成焓;Wagner–Schottky 模型
中图分类号:TG146.2
文献标志码:A
尽管人们对铝锂合金的组织、性能和工艺方面已 开展了大量的研究工作[10−17],但有关 Al3Li 金属间化 合物点缺陷浓度的相关报道还很少。孙立岩等[18]运用 微观相场理论研究了 Al3Li 金属间化合物中两种反位 缺陷浓度随温度和成分的变化规律,给出了一些初步
而在自洽计算(SCF)时则应用了 PULAY[29]混合算法来 计算,体系总能量的收敛取值为 5.0×10⁻⁶ eV/atom, 每 个 原 子 上的 力 低于 0.1 eV/nm , 公 差 偏移 小 于 5×10⁻⁵ nm,应力偏差低于 0.02 GPa。
2 计算结果与讨论
2.1 Al、Li 及 Al3Li 金属间化合物的基本物性 首先计算 L12Al3Li 金属间化合物中两组元 Al、
Li 纯元素的基本性质,计算结果见表 1。从表 1 中可 以看到计算的 Al 和 Li 元素的晶格常数与实验值符合
在对金属间化合物基本性质的研究中,人们发现 点缺陷的存在对金属间化合物的物理和力学性能有着
- 1、下载文档前请自行甄别文档内容的完整性,平台不提供额外的编辑、内容补充、找答案等附加服务。
- 2、"仅部分预览"的文档,不可在线预览部分如存在完整性等问题,可反馈申请退款(可完整预览的文档不适用该条件!)。
- 3、如文档侵犯您的权益,请联系客服反馈,我们会尽快为您处理(人工客服工作时间:9:00-18:30)。
a r X i v :c o n d -m a t /9911206v 1 13 N o v 1999LAPW frozen-phonon calculation,shell model lattice dynamics andspecific-heat measurement of SnOS.Koval a ∗,R.Burriel b ,M.G.Stachiotti a ,M.Castro b R.L.Migoni a ,M.S.Moreno d †,A.Varela d and C.O.Rodriguez ea Instituto de F´ısica Rosario,Universidad Nacional de Rosario,27de Febrero 210Bis,2000Rosario,Argentina.b Instituto de Ciencia de Materiales de Arag´o n,CSIC,Universidad de Zaragoza,Plaza de San Francisco,50009Zaragoza,Spain.c Departamento de F´ısica,TENAES,Universidad Nacional de La Plata,C.C.67,1900La Plata,Argentina.d Dpto.de Qu´ımica Inorg´a nica,Facultad de Ciencias Qu´ımicas,Universidad Complutense,28040Madrid,Spain.e IFLYSIB,Grupo de F´ısica del S´o lido,C.C.565,1900La Plata,Argentina.Abstract An ab-initio Linear Augmented Plane-Wave (LAPW)calculation of the zone-centered phonon frequencies of SnO has been performed.Eg symmetry has beenascribed to the mode observed at 113cm −1in Raman measurements,discard-ing a previous B 1g assignement.The other phonon modes measured by Ramanspectroscopy are also well reproduced.A new shell-model has also been devel-oped,that gives good agreement of the zone-centered frequencies compared tothe measured data and the LAPW results.Specific heat measurements havebeen performed between 5K and putation of the specific heat andthe M¨o ssbauer recoilless fraction with the improved shell-model shows a good agreement with the experimental data as a function of temperature.PACS numbers:63.20.Dj,76.80.+ySnO has not been subject of extensive investigations due to its thermal decomposition at relatively low temperatures,precluding applications.Presently it is object of a renewed interest,due to its ability to be an excellent anode material[1]and,so far,there is no confident description of its vibrational structure.Very recently,three contributions were concerned with an appropiate description of its electronic properties[2–4].However,a proper description of its phonons and lattice dynamics is absent.A shell model for the lattice dynamics of SnO has been developed recently with the aim to analyse the M¨o ssbauer recoilless fraction of Sn[5].The resulting zone center phonon frequencies have been compared with ab-initio full potential linear-muffin-tin-orbital(LMTO)calculations [4]and Raman and infrared reflectivity measurements[6].The agreement was in general good for the M¨o ssbauer data as well as for the phonon frequencies.However,the latter showed some discrepancies.On one hand,the analysis of the experimental data assigned the B1g symmetry to a Raman peak at113cm−1,while both the LMTO and shell model calculations gave a frequency of≈370cm−1for the B1g mode.Since this mode involves only oxygen displacements,it is hard to believe that it has such a low frequency as experimentally assigned,because there are other Sn-modes with higher frequencies.This inconsistency in the assignment of the113 cm−1Raman peak remained unnoticed even in the most recent works[7].On the other hand, the lowest frequency mode is of E g symmetry,involving mainly Sn displacements,and has a frequency of160or143cm−1according to the shell model[5]or the LMTO[4]calculation, respectively.An additional discrepancy appears for the A2u mode,which has a frequency of 255cm−1for the shell model,while the LMTO calculation leads to a value of396cm−1,and no experimental data is available for this mode.In order to elucidate these questions we undertake in this work a full potential LAPW calculation of the zone-center modes,which is more confident than the LMTO method for the calculation of phonon energies,particularly in the quite open structure of SnO.We then refine the shell model parameters byfitting them to the LAPW results and the spectroscopic experimental data.In addition,we present measurements of the specific heat,which will allow to check the consistency of the determined shell-model parameters.We remark that the development of a reliable model of SnO should be interesting for the study of the tweedmicrostructure associated with this intrisically non-stoichiometric compound[8].The ab-initio calculations were performed within the Local Density Approximation(LDA) to density functional theory,using the full-potential LAPW method.In this method no shape approximation on either the potential or the electronic charge density is made.We use the WIEN95implementation of the method[9]which allows the inclusion of local orbitals(LO)in the basis,making possible a consistent treatment of semicore and valence states in one energy window hence insuring proper orthogonality[10].The Ceperley-Alder parametrization for the exchange-correlation potential is used[11].The atomic sphere radii(R i)2.15and1.60a.u.were used for Sn and O,respectively.For the parameter RK max,which controlls the size of the basis sets in these calculations,we take the value of8.This gives well converged basis sets consisting of approximately990LAPW functions plus local orbitals.We introduce LO to include the following orbitals in the basis set: Sn4p and4d,and O2s.Integrations in reciprocal space were performed using the tetrahedron-method.We used 7×7×5meshes which represent30k-points in the irreducible Brillouin zone.We determined the phonon frequencies and eigenvectors of particular symmetry using the frozen phonon approach,by calculating atomic forces for several small displacements(u≈0.3% of the lattice constant)consistent with the symmetry and small enough to be in the linear regime.From the forces as a function of displacements the dynamical matrix was constructed and diagonalized.We observe in Table I that in general the LAPW-frequencies are somewhat smaller than the LMTO values.The LAPW result for the E u mode is in better agreement with the experiment than the LMTO result.The lowest mode is confirmed to be of E g symmetry as in the LMTO calculation[4],although it lies considerably lower in frequency.The present LAPW calculation leads to a frequency for this mode in exact agreement with the position of the peak observed in the Raman experiment[6].However the experimental analysis leads to an identification of this peak as arising from the B1g mode.We believe that this assignement is wrong on the basis of several grounds.First,both ab-initio calculations already mentioned predict the E g symmetry for the lowest frequency mode.Second,the B1g mode involves only antiparallel z-displacementsof O ions,while the A1g mode is the analogous for the Sn ions.Both modes are determined by Sn-O interactions,while the Sn-Sn and O-O forces play an additional role in the A1g and the B1g modes,respectively.Therefore,as long as the Sn-O interaction is dominant(as it comes out from the LAPW calculations and shell model results which will be described latter),the higher frequency mode will be the one corresponding to movements of lighter atoms,i.e.the B1g mode.Third,for the isostructural compound P bO,the measured frequency of the B1g mode[12]is close to the calculated value for tin monoxide.The frequency of the A2u mode could not be confidently determined.As a consequence of the general underestimation of the electronic band gap within the LDA,we obtain a very small band gap for SnO.When the atoms are displaced according to the A2u eigenvector pattern,part of the conduction band crosses below the top of the valence band and thus becomes populated. This affects the displacement dependence of the energy,which leads to an unreliable frequency value of this phonon.The same problem arises from the LMTO calculation,which is based also on the LDA,so that the previously published value is also unreliable.[4] Now we improve the shell model of Ref.[5].It contains short range shell-shell interactions of the Buckingham form for the nearest neighbor pairs O-O and Sn-O and up to second neighbors for the Sn-Sn pair,as well as long range Coulomb interactions among all ions.Starting from the parameter values given in Ref.[5]we furtherfitted them to the new LAPW results,in addition to the experimental phonon data.The most significant differences,which appeared for the E g modes,could be corrected by modifying the O-O interaction potential and the O polarizability.We also adjusted slightly the Sn-O interaction to improve thefitting.With the parameter set shown in Table II we obtain the zone-center phonon frequencies shown in Table I.A good agreement with the LAPW results is achieved.Also the experimental data are well reproduced,except for the113cm−1experimental phonon data,as previously discussed. Considering the experimental values for the E u and A1g modes and the LAPW values for the remaining zone center modes we obtain a RMS frequency difference of7cm−1with our shell model result.The shell model phonons are stable throughout the Brillouin zone.In order to validate the present shell model with experimental data we use it to compute both the M¨o ssbauer recoiless fraction and the phonon density of states(PDOS)which allows adirect calculation of the specific heat.The M¨o ssbauer recoilless fraction f(T)calculated with the present model shows no significant difference with the previous calculation[5].The specific heat of SnO has been measured in a commercial adiabatic calorimeter from Termis Ltd.[13]between5K and110K.An amount of2g of afinely grounded sample was sealed in the1cc sample container with50mbar of He gas to improve the heat exchange and temperature equilibrium.Below5K the helium gas was absorbed on the sample surface preventing to reach thermal equilibrium within measurable times.Carbon-glass and Rh-Fe thermometers were used on the sample holder and on the adiabatic shield that surrounds it. The temperature of the shield is controlled to follow the sample temperature providing adiabatic conditions.The sample specific heat was obtained after substracting the empty sample holder contribution measured on a previous experiment.The experimental values,shown in Fig.1a, present a characteristic maximum at10K in the C p/T3vs.T representation.The effective Debye temperatures,derived from the calorimetric data,have been represented in Fig.1b.From the calculated PDOS we derived the molar heat capacity using the following expresion:C v(T)=3nR ωmax0g(ω)E ¯hωsinh(x/2) 2(2)The low-frequency limit of g(ω)has been smoothed byfitting a quadratic law to the histogram, in order to avoid the influence of noise in the evaluation of the heat capacity.To take into account an estimated presence of10%Sn vacancies in the employed samples,we use a value n=1.9for the evaluation of C v according to Eq.(1)as well as for the conversion of the experimental data to molar units.Note that C v≈C p for a solid,thus we shall compare directly the calculated C v with the measured C p.The calculated specific heat,shown in Fig. 1a,has the maximum shifted to a higher temperature,16K,with a height slightly lower than for the experimental data.A similar behaviour can be seen on the efective Debye temperatures, represented in Fig1b,with the minimum slightly shifted with respect to the experimental one.The calculations have a remarkable coincidence with the experimental measurements above15 K.The whole result is quite good considering that the model corresponds to a perfect solid. Cation vacancies and the elastic relaxation existing in the real solid[8]have not been taken into account in the model.Also the uncertainty in the acoustic and low-frequency modes,which give the most important contribution to the specific heat at low temperature,can account for the difference between calculated and experimental data.As general features in our calculation,we observe a small Debye region of≈4K(defined as the region whereΘ(T)≈Θ(T=0K))and a large drop(≈35%of the zero-temperature value)inΘ(T)at low temperatures.The origin of these behaviours may be ascribed to a strong hybridization of the acoustic and low frequency optical bands near the center of the Brillouin zone(BZ),which can be observed particularly in the(k,k,0)symmetry direction(the same result is found in our previous shell model calculation[5]).This hybridization causes on one hand the onset of curvature in the acoustic dispersion curves at quite low frequencies which accounts for the small Debye region mentioned.On the other hand,the mentioned hybridization causes low lying modes towards the end of BZ which are responsible for the large drop in the Debye temperature.Recently,the partial Sn-PDOS has been obtained from measurements performed in the Ad-vanced Photon Source at the Argonne National Laboratory[14].The accord with our results is very good in the positions as well as in the height of the peaks.Moreover,this accord,together with the fact that our calculated partial O-PDOS has nearly vanishing spectral weight for fre-quenciesω<220cm−1,reinforces our conclusion that the oxygen mode of B1g symmetry was wrongly assigned in Raman experiments[6].These results will be published elsewhere together with data on other Sn compounds.Acknowledgements:Partial support from CICYT Project no.MAT97-0987is acknowl-edged.Support through fellowships and a grant from the Consejo Nacional de Investigaciones Cient´ıficas y T´e cnicas de la Rep´u blica Argentina is also acknowledged.REFERENCES[1]Y.Idota,T.Kubota,A.Matsufuji,Y.Maekawa,and T.Miyasaka;Science276,1395(1997).[2]I.Lefebvre,M.A.Szymanski,J.Olivier-Fourcade and J.C.Dumas;Phys.Rev.B58,1896(1998).[3]M.Meyer,G.Onida,A.Ponchel and L.Reining;Comput.Mater.Sci.10,319(1998).[4]E.Peltzer y Blanc´a,A.Svane,N.E.Christensen,C.O.Rodriguez,O.M.Cappannini andM.S.Moreno;Phys.Rev.B48,15712(1993).[5]S.Koval,M.G.Stachiotti,R.L.Migoni,M.S.Moreno,R.C.Mercader and E.L.Peltzer yBlanc´a;Phys.Rev.B54,7151(1996).[6]J.Geurts,S.Rau,W.Richter and F.J.Schmitte;Thin Solid Films121,217(1984).[7]L.Sangaletti,L.E.Depero,B.Allieri,F.Pioselli,ini,G.Sberveglieri and M.Zocchi;J.Mater.Res.13,2457(1998).[8]M.S.Moreno,A.Varela and L.C Otero-D´ıaz;Phys.Rev.B56,5186(1997).[9]P.Blaha,K.Schwarz,P.Dufek and R.Augustyn,WIEN95,Technical University of Vienna1995.(Improved and updated Unix version of the original copyrighted WIEN-code,which was published by P.Blaha,K.Schwarz,P.Sorantin and S.B.Trickey;Comput.Phys.Commun.59,3991990).[10]D.Singh,Phys.Rev.B43,6388(1991).[11]D.M.Ceperley and B.J.Alder;Phys.Rev.Lett.45,566(1980).[12]D.M.Adams,A.G.Christy,J.Haines,S.M.Clark,Phys.Rev.B46,11358(1992);D.M.Adams and D.C.Stevens,J.Chem.Soc.Dalton1977,1097(1977).[13]F.Pavese and V.M.Malyshev,Adv.Cryogenic Engineering40,119(1994).[14]M.Y.Hu,W.Sturhahn,T.S.Toellner,E.E.Alp,P.L.Lee,P.M.Hession,S.Koval and R.L.Migoni,unpublished.04080120T(K)200300400500Θ(K )3060C p T−3(a)(b)FIG.1.Specific heat (a)and effective Debye temperature (b)as functions of temperature.Solid line:shell model calculation.Open circles:experimental data.The C p /T 3values are given in units of 10−75.7R/K 3TABLE I.Frequencies of the TO zone-center modes of SnO:for thefirst-principle LAPW calcu-lation,for the shell model,for the LMTO calculation and for the experiment(Unit:cm−1).We also show the relative atomic displacements for each mode,according to the LAPW calculation.A and B symmetries correspond to c-polarized modes,E symmetries to a-polarization.+(−)means in-phase (out of phase)ionic motions.LAPW LMTO[4]Sn+Sn Sn−SnE g45001A2u24010B1g357113?01E u26726010A1g21121100E g12200.17TABLE II.Parameters of the model:a,b,c:potential parameters;Z,Y:ionic and shell charges; K:on site core-shell force constant;A,B:longitudinal and transversal force constants between neigh-boring ions.Interaction a(ev)b(˚A−1)c(eV˚A6)A(e2/v a)B(e2/v a)Ion Z(|e|)Y(|e|)K(e2/v a)。